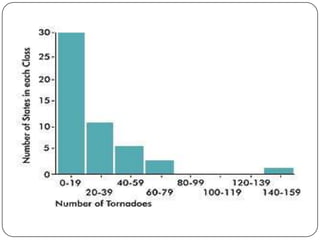
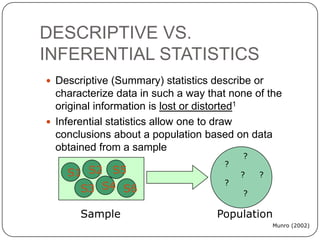
NOR LAILATUL AZILAH HAMDZAH
2012132013
QUANTITATIVE DATA
ANALYSIS
2 FUNDAMENTAL TYPES OF
NUMERICAL DATA
 To collect information such as
abilities, attitudes, beliefs, reactions and etc.
 It can be reported in 3 ways – words, numbers
and sometime through graphs or chart
QUANTITATIVE DATA
 Are obtained when the variable being studied is
measured along a scale that indicates how much
of the variable is present.
 Are reported in term of score
 E.g: the anxiety scores of all first-year students
enrolled at San Francisco University at 2002
(variable – anxiety)
1.Descriptive statistics
 Descriptive statistics are numbers that
are used to summarize and describe
data (the information that has been
collected from an experiment, a
survey, an historical record, etc.).
1.Descriptive statistics
Descriptive statistics is just
descriptive. It does not involve
generalizing beyond the data at
hand. Generalizing from our data to
another set of cases is the business
of inferential statistics.
 Allows one to examine each variable
separately to check for data
inconsistencies, variability of variables
 Also allows one to check statistical
assumptions about the shape of the
distribution before moving on to more
complex analysis
 Univariate descriptive statistics can also
be used to determine central
tendency, variability, skewness, and
1.Descriptive statistics
 It can include:
graphical summaries that show the
spread of the data; numerical
summaries that either measure the
central tendency (a 'typical' data value)
of a data set or describe the spread of
the data.
Example: numerical summary
 Descriptive statistics is central to the world of sports.
For the Olympic marathon (a foot race of 26.3
miles), we possess data that cover more than a
century of competition. (The first modern Olympics
took place in 1896). The following table shows the
winning times for women, who have only been
allowed to compete since 1984).
Year Winner Country Time
1984 Joan
Benoit
USA 2:24:52
1988 Rosa Mota Portugal 2:25:40
1992 ValentinaY
egorova
UT 2:32:41
1996 Fatuma
Roba
Ethiopia 2:26:05
2000 Naoko
Takahashi
Japan 2:23:14
2004 Mizuki
Noguchi
Japan 2:26:20
Example: graphical summary
 A kind of graphical summary is the
histogram, which combines data into groups or
classes as a way to generalize the details of a
data set while at the same time illustrate the
data's overall pattern.
 Let’s see an example.
 In the previous histogram we see that the first class
contains all the States that experienced between
zero and nineteen tornadoes during 2000.
 Histograms can show gaps where no data values
exist (the 100-119 class). In this one, there are three
empty classes: 80-99, 100-119, and 120-139.
2.Inferential statistics
 Inferential statistics is used to make
inferences, predictions or comparisons from
our data to more general conditions.
 Are certain types of procedures that allow
researchers to make inferences about a
population based on findings from the sample.
2.Inferential statistics
 On the contrary, with descriptive statistics we
condense a set of known numbers into a few
simple values (either numerically or
graphically) to simplify an understanding of
those data.
 Other examples of inferential statistics
methods include hypothesis testing, linear
regression, and principle components
analysis.
2.1.Hypothesis testing
 Statistical hypothesis is an assumption about
a population parameter. This assumption may
or may not be true.
 The best way to determine whether a
statistical hypothesis is true would be to
examine the entire population. Since that is
often impractical, researchers typically
examine a random sample from the
population.
2.1.Hypothesis testing
 There are two types of statistical hypotheses.
Null hypothesis (denoted by H0): the
hypothesis that sample observations result
purely from chance.
Alternative hypothesis (denoted by H1 or
Ha): the hypothesis that sample observations
are influenced by some non-random cause.
2.1.Hypothesis testing
 Statisticians follow a formal process to determine
whether to accept or reject a null
hypothesis, based on sample data. This process
is called hypothesis testing.
 It consists of four steps:
1st step. State the hypotheses.
This involves stating the null and alternative
hypotheses. The hypotheses are stated in such a
way that they are mutually exclusive. That is, if
one is true, the other must be false.
2.1Hypothesis testing
2nd step. Formulate an analysis plan. It
describes how to use sample data to accept
or reject the null hypothesis. The accept/reject
decision often focuses around a single test
statistic.
3rd step. Analyze sample data.
Find the value of the test statistic (mean
score, proportion, t-score, z-score, etc.)
described in the analysis plan. Complete other
computations, as required by the plan.
2.1Hypothesis testing
4th step. Interpret results.
Apply the decision rule described in the analysis
plan. If the test statistic supports the null
hypothesis, accept the null hypothesis;
otherwise, reject the null hypothesis.
Hypothesis testing: example
 We wish to prove a new vaccine is more effective
than the current vaccine used for preventing a
particular disease. The null hypothesis is that
there is no difference in efficacy between the two
vaccines. The alternative hypothesis is that the
new vaccine is better.
Hypothesis testing: example
 We need a measurement that indicates the
efficacy of each vaccine. The difference
between the count of occurrences of the
disease for the old vaccine and the count of
occurrences of the disease for the new
vaccine is calculated. If it is sufficiently
large, the null hypothesis - that there is no
difference between in efficacy between the
two vaccines - is rejected. If the difference is
not sufficiently large, we fail to reject the null
hypothesis.
Hypothesis testing: example
 In all hypothesis testing, the final conclusion once
the test has been carried out is always given in
terms of the null hypothesis.
DESCRIPTIVE VS.
INFERENTIAL STATISTICS
 Descriptive (Summary) statistics describe or
characterize data in such a way that none of the
original information is lost or distorted1
 Inferential statistics allow one to draw
conclusions about a population based on data
obtained from a sample
Munro (2002)
S1 S2
S3 S4
S5
S6
?
??
?
?
?
Sample Population
Graphical Methods for Displaying
Data
 Frequency Distributions
 Histograms
 Plots
 Pareto Charts
 Boxplots
 Error Bar Charts
Cytoplasm
PlasmaMembrane
ExtracellularSpace
NucleusLocation
Simple Bar Chart Nominal data
Stacked Bar Chart
0%
10%
20%
30%
40%
50%
60%
70%
80%
90%
100%
1 2 3 4 5 6 7 8 9
X3
X2
X1
G-protein coupled receptor
cy tokine
enzy me
growth f actor
ion channel
kinase
ligand-dependent nuclear receptor
peptidase
phosphatase
transcription regulator
translation regulator
transmembrane receptor
transporter
16
14
100
12
16
68
10
24
14
107
1
35
57
25 50 75 100
Histogram of Family Terms
Histogram Std Err Bars
Normal Dist Fit
Simple Scatterplot
20
30
40
50
60
70
80
90
100
Humid1:PM
0 2.5 5 7.5 10 12.5 15
wrSpeed SAS (1989–2004)
The End…. Any Question?

QUANTITAIVE DATA ANALYSIS

  • 1.
    NOR LAILATUL AZILAHHAMDZAH 2012132013 QUANTITATIVE DATA ANALYSIS
  • 2.
    2 FUNDAMENTAL TYPESOF NUMERICAL DATA  To collect information such as abilities, attitudes, beliefs, reactions and etc.  It can be reported in 3 ways – words, numbers and sometime through graphs or chart
  • 3.
    QUANTITATIVE DATA  Areobtained when the variable being studied is measured along a scale that indicates how much of the variable is present.  Are reported in term of score  E.g: the anxiety scores of all first-year students enrolled at San Francisco University at 2002 (variable – anxiety)
  • 4.
    1.Descriptive statistics  Descriptivestatistics are numbers that are used to summarize and describe data (the information that has been collected from an experiment, a survey, an historical record, etc.).
  • 5.
    1.Descriptive statistics Descriptive statisticsis just descriptive. It does not involve generalizing beyond the data at hand. Generalizing from our data to another set of cases is the business of inferential statistics.
  • 6.
     Allows oneto examine each variable separately to check for data inconsistencies, variability of variables  Also allows one to check statistical assumptions about the shape of the distribution before moving on to more complex analysis  Univariate descriptive statistics can also be used to determine central tendency, variability, skewness, and 1.Descriptive statistics
  • 7.
    1.Descriptive statistics  Itcan include: graphical summaries that show the spread of the data; numerical summaries that either measure the central tendency (a 'typical' data value) of a data set or describe the spread of the data.
  • 8.
    Example: numerical summary Descriptive statistics is central to the world of sports. For the Olympic marathon (a foot race of 26.3 miles), we possess data that cover more than a century of competition. (The first modern Olympics took place in 1896). The following table shows the winning times for women, who have only been allowed to compete since 1984).
  • 9.
    Year Winner CountryTime 1984 Joan Benoit USA 2:24:52 1988 Rosa Mota Portugal 2:25:40 1992 ValentinaY egorova UT 2:32:41 1996 Fatuma Roba Ethiopia 2:26:05 2000 Naoko Takahashi Japan 2:23:14 2004 Mizuki Noguchi Japan 2:26:20
  • 10.
    Example: graphical summary A kind of graphical summary is the histogram, which combines data into groups or classes as a way to generalize the details of a data set while at the same time illustrate the data's overall pattern.  Let’s see an example.
  • 12.
     In theprevious histogram we see that the first class contains all the States that experienced between zero and nineteen tornadoes during 2000.  Histograms can show gaps where no data values exist (the 100-119 class). In this one, there are three empty classes: 80-99, 100-119, and 120-139.
  • 13.
    2.Inferential statistics  Inferentialstatistics is used to make inferences, predictions or comparisons from our data to more general conditions.  Are certain types of procedures that allow researchers to make inferences about a population based on findings from the sample.
  • 14.
    2.Inferential statistics  Onthe contrary, with descriptive statistics we condense a set of known numbers into a few simple values (either numerically or graphically) to simplify an understanding of those data.  Other examples of inferential statistics methods include hypothesis testing, linear regression, and principle components analysis.
  • 15.
    2.1.Hypothesis testing  Statisticalhypothesis is an assumption about a population parameter. This assumption may or may not be true.  The best way to determine whether a statistical hypothesis is true would be to examine the entire population. Since that is often impractical, researchers typically examine a random sample from the population.
  • 16.
    2.1.Hypothesis testing  Thereare two types of statistical hypotheses. Null hypothesis (denoted by H0): the hypothesis that sample observations result purely from chance. Alternative hypothesis (denoted by H1 or Ha): the hypothesis that sample observations are influenced by some non-random cause.
  • 17.
    2.1.Hypothesis testing  Statisticiansfollow a formal process to determine whether to accept or reject a null hypothesis, based on sample data. This process is called hypothesis testing.  It consists of four steps: 1st step. State the hypotheses. This involves stating the null and alternative hypotheses. The hypotheses are stated in such a way that they are mutually exclusive. That is, if one is true, the other must be false.
  • 18.
    2.1Hypothesis testing 2nd step.Formulate an analysis plan. It describes how to use sample data to accept or reject the null hypothesis. The accept/reject decision often focuses around a single test statistic. 3rd step. Analyze sample data. Find the value of the test statistic (mean score, proportion, t-score, z-score, etc.) described in the analysis plan. Complete other computations, as required by the plan.
  • 19.
    2.1Hypothesis testing 4th step.Interpret results. Apply the decision rule described in the analysis plan. If the test statistic supports the null hypothesis, accept the null hypothesis; otherwise, reject the null hypothesis.
  • 20.
    Hypothesis testing: example We wish to prove a new vaccine is more effective than the current vaccine used for preventing a particular disease. The null hypothesis is that there is no difference in efficacy between the two vaccines. The alternative hypothesis is that the new vaccine is better.
  • 21.
    Hypothesis testing: example We need a measurement that indicates the efficacy of each vaccine. The difference between the count of occurrences of the disease for the old vaccine and the count of occurrences of the disease for the new vaccine is calculated. If it is sufficiently large, the null hypothesis - that there is no difference between in efficacy between the two vaccines - is rejected. If the difference is not sufficiently large, we fail to reject the null hypothesis.
  • 22.
    Hypothesis testing: example In all hypothesis testing, the final conclusion once the test has been carried out is always given in terms of the null hypothesis.
  • 23.
    DESCRIPTIVE VS. INFERENTIAL STATISTICS Descriptive (Summary) statistics describe or characterize data in such a way that none of the original information is lost or distorted1  Inferential statistics allow one to draw conclusions about a population based on data obtained from a sample Munro (2002) S1 S2 S3 S4 S5 S6 ? ?? ? ? ? Sample Population
  • 24.
    Graphical Methods forDisplaying Data  Frequency Distributions  Histograms  Plots  Pareto Charts  Boxplots  Error Bar Charts
  • 25.
  • 26.
  • 27.
    G-protein coupled receptor cytokine enzy me growth f actor ion channel kinase ligand-dependent nuclear receptor peptidase phosphatase transcription regulator translation regulator transmembrane receptor transporter 16 14 100 12 16 68 10 24 14 107 1 35 57 25 50 75 100 Histogram of Family Terms
  • 28.
    Histogram Std ErrBars Normal Dist Fit
  • 29.
    Simple Scatterplot 20 30 40 50 60 70 80 90 100 Humid1:PM 0 2.55 7.5 10 12.5 15 wrSpeed SAS (1989–2004)
  • 30.
    The End…. AnyQuestion?