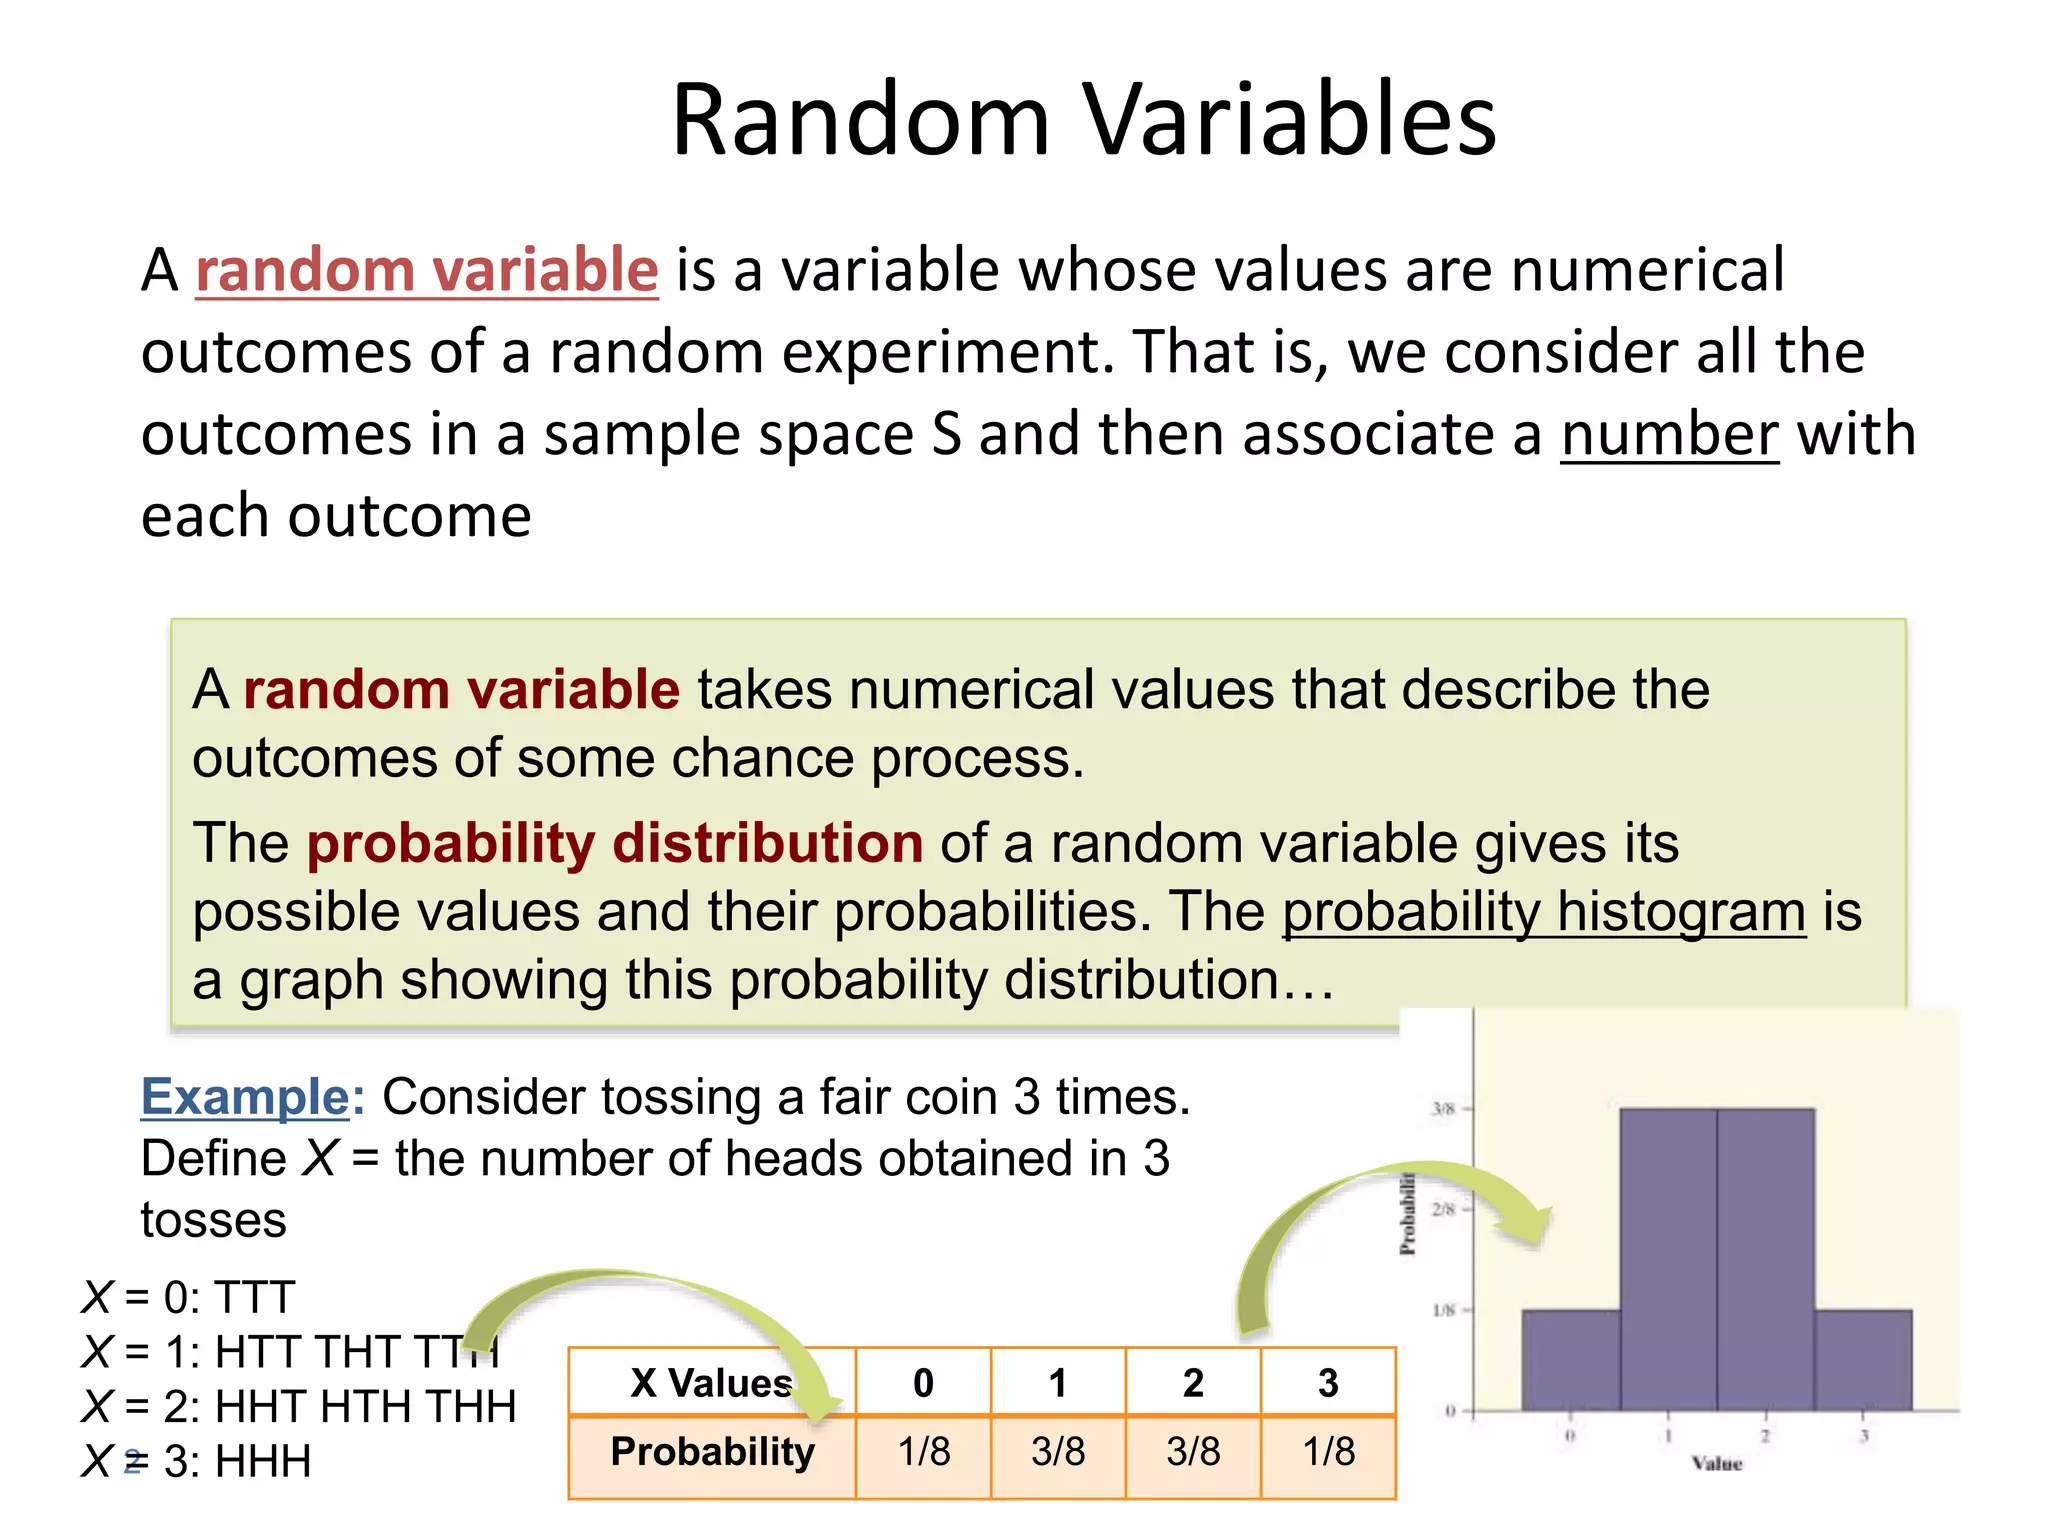
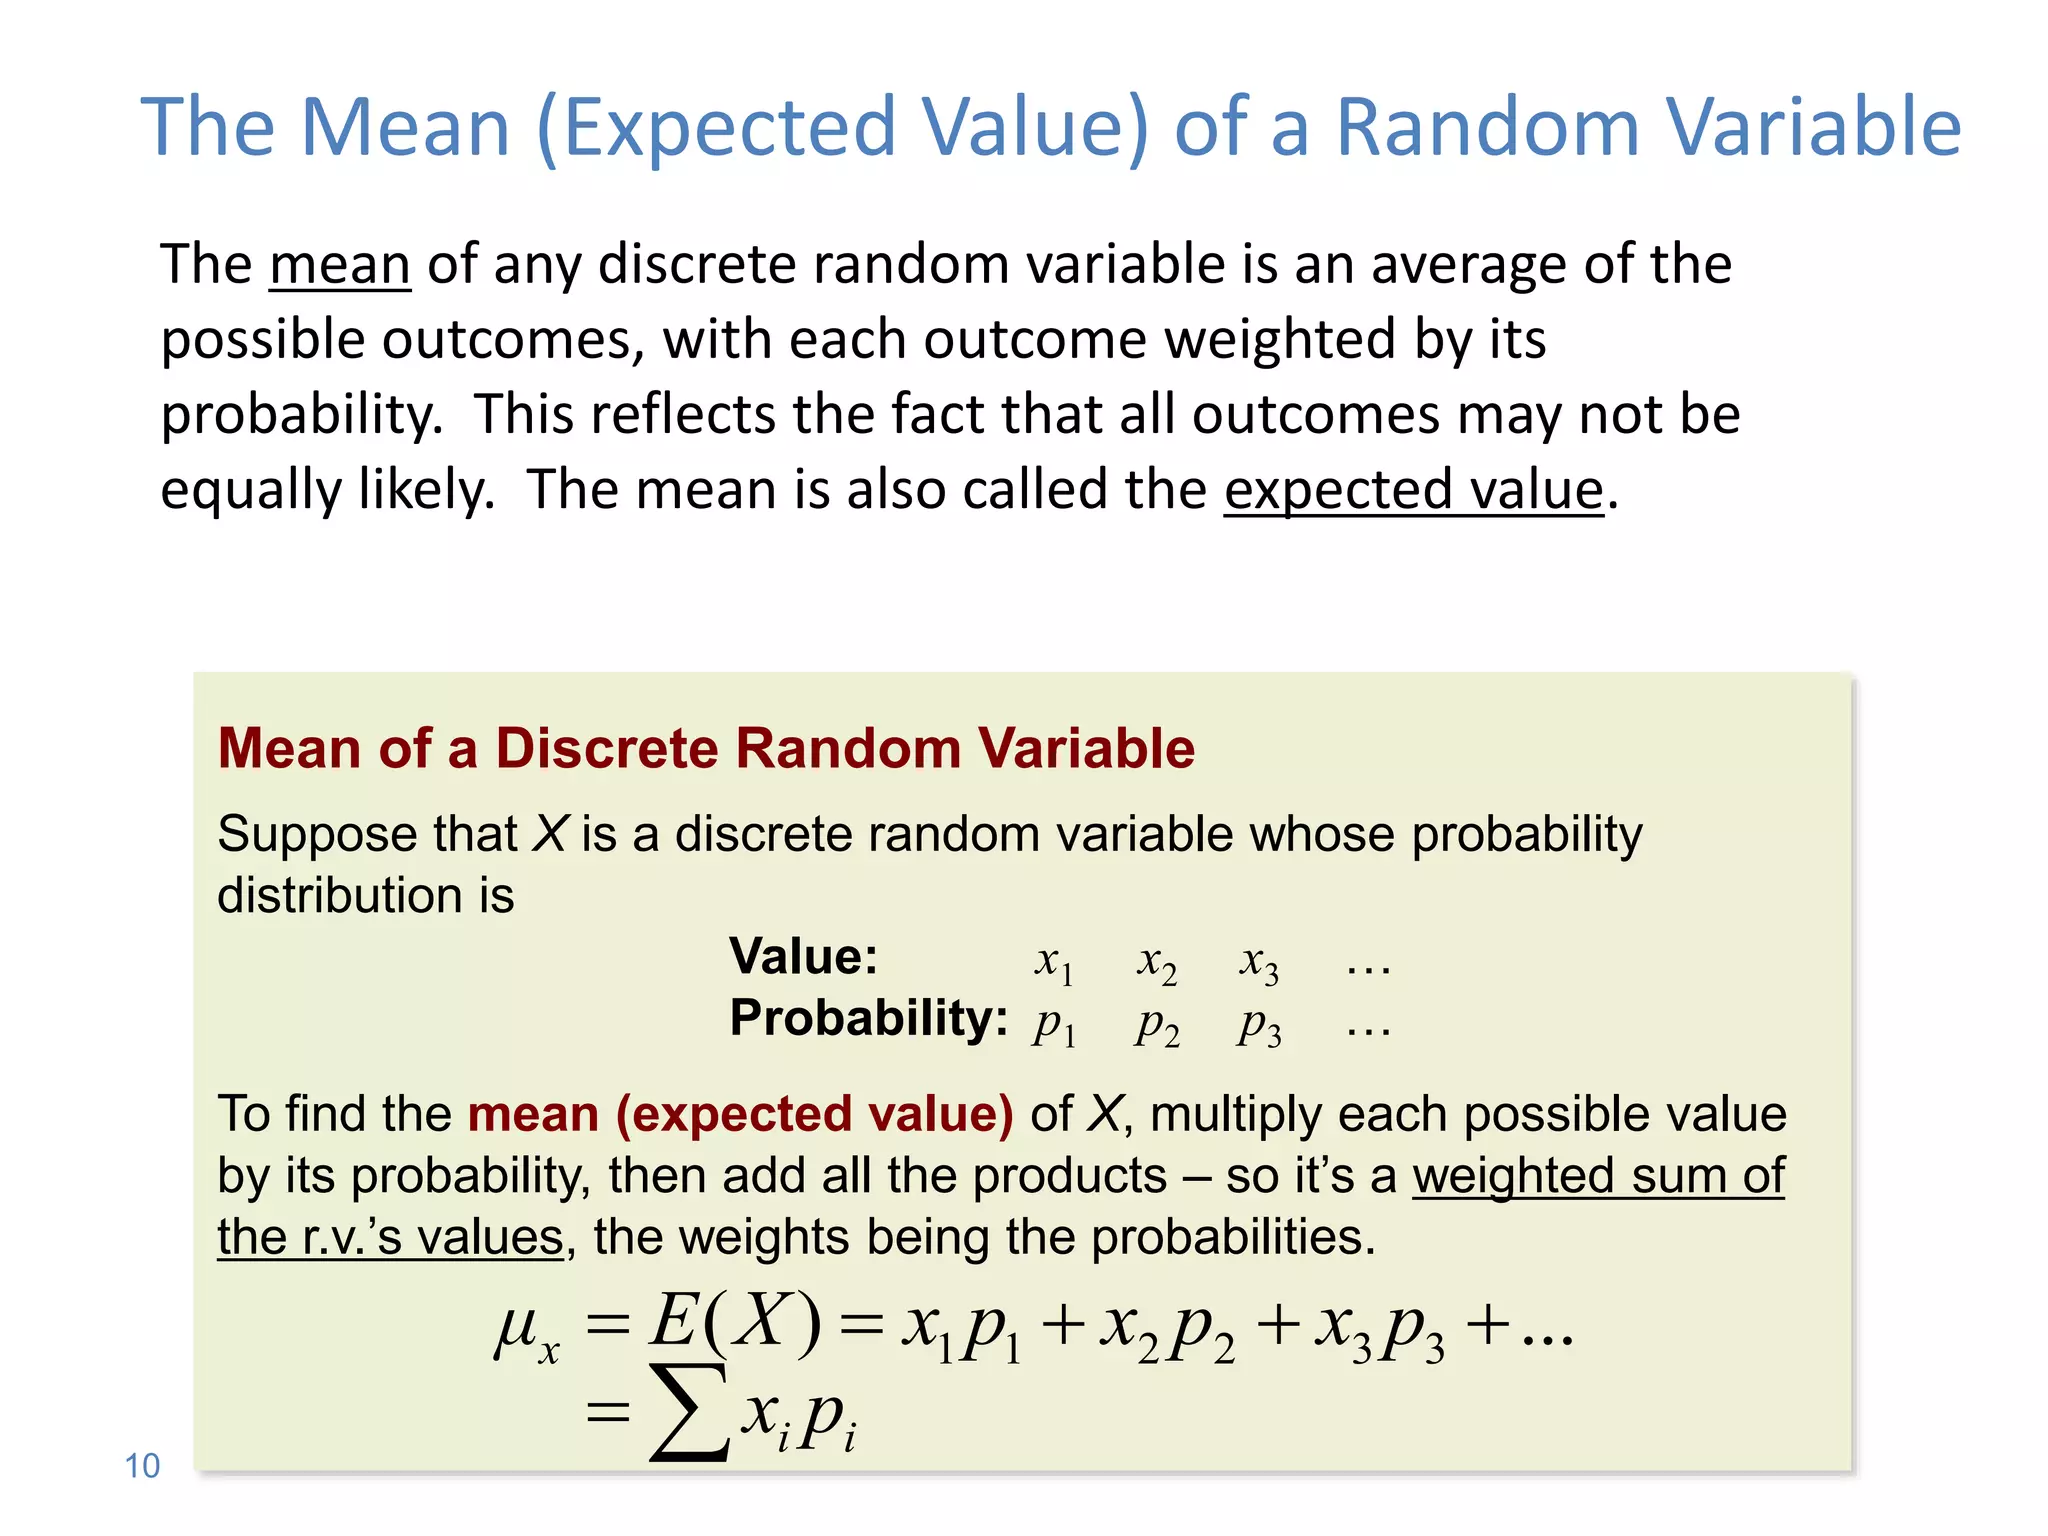
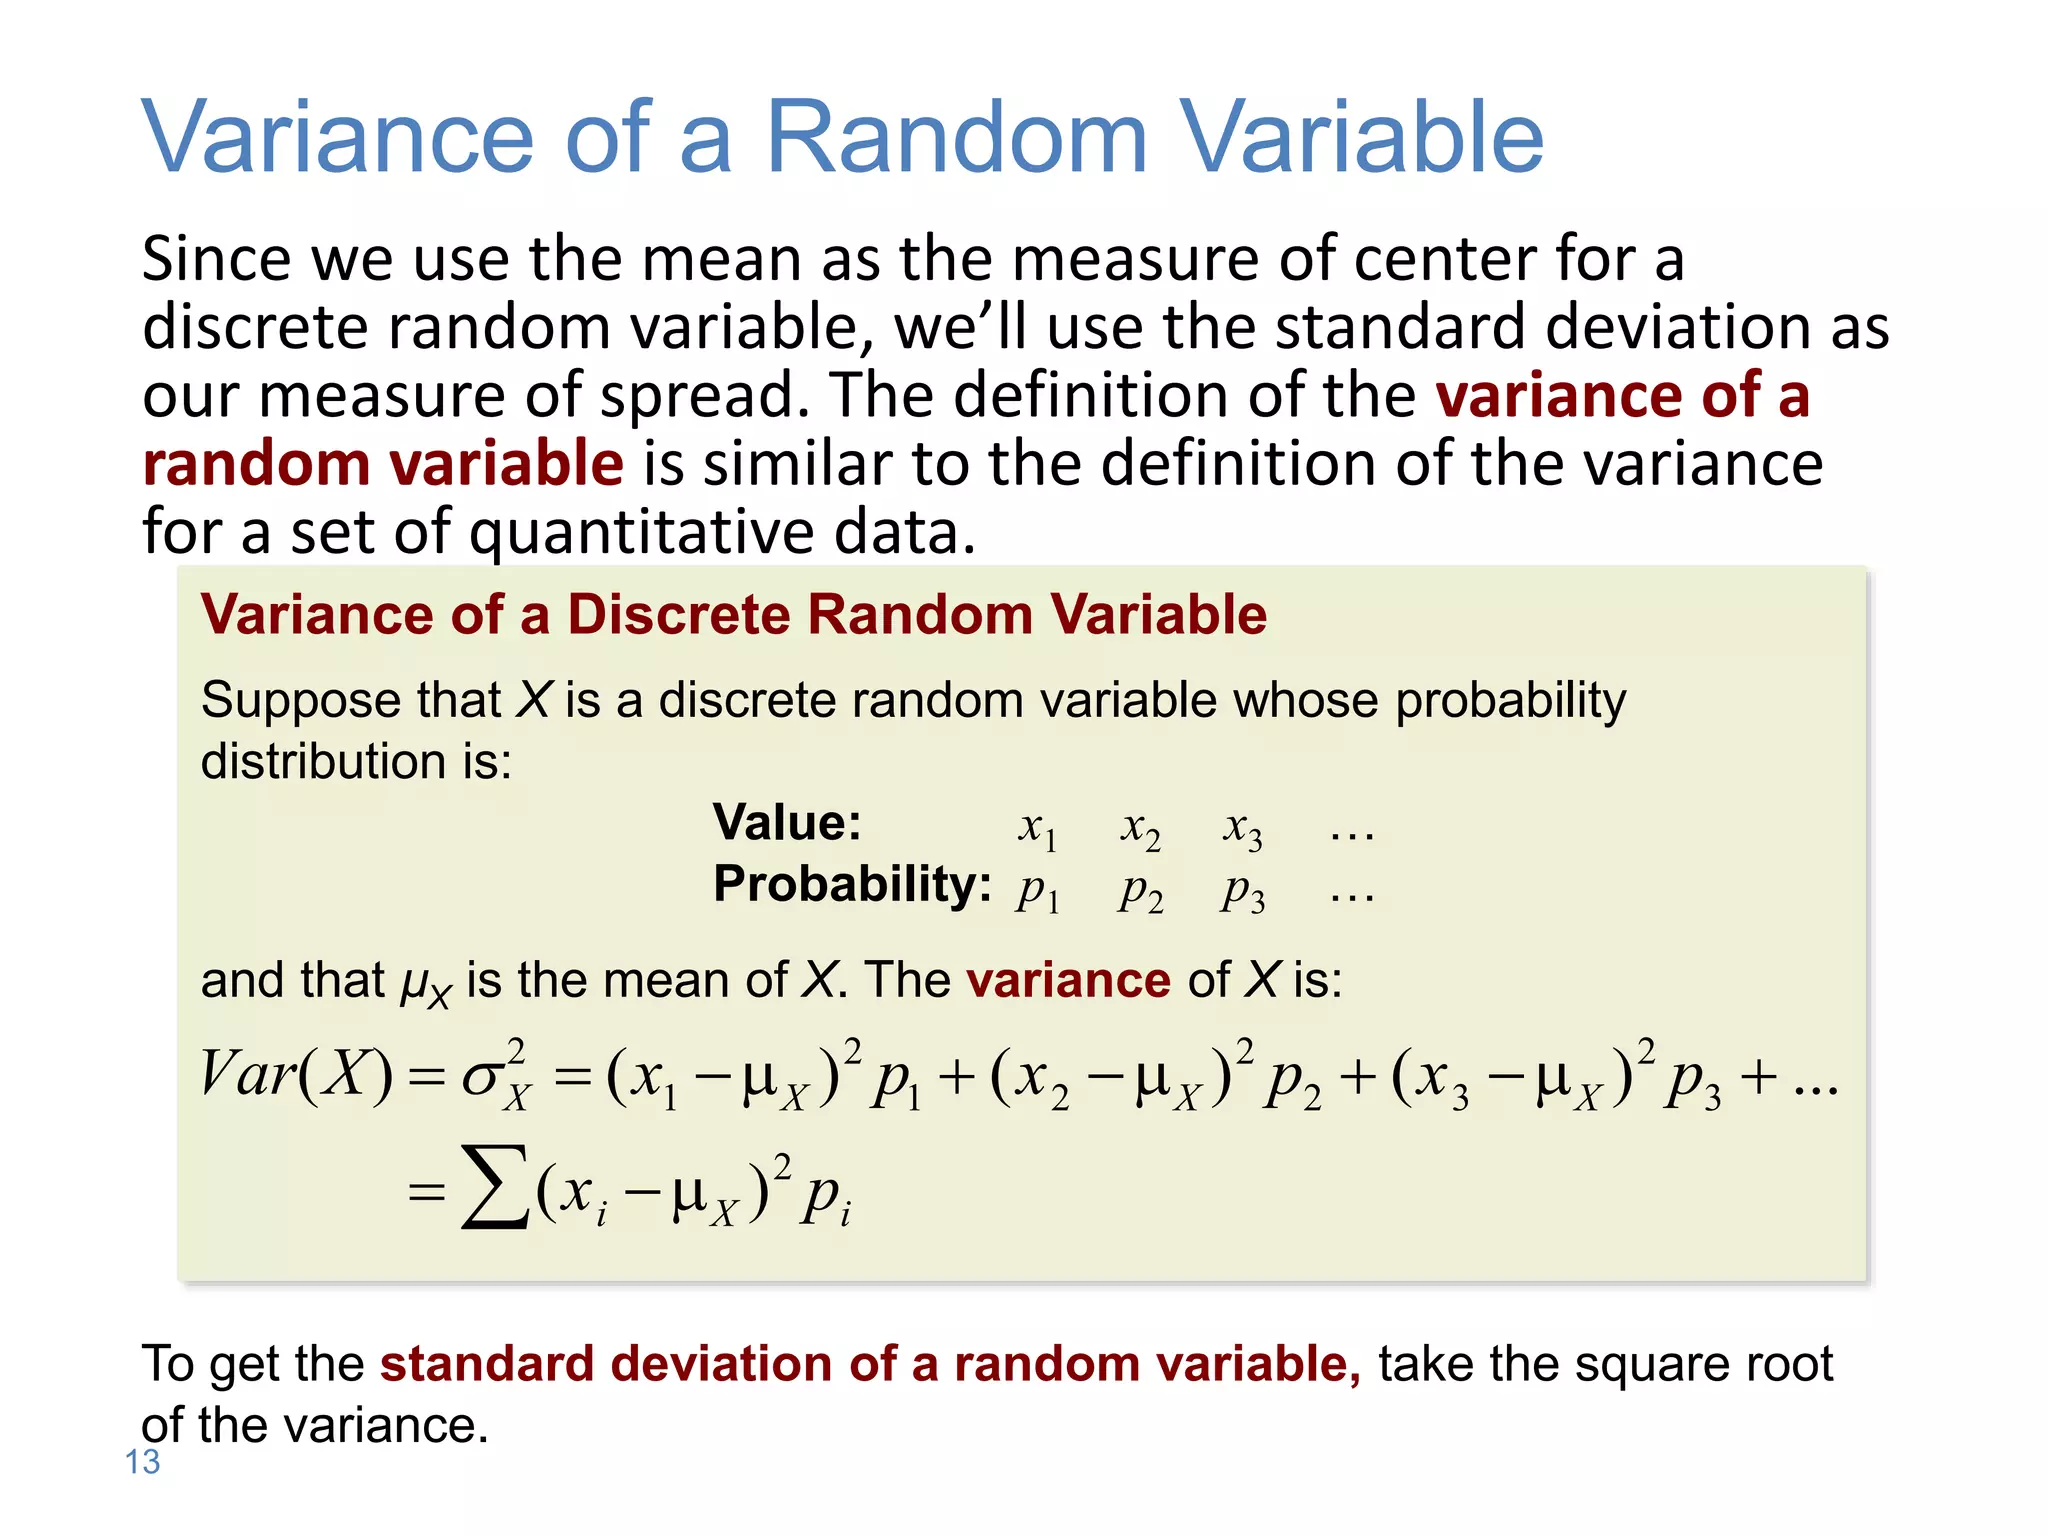
SlideShare a Scribd company logo
1 of 14
5.3 Random Variables
 Random Variable
 Discrete Random Variables
 Continuous Random Variables
 Normal Distributions as Probability Distributions
1
2
Random Variables
A random variable is a variable whose values are numerical
outcomes of a random experiment. That is, we consider all the
outcomes in a sample space S and then associate a number with
each outcome
A random variable takes numerical values that describe the
outcomes of some chance process.
The probability distribution of a random variable gives its
possible values and their probabilities. The probability histogram is
a graph showing this probability distribution…
Example: Consider tossing a fair coin 3 times.
Define X = the number of heads obtained in 3
tosses
X = 0: TTT
X = 1: HTT THT TTH
X = 2: HHT HTH THH
X = 3: HHH
X Values 0 1 2 3
Probability 1/8 3/8 3/8 1/8
• The figure below shows how to get the probability
distribution of X – use a tree diagram! Each outcome
has prob=1/16 (HINT: use the “and” rule to show
this), and then use the “or” rule to show that P(X=1)
= P(TTTH or TTHT or THTT or HTTT) etc…)
4
Discrete Random Variable
There are two main types of random variables: discrete and continuous. If we
can find a way to list all possible outcomes for a random variable and assign
probabilities to each one, we have a discrete random variable.
A discrete random variable X takes on a fixed set of possible values with
gaps between. The probability distribution of a discrete random variable X
lists the values xi and their probabilities pi:
Values of X: x1 x2 x3 …
P(X) : p1 p2 p3 …
The probabilities pi must satisfy two requirements:
1. Every probability pi is a number between 0 and 1.
2. The sum of the probabilities is 1.
To find the probability of any event regarding X, add the probabilities pi of
the particular values xi that make up the event.
5
Continuous Random Variable
Discrete random variables commonly arise from situations that involve
counting something. Situations that involve measuring something often result
in a continuous random variable.
A continuous random variable Y takes on its values in an interval of
numbers. The probability distribution of Y is described by a density
curve. The probability of any event regarding Y is the area under the
density curve and above the values of Y that make up the event.
6
Continuous Probability Models
Suppose the random expt. is “choose a number at random between 0 and 1”.
We cannot assign probabilities to each individual value because there is an
infinite interval of possible values, so we model this with a density curve (that
is flat) that gives equal weight to all the numbers between 0 and 1.
This continuous probability model assigns probabilities as
areas under the flat, uniform density curve. The area under
the curve and above any range of values is the probability of an
outcome in that range. The total area under the curve equals 1.
Example: Find the probability of
getting a random number that is
less than or equal to 0.5 OR
greater than 0.8.
P(X ≤ 0.5 or X > 0.8)
= P(X ≤ 0.5) + P(X > 0.8)
= 0.5 + 0.2
= 0.7
Uniform
distribution
7
Normal Probability Models
There are many situations where the density curve used to assign
probabilities to intervals of outcomes is Normal.
Normal distributions can be thought of as probability models:
Probabilities can be assigned to intervals of outcomes using the Standard
Normal probabilities in Table A.
We standardize normal data by calculating z-scores so that any Normal
curve N(m,s) can be transformed into the standard Normal curve N(0,1).
z
s
m)
( 

x
z
8
Normal Probability Models
Women’s heights are Normally distributed with mean 64.5 and standard
deviation 2.5 in. What is the probability, if we pick one woman at random,
that her height will be between 68 and 70 inches P(68 < X < 70)?
Because the woman is selected at random, X is a random variable.
As before, we calculate the z-
scores for 68 and 70.
For x = 68",
For x = 70",

z 
(x m)
s
4
.
1
5
.
2
)
5
.
64
68
(



z

z 
(7064.5)
2.5
 2.2
5.4 Means and Variances
of Random Variables
 The Mean of a Random Variable
 The Law of Large Numbers
 The Variance of a Random Variable
 HW problems for sections 5.3 and 5.4
9
The mean of any discrete random variable is an average of the
possible outcomes, with each outcome weighted by its
probability. This reflects the fact that all outcomes may not be
equally likely. The mean is also called the expected value.
Mean of a Discrete Random Variable
Suppose that X is a discrete random variable whose probability
distribution is
Value: x1 x2 x3 …
Probability: p1 p2 p3 …
To find the mean (expected value) of X, multiply each possible value
by its probability, then add all the products – so it’s a weighted sum of
the r.v.’s values, the weights being the probabilities.







i
i
x
p
x
p
x
p
x
p
x
X
E
μ ...
)
( 3
3
2
2
1
1
The Mean (Expected Value) of a Random Variable
10
• We’ve already discussed the mean of a density
curve as being the “balance point” of the curve… For
a discrete r.v., we’ll compute the mean (or expected
value) as a weighted average of the values of X, the
weights being the corresponding probabilities and in
either case (discrete or continuous), the
interpretation of the mean is as the long-run
average value of X (in a large number of repetitions
of the experiment giving rise to X).
• Example: The mean # of Hs in 4 tosses of a fair coin is
computed as: (1/16)*0 + (4/16)*1 + (6/16)*2 +
(4/16)*3 + (1/16)*4 = (32/16) = 2.
• What is your mean “winnings” when you play the
“Pick 3” lottery? What does it mean?
12
The Law of Large Numbers
Draw independent observations at random from any
population with finite mean µ. Decide how accurately you
would like to estimate µ. The law of large numbers says that as
you increase the number of observations, the sample mean of
the observed values gets closer and closer to the mean µ of the
population.
Law of Large Numbers: Essentially states that if you sample
from a population with mean = m, then the sample mean (x-
bar) will approximate m for large enough sample sizes. Or
that m can be thought of as the expected value (long-run
average value) of many independent observations on the
variable.
Since we use the mean as the measure of center for a
discrete random variable, we’ll use the standard deviation as
our measure of spread. The definition of the variance of a
random variable is similar to the definition of the variance
for a set of quantitative data.
Variance of a Discrete Random Variable
Suppose that X is a discrete random variable whose probability
distribution is:
Value: x1 x2 x3 …
Probability: p1 p2 p3 …
and that µX is the mean of X. The variance of X is:
Var(X)  sX
2
 (x1 mX )2
p1  (x2 mX )2
p2  (x3 mX )2
p3  ...
 (xi mX )2
pi

To get the standard deviation of a random variable, take the square root
of the variance.
Variance of a Random Variable
13
HW: Read sections 5.3 and 5.4 (up through p. 273, Law of Large
Numbers)… Don’t worry much about the computation of the
variance of a discrete random variable…
Work on Exercises # 5.43, 5.48-5.55

More Related Content

Similar to 5.3-5.4 Random Variables & Means

Chapter 4 part3- Means and Variances of Random Variables
Chapter 4 part3- Means and Variances of Random VariablesChapter 4 part3- Means and Variances of Random Variables
Chapter 4 part3- Means and Variances of Random Variablesnszakir
 
Probability distribution
Probability distributionProbability distribution
Probability distributionManoj Bhambu
 
Econometrics 2.pptx
Econometrics 2.pptxEconometrics 2.pptx
Econometrics 2.pptxfuad80
 
Random variables and probability distributions Random Va.docx
Random variables and probability distributions Random Va.docxRandom variables and probability distributions Random Va.docx
Random variables and probability distributions Random Va.docxcatheryncouper
 
Hypothesis testing.pptx
Hypothesis testing.pptxHypothesis testing.pptx
Hypothesis testing.pptxrklums91
 
2 Review of Statistics. 2 Review of Statistics.
2 Review of Statistics. 2 Review of Statistics.2 Review of Statistics. 2 Review of Statistics.
2 Review of Statistics. 2 Review of Statistics.WeihanKhor2
 
Probability distribution for Dummies
Probability distribution for DummiesProbability distribution for Dummies
Probability distribution for DummiesBalaji P
 
Probability, Discrete Probability, Normal Probabilty
Probability, Discrete Probability, Normal ProbabiltyProbability, Discrete Probability, Normal Probabilty
Probability, Discrete Probability, Normal ProbabiltyFaisal Hussain
 
Appendix 2 Probability And Statistics
Appendix 2  Probability And StatisticsAppendix 2  Probability And Statistics
Appendix 2 Probability And StatisticsSarah Morrow
 
Point estimation.pptx
Point estimation.pptxPoint estimation.pptx
Point estimation.pptxDrNidhiSinha
 

Similar to 5.3-5.4 Random Variables & Means (20)

Chapter 4 part3- Means and Variances of Random Variables
Chapter 4 part3- Means and Variances of Random VariablesChapter 4 part3- Means and Variances of Random Variables
Chapter 4 part3- Means and Variances of Random Variables
 
Probability distribution
Probability distributionProbability distribution
Probability distribution
 
Econometrics 2.pptx
Econometrics 2.pptxEconometrics 2.pptx
Econometrics 2.pptx
 
Probability distributionv1
Probability distributionv1Probability distributionv1
Probability distributionv1
 
Ch5
Ch5Ch5
Ch5
 
Random variables and probability distributions Random Va.docx
Random variables and probability distributions Random Va.docxRandom variables and probability distributions Random Va.docx
Random variables and probability distributions Random Va.docx
 
Hypothesis testing.pptx
Hypothesis testing.pptxHypothesis testing.pptx
Hypothesis testing.pptx
 
Statistics Homework Help
Statistics Homework HelpStatistics Homework Help
Statistics Homework Help
 
Chapter7
Chapter7Chapter7
Chapter7
 
2 Review of Statistics. 2 Review of Statistics.
2 Review of Statistics. 2 Review of Statistics.2 Review of Statistics. 2 Review of Statistics.
2 Review of Statistics. 2 Review of Statistics.
 
Probability distribution for Dummies
Probability distribution for DummiesProbability distribution for Dummies
Probability distribution for Dummies
 
Chapter1
Chapter1Chapter1
Chapter1
 
Guia de estudio para aa5
Guia de estudio  para aa5 Guia de estudio  para aa5
Guia de estudio para aa5
 
Probability, Discrete Probability, Normal Probabilty
Probability, Discrete Probability, Normal ProbabiltyProbability, Discrete Probability, Normal Probabilty
Probability, Discrete Probability, Normal Probabilty
 
Prob distros
Prob distrosProb distros
Prob distros
 
Discrete and Continuous Random Variables
Discrete and Continuous Random VariablesDiscrete and Continuous Random Variables
Discrete and Continuous Random Variables
 
Appendix 2 Probability And Statistics
Appendix 2  Probability And StatisticsAppendix 2  Probability And Statistics
Appendix 2 Probability And Statistics
 
Point estimation.pptx
Point estimation.pptxPoint estimation.pptx
Point estimation.pptx
 
Binomial probability distributions
Binomial probability distributions  Binomial probability distributions
Binomial probability distributions
 
Talk 2
Talk 2Talk 2
Talk 2
 

Recently uploaded

The dark energy paradox leads to a new structure of spacetime.pptx
The dark energy paradox leads to a new structure of spacetime.pptxThe dark energy paradox leads to a new structure of spacetime.pptx
The dark energy paradox leads to a new structure of spacetime.pptxEran Akiva Sinbar
 
BREEDING FOR RESISTANCE TO BIOTIC STRESS.pptx
BREEDING FOR RESISTANCE TO BIOTIC STRESS.pptxBREEDING FOR RESISTANCE TO BIOTIC STRESS.pptx
BREEDING FOR RESISTANCE TO BIOTIC STRESS.pptxPABOLU TEJASREE
 
zoogeography of pakistan.pptx fauna of Pakistan
zoogeography of pakistan.pptx fauna of Pakistanzoogeography of pakistan.pptx fauna of Pakistan
zoogeography of pakistan.pptx fauna of Pakistanzohaibmir069
 
Environmental Biotechnology Topic:- Microbial Biosensor
Environmental Biotechnology Topic:- Microbial BiosensorEnvironmental Biotechnology Topic:- Microbial Biosensor
Environmental Biotechnology Topic:- Microbial Biosensorsonawaneprad
 
Call Girls in Munirka Delhi 💯Call Us 🔝9953322196🔝 💯Escort.
Call Girls in Munirka Delhi 💯Call Us 🔝9953322196🔝 💯Escort.Call Girls in Munirka Delhi 💯Call Us 🔝9953322196🔝 💯Escort.
Call Girls in Munirka Delhi 💯Call Us 🔝9953322196🔝 💯Escort.aasikanpl
 
Recombinant DNA technology( Transgenic plant and animal)
Recombinant DNA technology( Transgenic plant and animal)Recombinant DNA technology( Transgenic plant and animal)
Recombinant DNA technology( Transgenic plant and animal)DHURKADEVIBASKAR
 
Call Girls in Mayapuri Delhi 💯Call Us 🔝9953322196🔝 💯Escort.
Call Girls in Mayapuri Delhi 💯Call Us 🔝9953322196🔝 💯Escort.Call Girls in Mayapuri Delhi 💯Call Us 🔝9953322196🔝 💯Escort.
Call Girls in Mayapuri Delhi 💯Call Us 🔝9953322196🔝 💯Escort.aasikanpl
 
‏‏VIRUS - 123455555555555555555555555555555555555555
‏‏VIRUS -  123455555555555555555555555555555555555555‏‏VIRUS -  123455555555555555555555555555555555555555
‏‏VIRUS - 123455555555555555555555555555555555555555kikilily0909
 
Pests of soyabean_Binomics_IdentificationDr.UPR.pdf
Pests of soyabean_Binomics_IdentificationDr.UPR.pdfPests of soyabean_Binomics_IdentificationDr.UPR.pdf
Pests of soyabean_Binomics_IdentificationDr.UPR.pdfPirithiRaju
 
THE ROLE OF PHARMACOGNOSY IN TRADITIONAL AND MODERN SYSTEM OF MEDICINE.pptx
THE ROLE OF PHARMACOGNOSY IN TRADITIONAL AND MODERN SYSTEM OF MEDICINE.pptxTHE ROLE OF PHARMACOGNOSY IN TRADITIONAL AND MODERN SYSTEM OF MEDICINE.pptx
THE ROLE OF PHARMACOGNOSY IN TRADITIONAL AND MODERN SYSTEM OF MEDICINE.pptxNandakishor Bhaurao Deshmukh
 
Bentham & Hooker's Classification. along with the merits and demerits of the ...
Bentham & Hooker's Classification. along with the merits and demerits of the ...Bentham & Hooker's Classification. along with the merits and demerits of the ...
Bentham & Hooker's Classification. along with the merits and demerits of the ...Nistarini College, Purulia (W.B) India
 
Call Girls in Munirka Delhi 💯Call Us 🔝8264348440🔝
Call Girls in Munirka Delhi 💯Call Us 🔝8264348440🔝Call Girls in Munirka Delhi 💯Call Us 🔝8264348440🔝
Call Girls in Munirka Delhi 💯Call Us 🔝8264348440🔝soniya singh
 
Best Call Girls In Sector 29 Gurgaon❤️8860477959 EscorTs Service In 24/7 Delh...
Best Call Girls In Sector 29 Gurgaon❤️8860477959 EscorTs Service In 24/7 Delh...Best Call Girls In Sector 29 Gurgaon❤️8860477959 EscorTs Service In 24/7 Delh...
Best Call Girls In Sector 29 Gurgaon❤️8860477959 EscorTs Service In 24/7 Delh...lizamodels9
 
Twin's paradox experiment is a meassurement of the extra dimensions.pptx
Twin's paradox experiment is a meassurement of the extra dimensions.pptxTwin's paradox experiment is a meassurement of the extra dimensions.pptx
Twin's paradox experiment is a meassurement of the extra dimensions.pptxEran Akiva Sinbar
 
SOLUBLE PATTERN RECOGNITION RECEPTORS.pptx
SOLUBLE PATTERN RECOGNITION RECEPTORS.pptxSOLUBLE PATTERN RECOGNITION RECEPTORS.pptx
SOLUBLE PATTERN RECOGNITION RECEPTORS.pptxkessiyaTpeter
 
Is RISC-V ready for HPC workload? Maybe?
Is RISC-V ready for HPC workload? Maybe?Is RISC-V ready for HPC workload? Maybe?
Is RISC-V ready for HPC workload? Maybe?Patrick Diehl
 
Harmful and Useful Microorganisms Presentation
Harmful and Useful Microorganisms PresentationHarmful and Useful Microorganisms Presentation
Harmful and Useful Microorganisms Presentationtahreemzahra82
 
Grafana in space: Monitoring Japan's SLIM moon lander in real time
Grafana in space: Monitoring Japan's SLIM moon lander  in real timeGrafana in space: Monitoring Japan's SLIM moon lander  in real time
Grafana in space: Monitoring Japan's SLIM moon lander in real timeSatoshi NAKAHIRA
 
Neurodevelopmental disorders according to the dsm 5 tr
Neurodevelopmental disorders according to the dsm 5 trNeurodevelopmental disorders according to the dsm 5 tr
Neurodevelopmental disorders according to the dsm 5 trssuser06f238
 

Recently uploaded (20)

The dark energy paradox leads to a new structure of spacetime.pptx
The dark energy paradox leads to a new structure of spacetime.pptxThe dark energy paradox leads to a new structure of spacetime.pptx
The dark energy paradox leads to a new structure of spacetime.pptx
 
BREEDING FOR RESISTANCE TO BIOTIC STRESS.pptx
BREEDING FOR RESISTANCE TO BIOTIC STRESS.pptxBREEDING FOR RESISTANCE TO BIOTIC STRESS.pptx
BREEDING FOR RESISTANCE TO BIOTIC STRESS.pptx
 
zoogeography of pakistan.pptx fauna of Pakistan
zoogeography of pakistan.pptx fauna of Pakistanzoogeography of pakistan.pptx fauna of Pakistan
zoogeography of pakistan.pptx fauna of Pakistan
 
Environmental Biotechnology Topic:- Microbial Biosensor
Environmental Biotechnology Topic:- Microbial BiosensorEnvironmental Biotechnology Topic:- Microbial Biosensor
Environmental Biotechnology Topic:- Microbial Biosensor
 
Call Girls in Munirka Delhi 💯Call Us 🔝9953322196🔝 💯Escort.
Call Girls in Munirka Delhi 💯Call Us 🔝9953322196🔝 💯Escort.Call Girls in Munirka Delhi 💯Call Us 🔝9953322196🔝 💯Escort.
Call Girls in Munirka Delhi 💯Call Us 🔝9953322196🔝 💯Escort.
 
Recombinant DNA technology( Transgenic plant and animal)
Recombinant DNA technology( Transgenic plant and animal)Recombinant DNA technology( Transgenic plant and animal)
Recombinant DNA technology( Transgenic plant and animal)
 
Call Girls in Mayapuri Delhi 💯Call Us 🔝9953322196🔝 💯Escort.
Call Girls in Mayapuri Delhi 💯Call Us 🔝9953322196🔝 💯Escort.Call Girls in Mayapuri Delhi 💯Call Us 🔝9953322196🔝 💯Escort.
Call Girls in Mayapuri Delhi 💯Call Us 🔝9953322196🔝 💯Escort.
 
‏‏VIRUS - 123455555555555555555555555555555555555555
‏‏VIRUS -  123455555555555555555555555555555555555555‏‏VIRUS -  123455555555555555555555555555555555555555
‏‏VIRUS - 123455555555555555555555555555555555555555
 
Pests of soyabean_Binomics_IdentificationDr.UPR.pdf
Pests of soyabean_Binomics_IdentificationDr.UPR.pdfPests of soyabean_Binomics_IdentificationDr.UPR.pdf
Pests of soyabean_Binomics_IdentificationDr.UPR.pdf
 
THE ROLE OF PHARMACOGNOSY IN TRADITIONAL AND MODERN SYSTEM OF MEDICINE.pptx
THE ROLE OF PHARMACOGNOSY IN TRADITIONAL AND MODERN SYSTEM OF MEDICINE.pptxTHE ROLE OF PHARMACOGNOSY IN TRADITIONAL AND MODERN SYSTEM OF MEDICINE.pptx
THE ROLE OF PHARMACOGNOSY IN TRADITIONAL AND MODERN SYSTEM OF MEDICINE.pptx
 
Bentham & Hooker's Classification. along with the merits and demerits of the ...
Bentham & Hooker's Classification. along with the merits and demerits of the ...Bentham & Hooker's Classification. along with the merits and demerits of the ...
Bentham & Hooker's Classification. along with the merits and demerits of the ...
 
Call Girls in Munirka Delhi 💯Call Us 🔝8264348440🔝
Call Girls in Munirka Delhi 💯Call Us 🔝8264348440🔝Call Girls in Munirka Delhi 💯Call Us 🔝8264348440🔝
Call Girls in Munirka Delhi 💯Call Us 🔝8264348440🔝
 
Best Call Girls In Sector 29 Gurgaon❤️8860477959 EscorTs Service In 24/7 Delh...
Best Call Girls In Sector 29 Gurgaon❤️8860477959 EscorTs Service In 24/7 Delh...Best Call Girls In Sector 29 Gurgaon❤️8860477959 EscorTs Service In 24/7 Delh...
Best Call Girls In Sector 29 Gurgaon❤️8860477959 EscorTs Service In 24/7 Delh...
 
Twin's paradox experiment is a meassurement of the extra dimensions.pptx
Twin's paradox experiment is a meassurement of the extra dimensions.pptxTwin's paradox experiment is a meassurement of the extra dimensions.pptx
Twin's paradox experiment is a meassurement of the extra dimensions.pptx
 
SOLUBLE PATTERN RECOGNITION RECEPTORS.pptx
SOLUBLE PATTERN RECOGNITION RECEPTORS.pptxSOLUBLE PATTERN RECOGNITION RECEPTORS.pptx
SOLUBLE PATTERN RECOGNITION RECEPTORS.pptx
 
Is RISC-V ready for HPC workload? Maybe?
Is RISC-V ready for HPC workload? Maybe?Is RISC-V ready for HPC workload? Maybe?
Is RISC-V ready for HPC workload? Maybe?
 
Volatile Oils Pharmacognosy And Phytochemistry -I
Volatile Oils Pharmacognosy And Phytochemistry -IVolatile Oils Pharmacognosy And Phytochemistry -I
Volatile Oils Pharmacognosy And Phytochemistry -I
 
Harmful and Useful Microorganisms Presentation
Harmful and Useful Microorganisms PresentationHarmful and Useful Microorganisms Presentation
Harmful and Useful Microorganisms Presentation
 
Grafana in space: Monitoring Japan's SLIM moon lander in real time
Grafana in space: Monitoring Japan's SLIM moon lander  in real timeGrafana in space: Monitoring Japan's SLIM moon lander  in real time
Grafana in space: Monitoring Japan's SLIM moon lander in real time
 
Neurodevelopmental disorders according to the dsm 5 tr
Neurodevelopmental disorders according to the dsm 5 trNeurodevelopmental disorders according to the dsm 5 tr
Neurodevelopmental disorders according to the dsm 5 tr
 

5.3-5.4 Random Variables & Means

  • 1. 5.3 Random Variables  Random Variable  Discrete Random Variables  Continuous Random Variables  Normal Distributions as Probability Distributions 1
  • 2. 2 Random Variables A random variable is a variable whose values are numerical outcomes of a random experiment. That is, we consider all the outcomes in a sample space S and then associate a number with each outcome A random variable takes numerical values that describe the outcomes of some chance process. The probability distribution of a random variable gives its possible values and their probabilities. The probability histogram is a graph showing this probability distribution… Example: Consider tossing a fair coin 3 times. Define X = the number of heads obtained in 3 tosses X = 0: TTT X = 1: HTT THT TTH X = 2: HHT HTH THH X = 3: HHH X Values 0 1 2 3 Probability 1/8 3/8 3/8 1/8
  • 3. • The figure below shows how to get the probability distribution of X – use a tree diagram! Each outcome has prob=1/16 (HINT: use the “and” rule to show this), and then use the “or” rule to show that P(X=1) = P(TTTH or TTHT or THTT or HTTT) etc…)
  • 4. 4 Discrete Random Variable There are two main types of random variables: discrete and continuous. If we can find a way to list all possible outcomes for a random variable and assign probabilities to each one, we have a discrete random variable. A discrete random variable X takes on a fixed set of possible values with gaps between. The probability distribution of a discrete random variable X lists the values xi and their probabilities pi: Values of X: x1 x2 x3 … P(X) : p1 p2 p3 … The probabilities pi must satisfy two requirements: 1. Every probability pi is a number between 0 and 1. 2. The sum of the probabilities is 1. To find the probability of any event regarding X, add the probabilities pi of the particular values xi that make up the event.
  • 5. 5 Continuous Random Variable Discrete random variables commonly arise from situations that involve counting something. Situations that involve measuring something often result in a continuous random variable. A continuous random variable Y takes on its values in an interval of numbers. The probability distribution of Y is described by a density curve. The probability of any event regarding Y is the area under the density curve and above the values of Y that make up the event.
  • 6. 6 Continuous Probability Models Suppose the random expt. is “choose a number at random between 0 and 1”. We cannot assign probabilities to each individual value because there is an infinite interval of possible values, so we model this with a density curve (that is flat) that gives equal weight to all the numbers between 0 and 1. This continuous probability model assigns probabilities as areas under the flat, uniform density curve. The area under the curve and above any range of values is the probability of an outcome in that range. The total area under the curve equals 1. Example: Find the probability of getting a random number that is less than or equal to 0.5 OR greater than 0.8. P(X ≤ 0.5 or X > 0.8) = P(X ≤ 0.5) + P(X > 0.8) = 0.5 + 0.2 = 0.7 Uniform distribution
  • 7. 7 Normal Probability Models There are many situations where the density curve used to assign probabilities to intervals of outcomes is Normal. Normal distributions can be thought of as probability models: Probabilities can be assigned to intervals of outcomes using the Standard Normal probabilities in Table A. We standardize normal data by calculating z-scores so that any Normal curve N(m,s) can be transformed into the standard Normal curve N(0,1). z s m) (   x z
  • 8. 8 Normal Probability Models Women’s heights are Normally distributed with mean 64.5 and standard deviation 2.5 in. What is the probability, if we pick one woman at random, that her height will be between 68 and 70 inches P(68 < X < 70)? Because the woman is selected at random, X is a random variable. As before, we calculate the z- scores for 68 and 70. For x = 68", For x = 70",  z  (x m) s 4 . 1 5 . 2 ) 5 . 64 68 (    z  z  (7064.5) 2.5  2.2
  • 9. 5.4 Means and Variances of Random Variables  The Mean of a Random Variable  The Law of Large Numbers  The Variance of a Random Variable  HW problems for sections 5.3 and 5.4 9
  • 10. The mean of any discrete random variable is an average of the possible outcomes, with each outcome weighted by its probability. This reflects the fact that all outcomes may not be equally likely. The mean is also called the expected value. Mean of a Discrete Random Variable Suppose that X is a discrete random variable whose probability distribution is Value: x1 x2 x3 … Probability: p1 p2 p3 … To find the mean (expected value) of X, multiply each possible value by its probability, then add all the products – so it’s a weighted sum of the r.v.’s values, the weights being the probabilities.        i i x p x p x p x p x X E μ ... ) ( 3 3 2 2 1 1 The Mean (Expected Value) of a Random Variable 10
  • 11. • We’ve already discussed the mean of a density curve as being the “balance point” of the curve… For a discrete r.v., we’ll compute the mean (or expected value) as a weighted average of the values of X, the weights being the corresponding probabilities and in either case (discrete or continuous), the interpretation of the mean is as the long-run average value of X (in a large number of repetitions of the experiment giving rise to X). • Example: The mean # of Hs in 4 tosses of a fair coin is computed as: (1/16)*0 + (4/16)*1 + (6/16)*2 + (4/16)*3 + (1/16)*4 = (32/16) = 2. • What is your mean “winnings” when you play the “Pick 3” lottery? What does it mean?
  • 12. 12 The Law of Large Numbers Draw independent observations at random from any population with finite mean µ. Decide how accurately you would like to estimate µ. The law of large numbers says that as you increase the number of observations, the sample mean of the observed values gets closer and closer to the mean µ of the population. Law of Large Numbers: Essentially states that if you sample from a population with mean = m, then the sample mean (x- bar) will approximate m for large enough sample sizes. Or that m can be thought of as the expected value (long-run average value) of many independent observations on the variable.
  • 13. Since we use the mean as the measure of center for a discrete random variable, we’ll use the standard deviation as our measure of spread. The definition of the variance of a random variable is similar to the definition of the variance for a set of quantitative data. Variance of a Discrete Random Variable Suppose that X is a discrete random variable whose probability distribution is: Value: x1 x2 x3 … Probability: p1 p2 p3 … and that µX is the mean of X. The variance of X is: Var(X)  sX 2  (x1 mX )2 p1  (x2 mX )2 p2  (x3 mX )2 p3  ...  (xi mX )2 pi  To get the standard deviation of a random variable, take the square root of the variance. Variance of a Random Variable 13
  • 14. HW: Read sections 5.3 and 5.4 (up through p. 273, Law of Large Numbers)… Don’t worry much about the computation of the variance of a discrete random variable… Work on Exercises # 5.43, 5.48-5.55