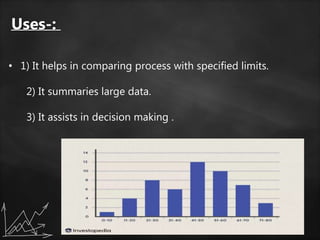
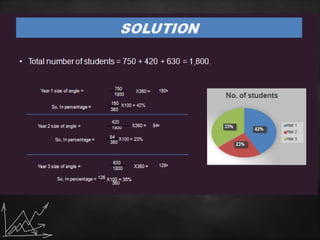
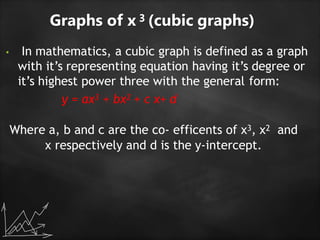
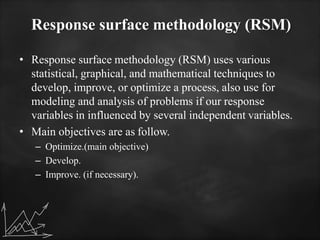
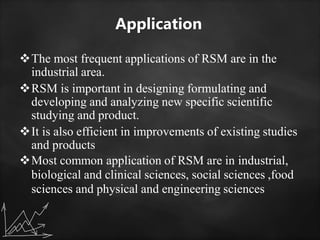
BIOSTATISITCS & RESEARCH
METHODOLOGY
Presented by-:
• 1) Yogesh Pawar
• 2) Prashant Jatkar
• 3) Gaurav Deshpande
• 4) Prashant Ingawale
• 5) Krishna Jamdar-Gujarathi
Graphs
• 1)Histogram
• 2)Pie Chart
• 3)Cubic Graph
• 4)Response surface plot
• 5)Counter Plot graph
Histogram
• What is Histogram?
Histogram is the graphical representation that is
helpful to organize and display the data in more user-friendly
format. Histogram displays shape and spread of continues
sample data.
Histogram was first introduced by "Karl Pearson"
Uses-:
• 1) It helps in comparing process with specified limits.
2) It summaries large data.
3) It assists in decision making .
Pie Chart
• What is Pie chart?
 A pie chart (also called as pie graph or circle
graph) makes use of sectors in circle. The angle
of sector is proportional to the frequency of
data.
Pie chart is a good way of displaying data when
you want to show how something is shared or
divided
Formula to determine angle of sector :-
Angle of sector = Frequency of data/Total frequency × 360°
EXAMPLE
• In a school, there are 750 students in Year1, 420
students in Year 2 and 630 students in Year 3.
Draw a circle graph to represent the numbers of
students in these groups.
SOLUTION
Graphs of x 3 (cubic graphs)
• In mathematics, a cubic graph is defined as a graph
with it’s representing equation having it’s degree or
it’s highest power three with the general form:
y = ax3 + bx2 + c x+ d
Where a, b and c are the co- efficents of x3, x2 and
x respectively and d is the y-intercept.
This is a simple Graph of x3 where it’s coefficient is 1 and no other
terms are present, including the y-intercept ‘d’. Therefore, this
line passes through the origin.
Effect of the
co-efficient of X3
Response surface methodology (RSM)
• Response surface methodology (RSM) uses various
statistical, graphical, and mathematical techniques to
develop, improve, or optimize a process, also use for
modeling and analysis of problems if our response
variables in influenced by several independent variables.
• Main objectives are as follow.
– Optimize.(main objective)
– Develop.
– Improve. (if necessary).
Application
The most frequent applications of RSM are in the
industrial area.
RSM is important in designing formulating and
developing and analyzing new specific scientific
studying and product.
It is also efficient in improvements of existing studies
and products
Most common application of RSM are in industrial,
biological and clinical sciences, social sciences ,food
sciences and physical and engineering sciences
Counter Plot
• Are 2-D (X1 & X2) graphs in which some
variables are held at one desired level & specific
response noted.
• Both axes are in experimental units.
• Sometimes both the contour & RSM plots are
drawn
• together for better optimum values.
Reference
• https://en.wikipedia.org/wiki/Histogram
• https://en.wikipedia.org/wiki/Pie_chart
• https://www.slideshare.net/
Thank You
!!!!

Graphs (Biostatistics)

  • 1.
  • 2.
    Presented by-: • 1)Yogesh Pawar • 2) Prashant Jatkar • 3) Gaurav Deshpande • 4) Prashant Ingawale • 5) Krishna Jamdar-Gujarathi
  • 3.
    Graphs • 1)Histogram • 2)PieChart • 3)Cubic Graph • 4)Response surface plot • 5)Counter Plot graph
  • 4.
    Histogram • What isHistogram? Histogram is the graphical representation that is helpful to organize and display the data in more user-friendly format. Histogram displays shape and spread of continues sample data. Histogram was first introduced by "Karl Pearson"
  • 5.
    Uses-: • 1) Ithelps in comparing process with specified limits. 2) It summaries large data. 3) It assists in decision making .
  • 6.
    Pie Chart • Whatis Pie chart?  A pie chart (also called as pie graph or circle graph) makes use of sectors in circle. The angle of sector is proportional to the frequency of data. Pie chart is a good way of displaying data when you want to show how something is shared or divided Formula to determine angle of sector :- Angle of sector = Frequency of data/Total frequency × 360°
  • 7.
    EXAMPLE • In aschool, there are 750 students in Year1, 420 students in Year 2 and 630 students in Year 3. Draw a circle graph to represent the numbers of students in these groups.
  • 8.
  • 9.
    Graphs of x3 (cubic graphs) • In mathematics, a cubic graph is defined as a graph with it’s representing equation having it’s degree or it’s highest power three with the general form: y = ax3 + bx2 + c x+ d Where a, b and c are the co- efficents of x3, x2 and x respectively and d is the y-intercept.
  • 10.
    This is asimple Graph of x3 where it’s coefficient is 1 and no other terms are present, including the y-intercept ‘d’. Therefore, this line passes through the origin. Effect of the co-efficient of X3
  • 11.
    Response surface methodology(RSM) • Response surface methodology (RSM) uses various statistical, graphical, and mathematical techniques to develop, improve, or optimize a process, also use for modeling and analysis of problems if our response variables in influenced by several independent variables. • Main objectives are as follow. – Optimize.(main objective) – Develop. – Improve. (if necessary).
  • 12.
    Application The most frequentapplications of RSM are in the industrial area. RSM is important in designing formulating and developing and analyzing new specific scientific studying and product. It is also efficient in improvements of existing studies and products Most common application of RSM are in industrial, biological and clinical sciences, social sciences ,food sciences and physical and engineering sciences
  • 13.
    Counter Plot • Are2-D (X1 & X2) graphs in which some variables are held at one desired level & specific response noted. • Both axes are in experimental units. • Sometimes both the contour & RSM plots are drawn • together for better optimum values.
  • 15.
  • 16.