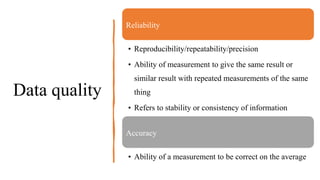
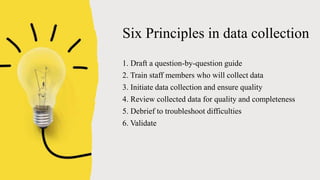
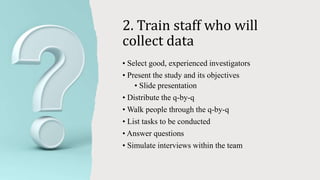
Principles of
data collection
(Types, sources,
and methods of
data collection)
Dr Chirag R. Sonkusare
Department of Community Medicine
GGMC, Mumbai-08
Data quality
Reliability
• Reproducibility/repeatability/precision
• Ability of measurement to give the same result or
similar result with repeated measurements of the same
thing
• Refers to stability or consistency of information
Accuracy
• Ability of a measurement to be correct on the average
Reliability and Accuracy
Six Principles in data collection
1. Draft a question-by-question guide
2. Train staff members who will collect data
3. Initiate data collection and ensure quality
4. Review collected data for quality and completeness
5. Debrief to troubleshoot difficulties
6. Validate
1. Draft a question-by-question
guide
• Short document to be understood as a guide for field
workers
• Consider each question, number by number
• Provide guidance as to how the data should be collected
• Used as a road map for good data collection
• Drafted initially
• Revised as issues arise and are addressed
Example of Q by Q guide
• Question 6 (Housing):
• Observe the house and note if made of mud or
bricks
• Question 12 (Household income) :
• Identify all the persons with financial income in
the household
• Estimate each source of income
• Sum up to generate household income
2. Train staff who will
collect data
• Select good, experienced investigators
• Present the study and its objectives
• Slide presentation
• Distribute the q-by-q
• Walk people through the q-by-q
• List tasks to be conducted
• Answer questions
• Simulate interviews within the team
3. Initiate data
collection and
ensure quality
• Do pilot on-site interviews under supervision
• Note issues that may come up, and
resolve them as a group
• Continue until the procedure is clear to
everyone
• Plan data collection process with a supervisor
and investigators
• Ensure study forms are verified by the
supervisor every day for any errors
• Be available to answer questions
• Do onsite visits
• Do not press for quick completion
4. Review
collected data
for quality and
completeness
• Each team checks the data collection
instruments before the respondent leaves
• The supervisor checks the instruments
before leaving the location
• All take responsibility for the instrument:
• Names and signatures
• Principal Investigator checks instruments
as they come
Checks to conduct
• Completeness
• Did the field worker fill all
items?
• Readability
• Is the writing readable?
• Consistency
• Do the answer make sense?
• Is there internal consistency?
5. Debrief to trouble
shoot difficulties
• Regular meetings
• Evening or morning
• Facilitate a discussion about
• Issues identified
• Clarification needed
• Make a note of decisions on the q-
by-q if needed
6.Validate
• Select a number of study participants at random
• Conduct a second interview
• Compare results
• Debrief discrepancies with:
• Individual worker if a particular investigator
makes the errors
• Whole team if the issue is relevant for all
Types of data
Data
• Data means a set of related numbers or raw material for statistics.
• Data are the starting point in epidemiology/biostatics studies/ investigations.
Collect data Analyse data
Convert raw
data into
information
Interpret the
information for
decision
making
Biostatistics- Statistics related to living or human beings
Vital statistics- Data on vital events like births, deaths, marriages,
migrations, etc.
Health Statistics- Data related to health service system/organisations
and institutions.
Classification or types of data.
Qualitative Data
Qualitative binary data
Qualitative nominal data
Qualitative ordinal data
Quantitative Data
Discrete Data
Continuous Data
Qualitative Data
• These data have no magnitude or size.
• These are not measurable on a scale.
• These are classified only by counting the Units that have the
same attribute
• Example- Sex, colour and race.
• Qualitative data/variables are measured on a nominal or an
ordinal scale.
Qualitative Data
Qualitative binary data
• The variable can only take 2 values, such as
male or female, yes or no, cured or died,
vaccinated or non-vaccinated, exposed or
non-exposed, healthy or seek.
This data can be
presented by a Pie
diagram or a simple table
by frequency distribution.
Qualitative Data
Qualitative nominal data
• The variable can take more than 2 variables or any value.
• The information fits into one of the categories.
• The categories cannot be ranked.
• Example- Nationality or states to which one belongs, Spoken language, blood
groups.
• Disease classification- psychosis, neurosis, manic and depressive, etc.
These data can be
presented by tabular
frequency distribution or
using a horizontal bar
chart.
Qualitative Data
Qualitative ordinal data
• The variable can take a number of values that can be ranked
through some gradient.
Example-
• Birth order- first, second, third.
• Severity of illness- Mild, moderate, Severe
• Nutritional status can be graded as normal, moderately underweight or severely
underweight.
• Social status of the person / Patient can be graded as- upper, middle and lower class.
This data can be
presented by a
frequency distribution
table or Vertical bar
diagram.
Quantitative Data
• These data have size or
magnitudes.
• We can measure these data
on an interval or ratio scale.
Quantitative Data
Discrete Data
• Values are distinct and separated.
• Normally, values have no decimal and are in whole numbers.
Examples-
• Number of sexual partners, parity
• Number of people who died of measles
• Number of households in a community
• Number of beds in hospital and white cell counts.
• These data can be
presented by frequency
distribution table or by
histogram.
• Date of onset of disease
in epidemics can be
displayed by a
histogram or epidemic
curve and long trend By
line diagram.
Quantitative Data
• Continuous Data
• These data can assume a continuous,
uninterrupted, infinite number of possible
values in any interval.
• Values may have decimals,
• Example- weight, height, haemoglobin level,
temperature.
Sources & Methods of
data collection
Sources
• Depending on the need for data, for the health system, various sources
are used
• 2 types of sources
Regular or routine
systems
Ad hoc systems
(Surveys/studies)
Sources
• Data may be obtained from the
primary or secondary services.
• Primary data are those which are
collected fresh and for the first time
and thus happen to be original in
character and known as Primary
data.
• The secondary data have been
collected by someone else and have
already been passed through the
statistical process known as
secondary data.
Sources for
Collection of
Data
1. Census
2. Registration of Vital
Events
3. Sample Registration
System (SRS)
4. Notification of Diseases
5. Hospital Records
6. Disease Registers
7. Record Linkage
8. Epidemiological
Surveillance
9. Other Health Service
Records
10. Environmental Health Data
11. Health Manpower Statistics
12. Population Surveys
13. Other routine statistics
related to health
14. Non-quantifiable
information
Methods
of data
collection
Take home message
• Understand the concepts of
data quality
• Good training off-site and
onsite is essential
• Supportive supervision and
teamwork are key to good-
quality data collection
Thank
You
Reference:-
• Icmr – nie.gov.in-Basic course in bio-medical research
• Sunderlal textbook of community medicine 7th edition

Principles of data collection.pptx

  • 1.
    Principles of data collection (Types,sources, and methods of data collection) Dr Chirag R. Sonkusare Department of Community Medicine GGMC, Mumbai-08
  • 2.
    Data quality Reliability • Reproducibility/repeatability/precision •Ability of measurement to give the same result or similar result with repeated measurements of the same thing • Refers to stability or consistency of information Accuracy • Ability of a measurement to be correct on the average
  • 3.
  • 4.
    Six Principles indata collection 1. Draft a question-by-question guide 2. Train staff members who will collect data 3. Initiate data collection and ensure quality 4. Review collected data for quality and completeness 5. Debrief to troubleshoot difficulties 6. Validate
  • 5.
    1. Draft aquestion-by-question guide • Short document to be understood as a guide for field workers • Consider each question, number by number • Provide guidance as to how the data should be collected • Used as a road map for good data collection • Drafted initially • Revised as issues arise and are addressed
  • 6.
    Example of Qby Q guide • Question 6 (Housing): • Observe the house and note if made of mud or bricks • Question 12 (Household income) : • Identify all the persons with financial income in the household • Estimate each source of income • Sum up to generate household income
  • 7.
    2. Train staffwho will collect data • Select good, experienced investigators • Present the study and its objectives • Slide presentation • Distribute the q-by-q • Walk people through the q-by-q • List tasks to be conducted • Answer questions • Simulate interviews within the team
  • 8.
    3. Initiate data collectionand ensure quality • Do pilot on-site interviews under supervision • Note issues that may come up, and resolve them as a group • Continue until the procedure is clear to everyone • Plan data collection process with a supervisor and investigators • Ensure study forms are verified by the supervisor every day for any errors • Be available to answer questions • Do onsite visits • Do not press for quick completion
  • 9.
    4. Review collected data forquality and completeness • Each team checks the data collection instruments before the respondent leaves • The supervisor checks the instruments before leaving the location • All take responsibility for the instrument: • Names and signatures • Principal Investigator checks instruments as they come
  • 10.
    Checks to conduct •Completeness • Did the field worker fill all items? • Readability • Is the writing readable? • Consistency • Do the answer make sense? • Is there internal consistency?
  • 11.
    5. Debrief totrouble shoot difficulties • Regular meetings • Evening or morning • Facilitate a discussion about • Issues identified • Clarification needed • Make a note of decisions on the q- by-q if needed
  • 12.
    6.Validate • Select anumber of study participants at random • Conduct a second interview • Compare results • Debrief discrepancies with: • Individual worker if a particular investigator makes the errors • Whole team if the issue is relevant for all
  • 13.
  • 14.
    Data • Data meansa set of related numbers or raw material for statistics. • Data are the starting point in epidemiology/biostatics studies/ investigations. Collect data Analyse data Convert raw data into information Interpret the information for decision making
  • 15.
    Biostatistics- Statistics relatedto living or human beings Vital statistics- Data on vital events like births, deaths, marriages, migrations, etc. Health Statistics- Data related to health service system/organisations and institutions.
  • 16.
    Classification or typesof data. Qualitative Data Qualitative binary data Qualitative nominal data Qualitative ordinal data Quantitative Data Discrete Data Continuous Data
  • 17.
    Qualitative Data • Thesedata have no magnitude or size. • These are not measurable on a scale. • These are classified only by counting the Units that have the same attribute • Example- Sex, colour and race. • Qualitative data/variables are measured on a nominal or an ordinal scale.
  • 18.
    Qualitative Data Qualitative binarydata • The variable can only take 2 values, such as male or female, yes or no, cured or died, vaccinated or non-vaccinated, exposed or non-exposed, healthy or seek. This data can be presented by a Pie diagram or a simple table by frequency distribution.
  • 19.
    Qualitative Data Qualitative nominaldata • The variable can take more than 2 variables or any value. • The information fits into one of the categories. • The categories cannot be ranked. • Example- Nationality or states to which one belongs, Spoken language, blood groups. • Disease classification- psychosis, neurosis, manic and depressive, etc. These data can be presented by tabular frequency distribution or using a horizontal bar chart.
  • 20.
    Qualitative Data Qualitative ordinaldata • The variable can take a number of values that can be ranked through some gradient. Example- • Birth order- first, second, third. • Severity of illness- Mild, moderate, Severe • Nutritional status can be graded as normal, moderately underweight or severely underweight. • Social status of the person / Patient can be graded as- upper, middle and lower class. This data can be presented by a frequency distribution table or Vertical bar diagram.
  • 21.
    Quantitative Data • Thesedata have size or magnitudes. • We can measure these data on an interval or ratio scale.
  • 22.
    Quantitative Data Discrete Data •Values are distinct and separated. • Normally, values have no decimal and are in whole numbers. Examples- • Number of sexual partners, parity • Number of people who died of measles • Number of households in a community • Number of beds in hospital and white cell counts. • These data can be presented by frequency distribution table or by histogram. • Date of onset of disease in epidemics can be displayed by a histogram or epidemic curve and long trend By line diagram.
  • 23.
    Quantitative Data • ContinuousData • These data can assume a continuous, uninterrupted, infinite number of possible values in any interval. • Values may have decimals, • Example- weight, height, haemoglobin level, temperature.
  • 24.
    Sources & Methodsof data collection
  • 25.
    Sources • Depending onthe need for data, for the health system, various sources are used • 2 types of sources Regular or routine systems Ad hoc systems (Surveys/studies)
  • 26.
    Sources • Data maybe obtained from the primary or secondary services. • Primary data are those which are collected fresh and for the first time and thus happen to be original in character and known as Primary data. • The secondary data have been collected by someone else and have already been passed through the statistical process known as secondary data.
  • 27.
    Sources for Collection of Data 1.Census 2. Registration of Vital Events 3. Sample Registration System (SRS) 4. Notification of Diseases 5. Hospital Records 6. Disease Registers 7. Record Linkage 8. Epidemiological Surveillance 9. Other Health Service Records 10. Environmental Health Data 11. Health Manpower Statistics 12. Population Surveys 13. Other routine statistics related to health 14. Non-quantifiable information
  • 28.
  • 37.
    Take home message •Understand the concepts of data quality • Good training off-site and onsite is essential • Supportive supervision and teamwork are key to good- quality data collection
  • 38.
  • 39.
    Reference:- • Icmr –nie.gov.in-Basic course in bio-medical research • Sunderlal textbook of community medicine 7th edition