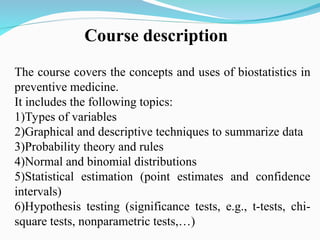
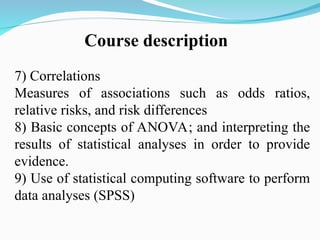
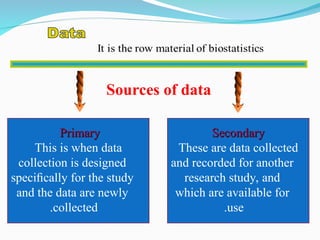
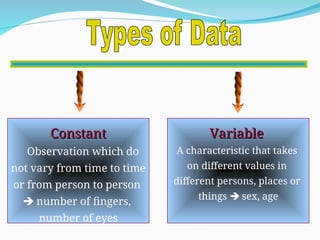
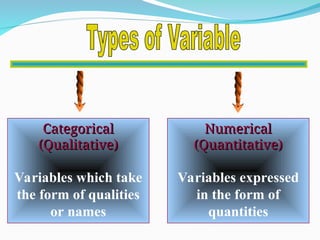
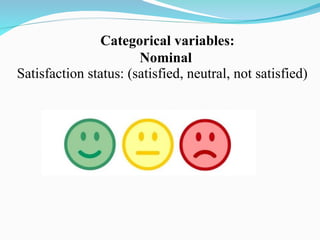
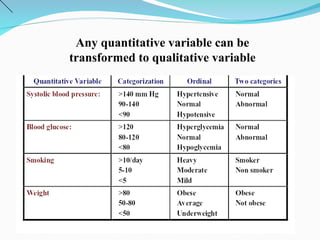
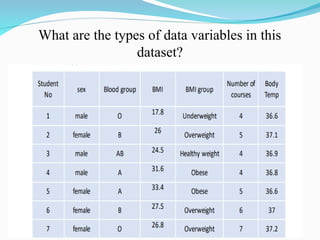
Introduction to
biostatistics course
and data sources
Dr Hamadi Widad 2024
Course description
The course covers the concepts and uses of biostatistics in
preventive medicine.
It includes the following topics:
1)Types of variables
2)Graphical and descriptive techniques to summarize data
3)Probability theory and rules
4)Normal and binomial distributions
5)Statistical estimation (point estimates and confidence
intervals)
6)Hypothesis testing (significance tests, e.g., t-tests, chi-
square tests, nonparametric tests,…)
Course description
7) Correlations
Measures of associations such as odds ratios,
relative risks, and risk differences
8) Basic concepts of ANOVA; and interpreting the
results of statistical analyses in order to provide
evidence.
9) Use of statistical computing software to perform
data analyses (SPSS)
Introduction
it is a field of study concerned with :
The collection, organization, summarization and
analysis of data.
analysis of data.
When the data being analyzed are
derived from the biological sciences
and medicine
Why Preventive Medicine
physicians should learn
biostatistics
biostatistics
?
?
• Interpreting vital statistics (births, deaths..)
how they are measured? What they mean?
How they are used?
• Understand and evaluate published scientific
research papers to decide whether they can
believe the results presented in the literature.
• Understanding epidemiologic problems 
prevalence of disease, variation by season or
area and influence of risk factors  to make
diagnoses and develop management plans.
• Interpreting information about drugs &
equipment  companies use graphs, charts &
results of studies comparing their products with
others in the market.
• Using diagnostic procedures  to know how
the test is sensitive to diagnose a disease
(Sensitivity) and also no disease (Specificity) in
a well person.
• Research project planning  Design 
Execution (Data collection)  Data processing
 Data analysis Presentation 
Interpretation  Publication
Primary
Primary
This is when data
collection is designed
specifically for the study
and the data are newly
collected
.
Secondary
Secondary
These are data collected
and recorded for another
research study, and
which are available for
use
.
Sources of data
Records Experiment
Survey
A- From records (Regular/Routine collection
system):
 Hospital records.
Annual vital records  births, deaths.
Annual & monthly reports of WHO,
Ministry of Health.
Journals.
Electronic data bases
B- Survey methods
1)Comprehensive survey (census) collection of
data about every individual in the society
 It takes great deal of money, effort and time
 Census is carried out every 10 years
(2) Sample survey
It is collection of data about a portion of
the population named the sample.
It requires less time, money and effort
than the comprehensive survey.
 A sample should be representative
C-Experiments  carried out in the
laboratory or field
Constant
Constant
Observation which do
not vary from time to time
or from person to person
 number of fingers,
number of eyes
Variable
Variable
A characteristic that takes
on different values in
different persons, places or
things  sex, age
The type of variable can be critically
important in determining method of
analysis that will be used.
Categorical
Categorical
(Qualitative)
(Qualitative)
Variables which take
the form of qualities
or names
Numerical
Numerical
(Quantitative)
(Quantitative)
Variables expressed
in the form of
quantities
Categorical variables:
Nominal
Satisfaction status: (satisfied, neutral, not satisfied)
Categorical variables:
Nominal
Sex: (female, male)
Categorical variables:
Nominal
Colors: (red, green, blue, pink)
Categorical variables:
Nominal
Nationality: (all countries)
Categorical variables:
Ordinal
BMI status: (underweight, normal, overweight,
obese, extremely obese)
Categorical variables:
Ordinal
Agreement level: (strongly disagree, disagree,
undecided, agree, strongly agree)
Categorical (Qualitative)
A- Two categories (Binary = Dichotomous=0/1):
These often relate to the presence or absence of some attribute
Male/female
Disease/No disease
Married/Unmarried
Diabetic/non diabetic
Smoker/non smoker
Hypertensive/normotensive
B- More than two categories:
1= Nominal
Country of birth
Blood group A/B/AB/O
Married/Single/Divorced/Separated/Widow
2= Ordinal: qualitative variables whose categories can be put in a definite order
Non-smoker/ex-smoker/light smoker/heavy smoker
Degree of pain: minimal-moderate-severe-unbearable
Stages of breast cancer: I, II, III, IV.
Numerical (Quantitative)
A- Continuous:
Obtained by measurement
Can take integer or fractional values
Can take any value between two fixed limits (upper/lower)
Age/Weight/Height/Distance/Blood pressure/temperature
B- Discrete:
Obtained by enumeration or counting
Number of children
Number of beds
Pulse rate
Number of visits to the GP in a year
Any quantitative variable can be
transformed to qualitative variable
What are the types of data variables in this
dataset?
DATA ORGANIZATION
By definition, a statistical study collects data on a range
of individuals . Each of these subjects is called a
statistical unit. Each observation or measurement made
on each statistical unit is one of the values of the
variable studied. The first step in describing the data is
to sort the data, group it and possibly transform it in
order to visualize it in a condensed form that allows us
to understand its distribution globally.
This operation consists of organizing in a coherent way the
masses of data of a quantitative or qualitative ordinal
variable. Sorting consists of arranging statistical units in
ascending or descending order of values. When studying a
qualitative variable, the statistical units are grouped
according to the different classes of that variable.
A- Sorting data
When studying a quantitative variable on a large number of
individuals, it is necessary to group the data to present them
clearly.
-This operation results in transforming a continuous
quantitative variable into a discrete quantitative variable.
This process is called Discretization
B- Group into classes
Exemple : Discretization of continuous variable
We can choose:
scale per amplitude, by dividing the values of the series into equal
intervals. the number of subjects per class is irregular .
The variable obtained is of the discrete quantitative type.
scale per frequency, by dividing the observed series into groups of
equal numbers, the intervals are irregular
the variable obtained is of the discrete quantitative type.
Ordinal scale of ; chosen by the operator according to the relevance of
the terminals. This choice depends on what we want to show.
The variable obtained is of the qualitative ordinal type
The class amplitude is the difference between the lower and upper
limits of the class
There is no rule to impose the number of classes, but if we choose an
equal amplitude for the classes, the following rule could be proposed:
Number of classes = range/amplitude.
-The range (margin) is the difference between the largest and lowest
value in the series.
-For example, if we divide an age series of 10 years into 10 years, it
should be specified that a subject who is 10 years old or older is classified
in the 10-19 age group. A subject of 9 years and 11 months will be
classified in the 0-9 age group.
Tabular
Tabular Graphical
Graphical Mathematical
Mathematical
A- Tables:
1- Raw table of data:
This is the basic work table.
-All data is included, unit by unit and variable by variable.
-Individuals are in a row, variables in columns.
- Such a table generally includes two kinds of variables: the
variables used to identify each statistical unit and the variables
measured for the study
 This type of table is rarely presentable as is, unless the
data is scarce as this table below:
They are used to present a set of data in aggregate form.
-Table: is a matrix with at least two entries, one horizontal (rows) and one
vertical (columns).
- One of the inputs is the classes of the variable.
-The second is made up of the numbers of subjects in each class of the variable
studied or their frequencys.
- A correct table must present the total number of effectives in the series
studied and the total frequencys ( percentage) to show that the classes are
exclusive.
2- Frequency table
44
Elements of a Table
Ideal table should have
Number
Title
Column headings
Foot-notes
Number - Table number for identification in a report
Title, place - On top of table
(What, where and when)
Column - Variable name, No. , Percentages (%), etc.,
Heading
Foot-note(s) - to describe some column/row
headings, special cells, source, etc.,
Distribution of a sample of adults by blood
group in Taif 2020
Percent for group A = (5/20)*100
3-Contingency table
value of the row variable; R is the number of rows.
 One column for each value of the column variable; C is the
number of columns.
One row for each value of the row variable; R is the number of
rows.
R x C contingency table.
each value of the column variable; C is the number of columns.
One row for each value of the row variable; R is the number of rows.
R x C contingency table.
Length of stay by gender for a sample
of inpatients in king Faisal hospital 2020
Contingency tables
Thank you
Thank you

1- introduction,data sources and types1 (1).ppt

  • 1.
    Introduction to biostatistics course anddata sources Dr Hamadi Widad 2024
  • 2.
    Course description The coursecovers the concepts and uses of biostatistics in preventive medicine. It includes the following topics: 1)Types of variables 2)Graphical and descriptive techniques to summarize data 3)Probability theory and rules 4)Normal and binomial distributions 5)Statistical estimation (point estimates and confidence intervals) 6)Hypothesis testing (significance tests, e.g., t-tests, chi- square tests, nonparametric tests,…)
  • 3.
    Course description 7) Correlations Measuresof associations such as odds ratios, relative risks, and risk differences 8) Basic concepts of ANOVA; and interpreting the results of statistical analyses in order to provide evidence. 9) Use of statistical computing software to perform data analyses (SPSS)
  • 4.
  • 6.
    it is afield of study concerned with : it is a field of study concerned with : The collection, organization, summarization and The collection, organization, summarization and analysis of data. analysis of data.
  • 7.
    When the databeing analyzed are derived from the biological sciences and medicine
  • 8.
    Why Preventive Medicine WhyPreventive Medicine physicians should learn physicians should learn biostatistics biostatistics ? ?
  • 9.
    • Interpreting vitalstatistics (births, deaths..) how they are measured? What they mean? How they are used? • Understand and evaluate published scientific research papers to decide whether they can believe the results presented in the literature.
  • 10.
    • Understanding epidemiologicproblems  prevalence of disease, variation by season or area and influence of risk factors  to make diagnoses and develop management plans. • Interpreting information about drugs & equipment  companies use graphs, charts & results of studies comparing their products with others in the market.
  • 11.
    • Using diagnosticprocedures  to know how the test is sensitive to diagnose a disease (Sensitivity) and also no disease (Specificity) in a well person. • Research project planning  Design  Execution (Data collection)  Data processing  Data analysis Presentation  Interpretation  Publication
  • 12.
    Primary Primary This is whendata collection is designed specifically for the study and the data are newly collected . Secondary Secondary These are data collected and recorded for another research study, and which are available for use . Sources of data
  • 13.
  • 14.
    A- From records(Regular/Routine collection system):  Hospital records. Annual vital records  births, deaths. Annual & monthly reports of WHO, Ministry of Health. Journals. Electronic data bases
  • 15.
    B- Survey methods 1)Comprehensivesurvey (census) collection of data about every individual in the society  It takes great deal of money, effort and time  Census is carried out every 10 years
  • 16.
    (2) Sample survey Itis collection of data about a portion of the population named the sample. It requires less time, money and effort than the comprehensive survey.  A sample should be representative
  • 17.
    C-Experiments  carriedout in the laboratory or field
  • 18.
    Constant Constant Observation which do notvary from time to time or from person to person  number of fingers, number of eyes Variable Variable A characteristic that takes on different values in different persons, places or things  sex, age
  • 19.
    The type ofvariable can be critically The type of variable can be critically important in determining method of important in determining method of analysis that will be used. analysis that will be used.
  • 20.
    Categorical Categorical (Qualitative) (Qualitative) Variables which take theform of qualities or names Numerical Numerical (Quantitative) (Quantitative) Variables expressed in the form of quantities
  • 21.
    Categorical variables: Nominal Satisfaction status:(satisfied, neutral, not satisfied)
  • 22.
  • 23.
  • 24.
  • 25.
    Categorical variables: Ordinal BMI status:(underweight, normal, overweight, obese, extremely obese)
  • 26.
    Categorical variables: Ordinal Agreement level:(strongly disagree, disagree, undecided, agree, strongly agree)
  • 27.
    Categorical (Qualitative) A- Twocategories (Binary = Dichotomous=0/1): These often relate to the presence or absence of some attribute Male/female Disease/No disease Married/Unmarried Diabetic/non diabetic Smoker/non smoker Hypertensive/normotensive B- More than two categories: 1= Nominal Country of birth Blood group A/B/AB/O Married/Single/Divorced/Separated/Widow 2= Ordinal: qualitative variables whose categories can be put in a definite order Non-smoker/ex-smoker/light smoker/heavy smoker Degree of pain: minimal-moderate-severe-unbearable Stages of breast cancer: I, II, III, IV.
  • 28.
    Numerical (Quantitative) A- Continuous: Obtainedby measurement Can take integer or fractional values Can take any value between two fixed limits (upper/lower) Age/Weight/Height/Distance/Blood pressure/temperature B- Discrete: Obtained by enumeration or counting Number of children Number of beds Pulse rate Number of visits to the GP in a year
  • 30.
    Any quantitative variablecan be transformed to qualitative variable
  • 31.
    What are thetypes of data variables in this dataset?
  • 32.
  • 33.
    By definition, astatistical study collects data on a range of individuals . Each of these subjects is called a statistical unit. Each observation or measurement made on each statistical unit is one of the values of the variable studied. The first step in describing the data is to sort the data, group it and possibly transform it in order to visualize it in a condensed form that allows us to understand its distribution globally.
  • 34.
    This operation consistsof organizing in a coherent way the masses of data of a quantitative or qualitative ordinal variable. Sorting consists of arranging statistical units in ascending or descending order of values. When studying a qualitative variable, the statistical units are grouped according to the different classes of that variable. A- Sorting data
  • 35.
    When studying aquantitative variable on a large number of individuals, it is necessary to group the data to present them clearly. -This operation results in transforming a continuous quantitative variable into a discrete quantitative variable. This process is called Discretization B- Group into classes
  • 36.
    Exemple : Discretizationof continuous variable
  • 37.
    We can choose: scaleper amplitude, by dividing the values of the series into equal intervals. the number of subjects per class is irregular . The variable obtained is of the discrete quantitative type. scale per frequency, by dividing the observed series into groups of equal numbers, the intervals are irregular the variable obtained is of the discrete quantitative type. Ordinal scale of ; chosen by the operator according to the relevance of the terminals. This choice depends on what we want to show. The variable obtained is of the qualitative ordinal type
  • 39.
    The class amplitudeis the difference between the lower and upper limits of the class There is no rule to impose the number of classes, but if we choose an equal amplitude for the classes, the following rule could be proposed: Number of classes = range/amplitude. -The range (margin) is the difference between the largest and lowest value in the series. -For example, if we divide an age series of 10 years into 10 years, it should be specified that a subject who is 10 years old or older is classified in the 10-19 age group. A subject of 9 years and 11 months will be classified in the 0-9 age group.
  • 40.
  • 41.
    A- Tables: 1- Rawtable of data: This is the basic work table. -All data is included, unit by unit and variable by variable. -Individuals are in a row, variables in columns. - Such a table generally includes two kinds of variables: the variables used to identify each statistical unit and the variables measured for the study
  • 42.
     This typeof table is rarely presentable as is, unless the data is scarce as this table below:
  • 43.
    They are usedto present a set of data in aggregate form. -Table: is a matrix with at least two entries, one horizontal (rows) and one vertical (columns). - One of the inputs is the classes of the variable. -The second is made up of the numbers of subjects in each class of the variable studied or their frequencys. - A correct table must present the total number of effectives in the series studied and the total frequencys ( percentage) to show that the classes are exclusive. 2- Frequency table
  • 44.
    44 Elements of aTable Ideal table should have Number Title Column headings Foot-notes Number - Table number for identification in a report Title, place - On top of table (What, where and when) Column - Variable name, No. , Percentages (%), etc., Heading Foot-note(s) - to describe some column/row headings, special cells, source, etc.,
  • 45.
    Distribution of asample of adults by blood group in Taif 2020 Percent for group A = (5/20)*100
  • 46.
    3-Contingency table value ofthe row variable; R is the number of rows.  One column for each value of the column variable; C is the number of columns. One row for each value of the row variable; R is the number of rows. R x C contingency table. each value of the column variable; C is the number of columns. One row for each value of the row variable; R is the number of rows. R x C contingency table.
  • 47.
    Length of stayby gender for a sample of inpatients in king Faisal hospital 2020 Contingency tables
  • 50.

Editor's Notes

  • #47 Always set up your table so the Dependent Variable is the column variable and the Independent Variable is the row variable.