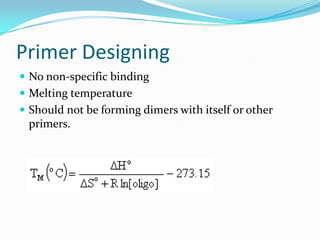
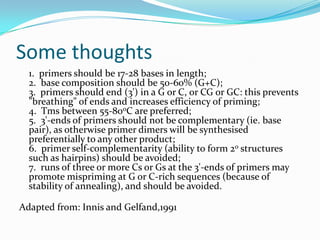
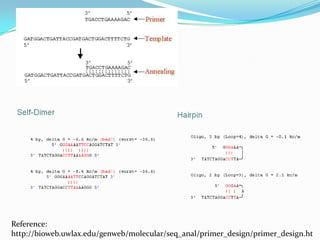
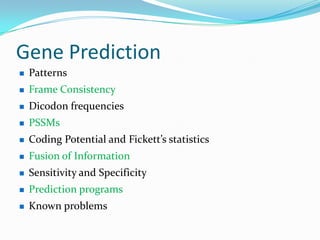
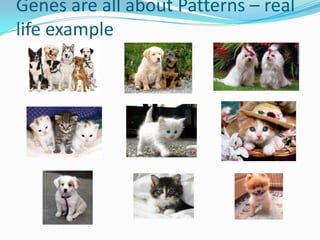
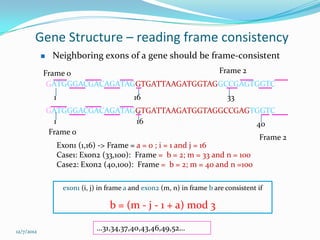
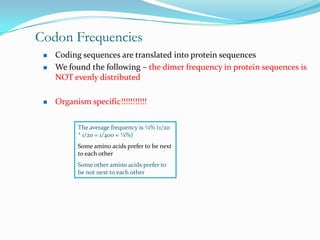
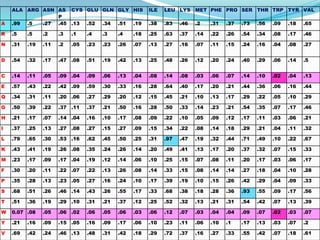
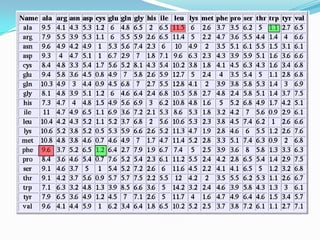
IICB Course work, 8th Dec 2012
Topics to be covered
 Primer designing
 Restriction mapping
 Gene Prediction
ATGACGCATAGCAGCATAGACGCATAGACGACGCATAGACGACATAGAGACG
AGACGCAGAATAGAGGACGAGCAATGATGATAGAAATGACGCATAGCAGCAT
AGACGCATAGACGACGCATAGACGACATAGAGACGAGACGCAGAATAGAGGA
CGAGCAATGATGATAGAAATGACGCATAGCAGCATAGACGCATAGACGACGC
ATAGACGACATAGAGACGAGACGCAGAATAGAGGACGAGCAATGATGATAGA
AATGACGCATAGCAGCATAGACGCATAGACGACGCATAGACGACATAGAGAC
GAGACGCAGAATAGAGGACGAGCAATGATGATAGAAATGACGCATAGCAGCA
TAGACGCATAGACGACGCATAGACGACATAGAGACGAGACGCAGAATAGAGG
ACGAGCAATGATGATAGAAATGACGCATAGCAGCATAGACGCATAGACGACG
CATAGACGACATAGAGACGAGACGCAGAATAGAGGACGAGCAATGATGATAG
AAATGACGCATAGCAGCATAGACGCATAGACGACGCATAGACGACATAGAGA
CGAGACGCAGAATAGAGGACGAGCAATGATGATAGAA
ATGACGCATAGCAGCATAGACGCATAGACGACGCATAGACGACATAGAGACG
AGACGCAGAATAGAGGACGAGCAATGATGATAGAAATGACGCATAGCAGCAT
AGACGCATAGACGACGCATAGACGACATAGAGACGAGACGCAGAATAGAGGA
CGAGCAATGATGATAGAAATGACGCATAGCAGCATAGACGCATAGACGACGC
ATAGACGACATAGAGACGAGACGCAGAATAGAGGACGAGCAATGATGATAGA
AATGACGCATAGCAGCATAGACGCATAGACGACGCATAGACGACATAGAGAC
GAGACGCAGAATAGAGGACGAGCAATGATGATAGAA
 Oligo Analyzer:
 http://www.idtdna.com/analyzer/Applications/OligoAnalyzer/
 http://www.idtdna.com/Analyzer/Applications/Instructions/Default.as
 px?AnalyzerDefinitions=true
Primer Designing
 No non-specific binding
 Melting temperature
 Should not be forming dimers with itself or other
 primers.
Some thoughts
  1. primers should be 17-28 bases in length;
  2. base composition should be 50-60% (G+C);
  3. primers should end (3') in a G or C, or CG or GC: this prevents
  "breathing" of ends and increases efficiency of priming;
  4. Tms between 55-80oC are preferred;
  5. 3'-ends of primers should not be complementary (ie. base
  pair), as otherwise primer dimers will be synthesised
  preferentially to any other product;
  6. primer self-complementarity (ability to form 2o structures
  such as hairpins) should be avoided;
  7. runs of three or more Cs or Gs at the 3'-ends of primers may
  promote mispriming at G or C-rich sequences (because of
  stability of annealing), and should be avoided.

Adapted from: Innis and Gelfand,1991
Reference:
http://bioweb.uwlax.edu/genweb/molecular/seq_anal/primer_design/primer_design.ht
Restriction Analysis
 Found in Bacteria and archea.
 4 types
    Type -1: cleavage remote to recognition site (methylase
     activity)
    Type-2: cleavage within a specific distance
    Type-3: Cleavage within a short distance
    Type-4: Cleaves modified DNA (methylated)


    Ref: http://insilico.ehu.es/restriction/long_seq/
    http://molbiol-tools.ca/Restriction_endonuclease.htm
Gene Prediction
   Patterns
   Frame Consistency
   Dicodon frequencies
   PSSMs
   Coding Potential and Fickett’s statistics
   Fusion of Information
   Sensitivity and Specificity
   Prediction programs
   Known problems
Genes are all about Patterns – real
life example
Gene Prediction Methods
Common sets of rules
 Homology
 Ab initio methods
   Compositional information
   Signal information
Pattern Recognition in Gene
Finding
    atgttggacagactggacgcaagacgtgtggatgaactcgttttggagctgaac
     aaggctctatacgtacttaatcaagcggggcgtttgtggagcgagt
     tacttcacaaaaagctagccaatttgggttcaatgcagtgcctgaccgacatggg
     tatgtattagtaacgtttggaagaagaaactgttgtggttggtgt
     ttatgcagacaatctacaggtgactgcaacgaattcaactctcgtggacagttttt
     tcgttgatttacaggacctctcggtaaaggactatgaagaggtg
     acaaaattcttggggatgcgcatttcttatgcgcctgaaaatgggtatgattatat
     atcgagaagtgacaacccgggaaatgataaaggataa


    atggagaggatgctggagacggtcaagacgaccatcacccctgcgcaggcaatgaag
    ctgtttactgcacccaaagaacctcaagcgaacctggcccgag
    cacttcatgtacttggtggccatctcggaggcctgcggtggtacttagtcctgaataacg
    tcgtgccgtacgcgtccgcggatctacgaacggtcctgat
    agccaaagtggacggcacgcgtgtcgactacctacagcaagctgaggaactggcgca
    tttcgcgcaatcctgggagcttgaagcgcgcacgaagaacatt


    We need to study the basic structures of genes first ….!
Gene Structure – Common sets of
rules
• Generally true: all long (> 300 bp) orfs in prokaryotic genomes
  encode genes

But this may not necessarily be true for eukaryotic genomes


• Eukaryotic introns begin with GT and end with AG(donor and
  acceptor sites)
   – CT(A/G)A(C/T) 20-50 bases upstream of acceptor site.
Gene Structure

   Each coding region (exon or whole gene) has a fixed
    translation frame
   A coding region always sits inside an ORF of same
    reading frame
   All exons of a gene are on the same strand.
   Neighboring exons of a gene could have different
    reading frames .
   Exons need to be Frame consistent!

     GATGGGACGACAGATAAGGTGATAGATGGTAGGCAGCAG
      0  3 6 9 12                   01
Gene Structure – reading frame consistency
                Neighboring exons of a gene should be frame-consistent
            Frame 0                           Frame 2
             GATGGGACGACAGATAGGTGATTAAGATGGTAGGCCGAGTGGTC
                  1                           16                              33
                GATGGGACGACAGATAGGTGATTAAGATGGTAGGCCGAGTGGTC
                 1                         16                               40
                Frame 0
                                                                             Frame 2
                   Exon1 (1,16) -> Frame = a = 0 ; i = 1 and j = 16
                   Case1: Exon2 (33,100): Frame = b = 2; m = 33 and n = 100
                   Case2: Exon2 (40,100): Frame = b = 2; m = 40 and n =100

                      exon1 (i, j) in frame a and exon2 (m, n) in frame b are consistent if

                                      b = (m - j - 1 + a) mod 3

12/7/2012
                                 …31,34,37,40,43,46,49,52…
Codon Frequencies
    Coding sequences are translated into protein sequences
    We found the following – the dimer frequency in protein sequences is
     NOT evenly distributed

    Organism specific!!!!!!!!!!!


           The average frequency is ¼% (1/20
           * 1/20 = 1/400 = ¼%)
           Some amino acids prefer to be next
           to each other
           Some other amino acids prefer to
           be not next to each other
ALA ARG ASN AS CYS GLU GLN GLY HIS                   ILE   LEU LYS MET PHE PRO SER THR TRP TYR VAL
                P
A   .99 .5  .27 .45 .13 .52 .34 .51 .19                  .38   .83   .46   .2    .31   .37   .73   .56   .09   .18   .65

R   .5    .5    .2    .3   .1    .4    .3    .4    .18   .25   .63   .37   .14   .22   .26   .54   .34   .08   .17   .46

N   .31   .19   .11   .2   .05   .23   .23   .26   .07   .13   .27   .16   .07   .11   .15   .24   .16   .04   .08   .27


D   .54   .32   .17   .47 .08    .51   .19   .42   .13   .25   .48   .26   .12   .20   .24   .40   .29   .06   .14   .5


C   .14   .11   .05   .09 .04    .09   .06   .13   .04   .08   .14   .08   .03   .06   .07   .14   .10   .02   .04   .13

E   .57   .43   .22   .42 .09    .59   .30   .33   .16   .28   .64   .40   .17   .20   .21   .44   .36   .06   .16   .44

Q   .34   .31   .11   .20 .06    .27   .29   .20   .12   .15   .45   .21   .10   .13   .17   .29   .22   .05   .10   .29

G   .50   .39   .22   .37 .11    .37   .21   .50   .16   .28   .50   .33   .14   .23   .21   .54   .35   .07   .17   .46

H   .21   .17   .07   .14 .04    .16   .10   .17   .08   .09   .22   .10   .05   .09   .12   .17   .11   .03   .06   .21

I   .37   .25   .13   .27 .08    .27   .15   .27   .09   .15   .34   .22   .08   .14   .18   .29   .21   .04   .11   .32

L   .79   .65   .30   .53 .16    .62   .45   .50   .25   .31   .97   .47   .19   .32   .44   .71   .49   .10   .22   .67

K   .43   .41   .19   .26 .08    .35   .24   .26   .14   .20   .49   .41   .13   .17   .20   .37   .32   .07   .15   .33

M   .23   .17   .09   .17 .04    .19   .12   .14   .06   .10   .25   .15   .07   .08   .11   .20   .17   .03   .06   .17

F   .30   .20   .11   .22 .07    .22   .13   .26   .08   .14   .33   .15   .08   .14   .14   .27   .18   .04   .10   .28

P   .35   .28   .13   .23 .05    .27   .16   .24   .10   .17   .39   .19   .10   .15   .26   .42   .29   .04   .09   .33

S   .68   .51   .26   .46 .14    .43   .26   .55   .17   .33   .68   .38   .18   .28   .36   .93   .55   .09   .17   .56

T   .51   .36   .19   .29 .10    .31   .21   .37   .12   .25   .52   .32   .13   .21   .31   .54   .42   .07   .13   .39

W   0.07 .08    .05   .06 .02    .06   .05   .06   .03   .06   .12   .07   .03   .04   .04   .09   .07   .02   .03   .07

Y   .21   .16   .09   .15 .05    .16   .09   .17   .06   .10   .23   .11   .06   .10   .1    .17   .13   .03   .07   .2

V   .69   .42   .24   .46 .13    .48   .31   .42   .18   .29   .72   .37   .16   .27   .33   .55   .42   .07   .18   .61
Dicodon Frequencies
    Believe it or not – the biased (uneven) dimer frequencies are the
     foundation of many gene finding programs!

    Basic idea – if a dimer has lower than average dimer frequency; this
     means that proteins prefer not to have such dimers in its sequence;


      Hence if we see a dicodon encoding this dimer, we may
      want to bet against this dicodon being in a coding
      region!
Dicodon Frequencies - Examples

    Relative frequencies of a di-codon in coding versus non-coding
         frequency of dicodon X (e.g, AAAAAA) in coding region, total number of occurrences of
          X divided by total number of dicocon occurrences
         frequency of dicodon X (e.g, AAAAAA) in noncoding region, total number of
          occurrences of X divided by total number of dicodon occurrences


     In human genome, frequency of dicodon “AAA AAA” is
     ~1% in coding region versus ~5% in non-coding region

         Question: if you see a region with many “AAA AAA”,
         would you guess it is a coding or non-coding region?
Basic idea of gene finding
    Most dicodons show bias towards either coding or non-coding
     regions; only fraction of dicodons is neutral
    Foundation for coding region identification


       Regions consisting of dicodons that mostly tend
         to be in coding regions are probably coding
           regions; otherwise non-coding regions


    Dicodon frequencies are key signal used for coding region
     detection; all gene finding programs use this information
Prediction of Translation Starts Using PSSM
   Certain nucleotides prefer to be in certain position around start
    “ATG” and other nucleotides prefer not to be there 75,100, 75 ATG
     TCTAGAAGATGGCAGTGGCGAAGA
                                                A 0,0,0,100 ,0,
        TCTAGAAAATGACAGTGGCGAAGA
                                                          T 100,0,100,0,0, 25, 0, 0 ATG
        TCTAGAAAATGGCAGTAGCGAAGA
                                                          G 0, 0, 0, 0, 75 ,0, 0, 25 ATG
        TCTACT A AATGATAGTAGCGAAGA             ATG        C 0,100,0,0, 25 ,0, 0, 0 ATG

    A
    C
    G
    T
                        -4     -3    -2   -1         +3   +4       +5         +6

                       CACC ATG GC
                       TCGA ATG TT

   The “biased” nucleotide distribution is information! It is a basis for
    translation start prediction

   Question: which one is more probable to be a translation start?
Prediction of Translation Starts
               Mathematical model: Fi (X): frequency of X (A, C, G, T) in
                position i
               Score a string by log (Fi (X)/0.25)

                CACC ATG GC                             TCGA ATG TT
            log (58/25) + log (49/25) + log (40/25) +    log (6/25) + log (6/25) + log (15/25) + log
            log (50/25) + log (43/25) + log (39/25) =    (15/25) + log (13/25) + log (14/25) =

            0.37 + 0.29 + 0.20 + 0.30 + 0.24 + 0.29      -(0.62 + 0.62 + 0.22 + 0.22 + 0.28 + 0.25)

            = 1.69                                       = -2.54


                                  The model captures our intuition!

        A
        C
        G
        T
12/7/2012
Evaluation of Gene prediction
                         TP     FP           TN            FN       TP
Real


Predicted


       •    Sensitivity = No. of Correct exons/No. of actual exons(Measurement of False
            negative) -> How many are discarded by mistake
                                Sn = TP/TP+FN
       •    Specificity = No. of Correct exons/No. of predicted exons(Measurement of
            False positive) -> How many are included by mistake
                                 Sp=TP/TP+FP

       •    CC = Metric for combining both

                     (TP*TN) – (FN*FP)/sqrt( (TP+FN)*(TN+FP)*(TP+FP)*(TN+FN) )


   12/7/2012
Challenges of Gene finder


•   Alternative splicing
•   Nested/overlapping genes
•   Extremely long/short genes
•   Extremely long introns
•   Non-canonical introns
•   Split start codons
•   UTR introns
•   Non-ATG triplet as the start codon
•   Polycistronic genes
•   Repeats/transposons
Known Gene Finders

    GeneScan
    GeneMarkHMM
    Fgenesh
    GlimmerHMM
    GeneZilla
    SNAP
    PHAT
    AUGUSTUS
    Genie


 Ref: http://bioinf.uni-greifswald.de/augustus/submission

Primer designgeneprediction

  • 1.
    IICB Course work,8th Dec 2012
  • 2.
    Topics to becovered  Primer designing  Restriction mapping  Gene Prediction
  • 3.
    ATGACGCATAGCAGCATAGACGCATAGACGACGCATAGACGACATAGAGACG AGACGCAGAATAGAGGACGAGCAATGATGATAGAAATGACGCATAGCAGCAT AGACGCATAGACGACGCATAGACGACATAGAGACGAGACGCAGAATAGAGGA CGAGCAATGATGATAGAAATGACGCATAGCAGCATAGACGCATAGACGACGC ATAGACGACATAGAGACGAGACGCAGAATAGAGGACGAGCAATGATGATAGA AATGACGCATAGCAGCATAGACGCATAGACGACGCATAGACGACATAGAGAC GAGACGCAGAATAGAGGACGAGCAATGATGATAGAAATGACGCATAGCAGCA TAGACGCATAGACGACGCATAGACGACATAGAGACGAGACGCAGAATAGAGG ACGAGCAATGATGATAGAAATGACGCATAGCAGCATAGACGCATAGACGACG CATAGACGACATAGAGACGAGACGCAGAATAGAGGACGAGCAATGATGATAG AAATGACGCATAGCAGCATAGACGCATAGACGACGCATAGACGACATAGAGA CGAGACGCAGAATAGAGGACGAGCAATGATGATAGAA ATGACGCATAGCAGCATAGACGCATAGACGACGCATAGACGACATAGAGACG AGACGCAGAATAGAGGACGAGCAATGATGATAGAAATGACGCATAGCAGCAT AGACGCATAGACGACGCATAGACGACATAGAGACGAGACGCAGAATAGAGGA CGAGCAATGATGATAGAAATGACGCATAGCAGCATAGACGCATAGACGACGC ATAGACGACATAGAGACGAGACGCAGAATAGAGGACGAGCAATGATGATAGA AATGACGCATAGCAGCATAGACGCATAGACGACGCATAGACGACATAGAGAC GAGACGCAGAATAGAGGACGAGCAATGATGATAGAA Oligo Analyzer: http://www.idtdna.com/analyzer/Applications/OligoAnalyzer/ http://www.idtdna.com/Analyzer/Applications/Instructions/Default.as px?AnalyzerDefinitions=true
  • 4.
    Primer Designing  Nonon-specific binding  Melting temperature  Should not be forming dimers with itself or other primers.
  • 5.
    Some thoughts 1. primers should be 17-28 bases in length; 2. base composition should be 50-60% (G+C); 3. primers should end (3') in a G or C, or CG or GC: this prevents "breathing" of ends and increases efficiency of priming; 4. Tms between 55-80oC are preferred; 5. 3'-ends of primers should not be complementary (ie. base pair), as otherwise primer dimers will be synthesised preferentially to any other product; 6. primer self-complementarity (ability to form 2o structures such as hairpins) should be avoided; 7. runs of three or more Cs or Gs at the 3'-ends of primers may promote mispriming at G or C-rich sequences (because of stability of annealing), and should be avoided. Adapted from: Innis and Gelfand,1991
  • 6.
  • 7.
    Restriction Analysis  Foundin Bacteria and archea.  4 types  Type -1: cleavage remote to recognition site (methylase activity)  Type-2: cleavage within a specific distance  Type-3: Cleavage within a short distance  Type-4: Cleaves modified DNA (methylated) Ref: http://insilico.ehu.es/restriction/long_seq/ http://molbiol-tools.ca/Restriction_endonuclease.htm
  • 8.
    Gene Prediction  Patterns  Frame Consistency  Dicodon frequencies  PSSMs  Coding Potential and Fickett’s statistics  Fusion of Information  Sensitivity and Specificity  Prediction programs  Known problems
  • 9.
    Genes are allabout Patterns – real life example
  • 10.
    Gene Prediction Methods Commonsets of rules  Homology  Ab initio methods  Compositional information  Signal information
  • 11.
    Pattern Recognition inGene Finding  atgttggacagactggacgcaagacgtgtggatgaactcgttttggagctgaac aaggctctatacgtacttaatcaagcggggcgtttgtggagcgagt tacttcacaaaaagctagccaatttgggttcaatgcagtgcctgaccgacatggg tatgtattagtaacgtttggaagaagaaactgttgtggttggtgt ttatgcagacaatctacaggtgactgcaacgaattcaactctcgtggacagttttt tcgttgatttacaggacctctcggtaaaggactatgaagaggtg acaaaattcttggggatgcgcatttcttatgcgcctgaaaatgggtatgattatat atcgagaagtgacaacccgggaaatgataaaggataa atggagaggatgctggagacggtcaagacgaccatcacccctgcgcaggcaatgaag ctgtttactgcacccaaagaacctcaagcgaacctggcccgag cacttcatgtacttggtggccatctcggaggcctgcggtggtacttagtcctgaataacg tcgtgccgtacgcgtccgcggatctacgaacggtcctgat agccaaagtggacggcacgcgtgtcgactacctacagcaagctgaggaactggcgca tttcgcgcaatcctgggagcttgaagcgcgcacgaagaacatt We need to study the basic structures of genes first ….!
  • 12.
    Gene Structure –Common sets of rules • Generally true: all long (> 300 bp) orfs in prokaryotic genomes encode genes But this may not necessarily be true for eukaryotic genomes • Eukaryotic introns begin with GT and end with AG(donor and acceptor sites) – CT(A/G)A(C/T) 20-50 bases upstream of acceptor site.
  • 13.
    Gene Structure  Each coding region (exon or whole gene) has a fixed translation frame  A coding region always sits inside an ORF of same reading frame  All exons of a gene are on the same strand.  Neighboring exons of a gene could have different reading frames .  Exons need to be Frame consistent! GATGGGACGACAGATAAGGTGATAGATGGTAGGCAGCAG 0 3 6 9 12 01
  • 14.
    Gene Structure –reading frame consistency  Neighboring exons of a gene should be frame-consistent Frame 0 Frame 2 GATGGGACGACAGATAGGTGATTAAGATGGTAGGCCGAGTGGTC 1 16 33 GATGGGACGACAGATAGGTGATTAAGATGGTAGGCCGAGTGGTC 1 16 40 Frame 0 Frame 2 Exon1 (1,16) -> Frame = a = 0 ; i = 1 and j = 16 Case1: Exon2 (33,100): Frame = b = 2; m = 33 and n = 100 Case2: Exon2 (40,100): Frame = b = 2; m = 40 and n =100 exon1 (i, j) in frame a and exon2 (m, n) in frame b are consistent if b = (m - j - 1 + a) mod 3 12/7/2012 …31,34,37,40,43,46,49,52…
  • 15.
    Codon Frequencies  Coding sequences are translated into protein sequences  We found the following – the dimer frequency in protein sequences is NOT evenly distributed  Organism specific!!!!!!!!!!! The average frequency is ¼% (1/20 * 1/20 = 1/400 = ¼%) Some amino acids prefer to be next to each other Some other amino acids prefer to be not next to each other
  • 16.
    ALA ARG ASNAS CYS GLU GLN GLY HIS ILE LEU LYS MET PHE PRO SER THR TRP TYR VAL P A .99 .5 .27 .45 .13 .52 .34 .51 .19 .38 .83 .46 .2 .31 .37 .73 .56 .09 .18 .65 R .5 .5 .2 .3 .1 .4 .3 .4 .18 .25 .63 .37 .14 .22 .26 .54 .34 .08 .17 .46 N .31 .19 .11 .2 .05 .23 .23 .26 .07 .13 .27 .16 .07 .11 .15 .24 .16 .04 .08 .27 D .54 .32 .17 .47 .08 .51 .19 .42 .13 .25 .48 .26 .12 .20 .24 .40 .29 .06 .14 .5 C .14 .11 .05 .09 .04 .09 .06 .13 .04 .08 .14 .08 .03 .06 .07 .14 .10 .02 .04 .13 E .57 .43 .22 .42 .09 .59 .30 .33 .16 .28 .64 .40 .17 .20 .21 .44 .36 .06 .16 .44 Q .34 .31 .11 .20 .06 .27 .29 .20 .12 .15 .45 .21 .10 .13 .17 .29 .22 .05 .10 .29 G .50 .39 .22 .37 .11 .37 .21 .50 .16 .28 .50 .33 .14 .23 .21 .54 .35 .07 .17 .46 H .21 .17 .07 .14 .04 .16 .10 .17 .08 .09 .22 .10 .05 .09 .12 .17 .11 .03 .06 .21 I .37 .25 .13 .27 .08 .27 .15 .27 .09 .15 .34 .22 .08 .14 .18 .29 .21 .04 .11 .32 L .79 .65 .30 .53 .16 .62 .45 .50 .25 .31 .97 .47 .19 .32 .44 .71 .49 .10 .22 .67 K .43 .41 .19 .26 .08 .35 .24 .26 .14 .20 .49 .41 .13 .17 .20 .37 .32 .07 .15 .33 M .23 .17 .09 .17 .04 .19 .12 .14 .06 .10 .25 .15 .07 .08 .11 .20 .17 .03 .06 .17 F .30 .20 .11 .22 .07 .22 .13 .26 .08 .14 .33 .15 .08 .14 .14 .27 .18 .04 .10 .28 P .35 .28 .13 .23 .05 .27 .16 .24 .10 .17 .39 .19 .10 .15 .26 .42 .29 .04 .09 .33 S .68 .51 .26 .46 .14 .43 .26 .55 .17 .33 .68 .38 .18 .28 .36 .93 .55 .09 .17 .56 T .51 .36 .19 .29 .10 .31 .21 .37 .12 .25 .52 .32 .13 .21 .31 .54 .42 .07 .13 .39 W 0.07 .08 .05 .06 .02 .06 .05 .06 .03 .06 .12 .07 .03 .04 .04 .09 .07 .02 .03 .07 Y .21 .16 .09 .15 .05 .16 .09 .17 .06 .10 .23 .11 .06 .10 .1 .17 .13 .03 .07 .2 V .69 .42 .24 .46 .13 .48 .31 .42 .18 .29 .72 .37 .16 .27 .33 .55 .42 .07 .18 .61
  • 18.
    Dicodon Frequencies  Believe it or not – the biased (uneven) dimer frequencies are the foundation of many gene finding programs!  Basic idea – if a dimer has lower than average dimer frequency; this means that proteins prefer not to have such dimers in its sequence; Hence if we see a dicodon encoding this dimer, we may want to bet against this dicodon being in a coding region!
  • 19.
    Dicodon Frequencies -Examples  Relative frequencies of a di-codon in coding versus non-coding  frequency of dicodon X (e.g, AAAAAA) in coding region, total number of occurrences of X divided by total number of dicocon occurrences  frequency of dicodon X (e.g, AAAAAA) in noncoding region, total number of occurrences of X divided by total number of dicodon occurrences In human genome, frequency of dicodon “AAA AAA” is ~1% in coding region versus ~5% in non-coding region Question: if you see a region with many “AAA AAA”, would you guess it is a coding or non-coding region?
  • 20.
    Basic idea ofgene finding  Most dicodons show bias towards either coding or non-coding regions; only fraction of dicodons is neutral  Foundation for coding region identification Regions consisting of dicodons that mostly tend to be in coding regions are probably coding regions; otherwise non-coding regions  Dicodon frequencies are key signal used for coding region detection; all gene finding programs use this information
  • 21.
    Prediction of TranslationStarts Using PSSM  Certain nucleotides prefer to be in certain position around start “ATG” and other nucleotides prefer not to be there 75,100, 75 ATG TCTAGAAGATGGCAGTGGCGAAGA A 0,0,0,100 ,0, TCTAGAAAATGACAGTGGCGAAGA T 100,0,100,0,0, 25, 0, 0 ATG TCTAGAAAATGGCAGTAGCGAAGA G 0, 0, 0, 0, 75 ,0, 0, 25 ATG TCTACT A AATGATAGTAGCGAAGA ATG C 0,100,0,0, 25 ,0, 0, 0 ATG A C G T -4 -3 -2 -1 +3 +4 +5 +6 CACC ATG GC TCGA ATG TT  The “biased” nucleotide distribution is information! It is a basis for translation start prediction  Question: which one is more probable to be a translation start?
  • 22.
    Prediction of TranslationStarts  Mathematical model: Fi (X): frequency of X (A, C, G, T) in position i  Score a string by log (Fi (X)/0.25) CACC ATG GC TCGA ATG TT log (58/25) + log (49/25) + log (40/25) + log (6/25) + log (6/25) + log (15/25) + log log (50/25) + log (43/25) + log (39/25) = (15/25) + log (13/25) + log (14/25) = 0.37 + 0.29 + 0.20 + 0.30 + 0.24 + 0.29 -(0.62 + 0.62 + 0.22 + 0.22 + 0.28 + 0.25) = 1.69 = -2.54 The model captures our intuition! A C G T 12/7/2012
  • 23.
    Evaluation of Geneprediction TP FP TN FN TP Real Predicted • Sensitivity = No. of Correct exons/No. of actual exons(Measurement of False negative) -> How many are discarded by mistake Sn = TP/TP+FN • Specificity = No. of Correct exons/No. of predicted exons(Measurement of False positive) -> How many are included by mistake Sp=TP/TP+FP • CC = Metric for combining both (TP*TN) – (FN*FP)/sqrt( (TP+FN)*(TN+FP)*(TP+FP)*(TN+FN) ) 12/7/2012
  • 24.
    Challenges of Genefinder • Alternative splicing • Nested/overlapping genes • Extremely long/short genes • Extremely long introns • Non-canonical introns • Split start codons • UTR introns • Non-ATG triplet as the start codon • Polycistronic genes • Repeats/transposons
  • 25.
    Known Gene Finders  GeneScan  GeneMarkHMM  Fgenesh  GlimmerHMM  GeneZilla  SNAP  PHAT  AUGUSTUS  Genie Ref: http://bioinf.uni-greifswald.de/augustus/submission