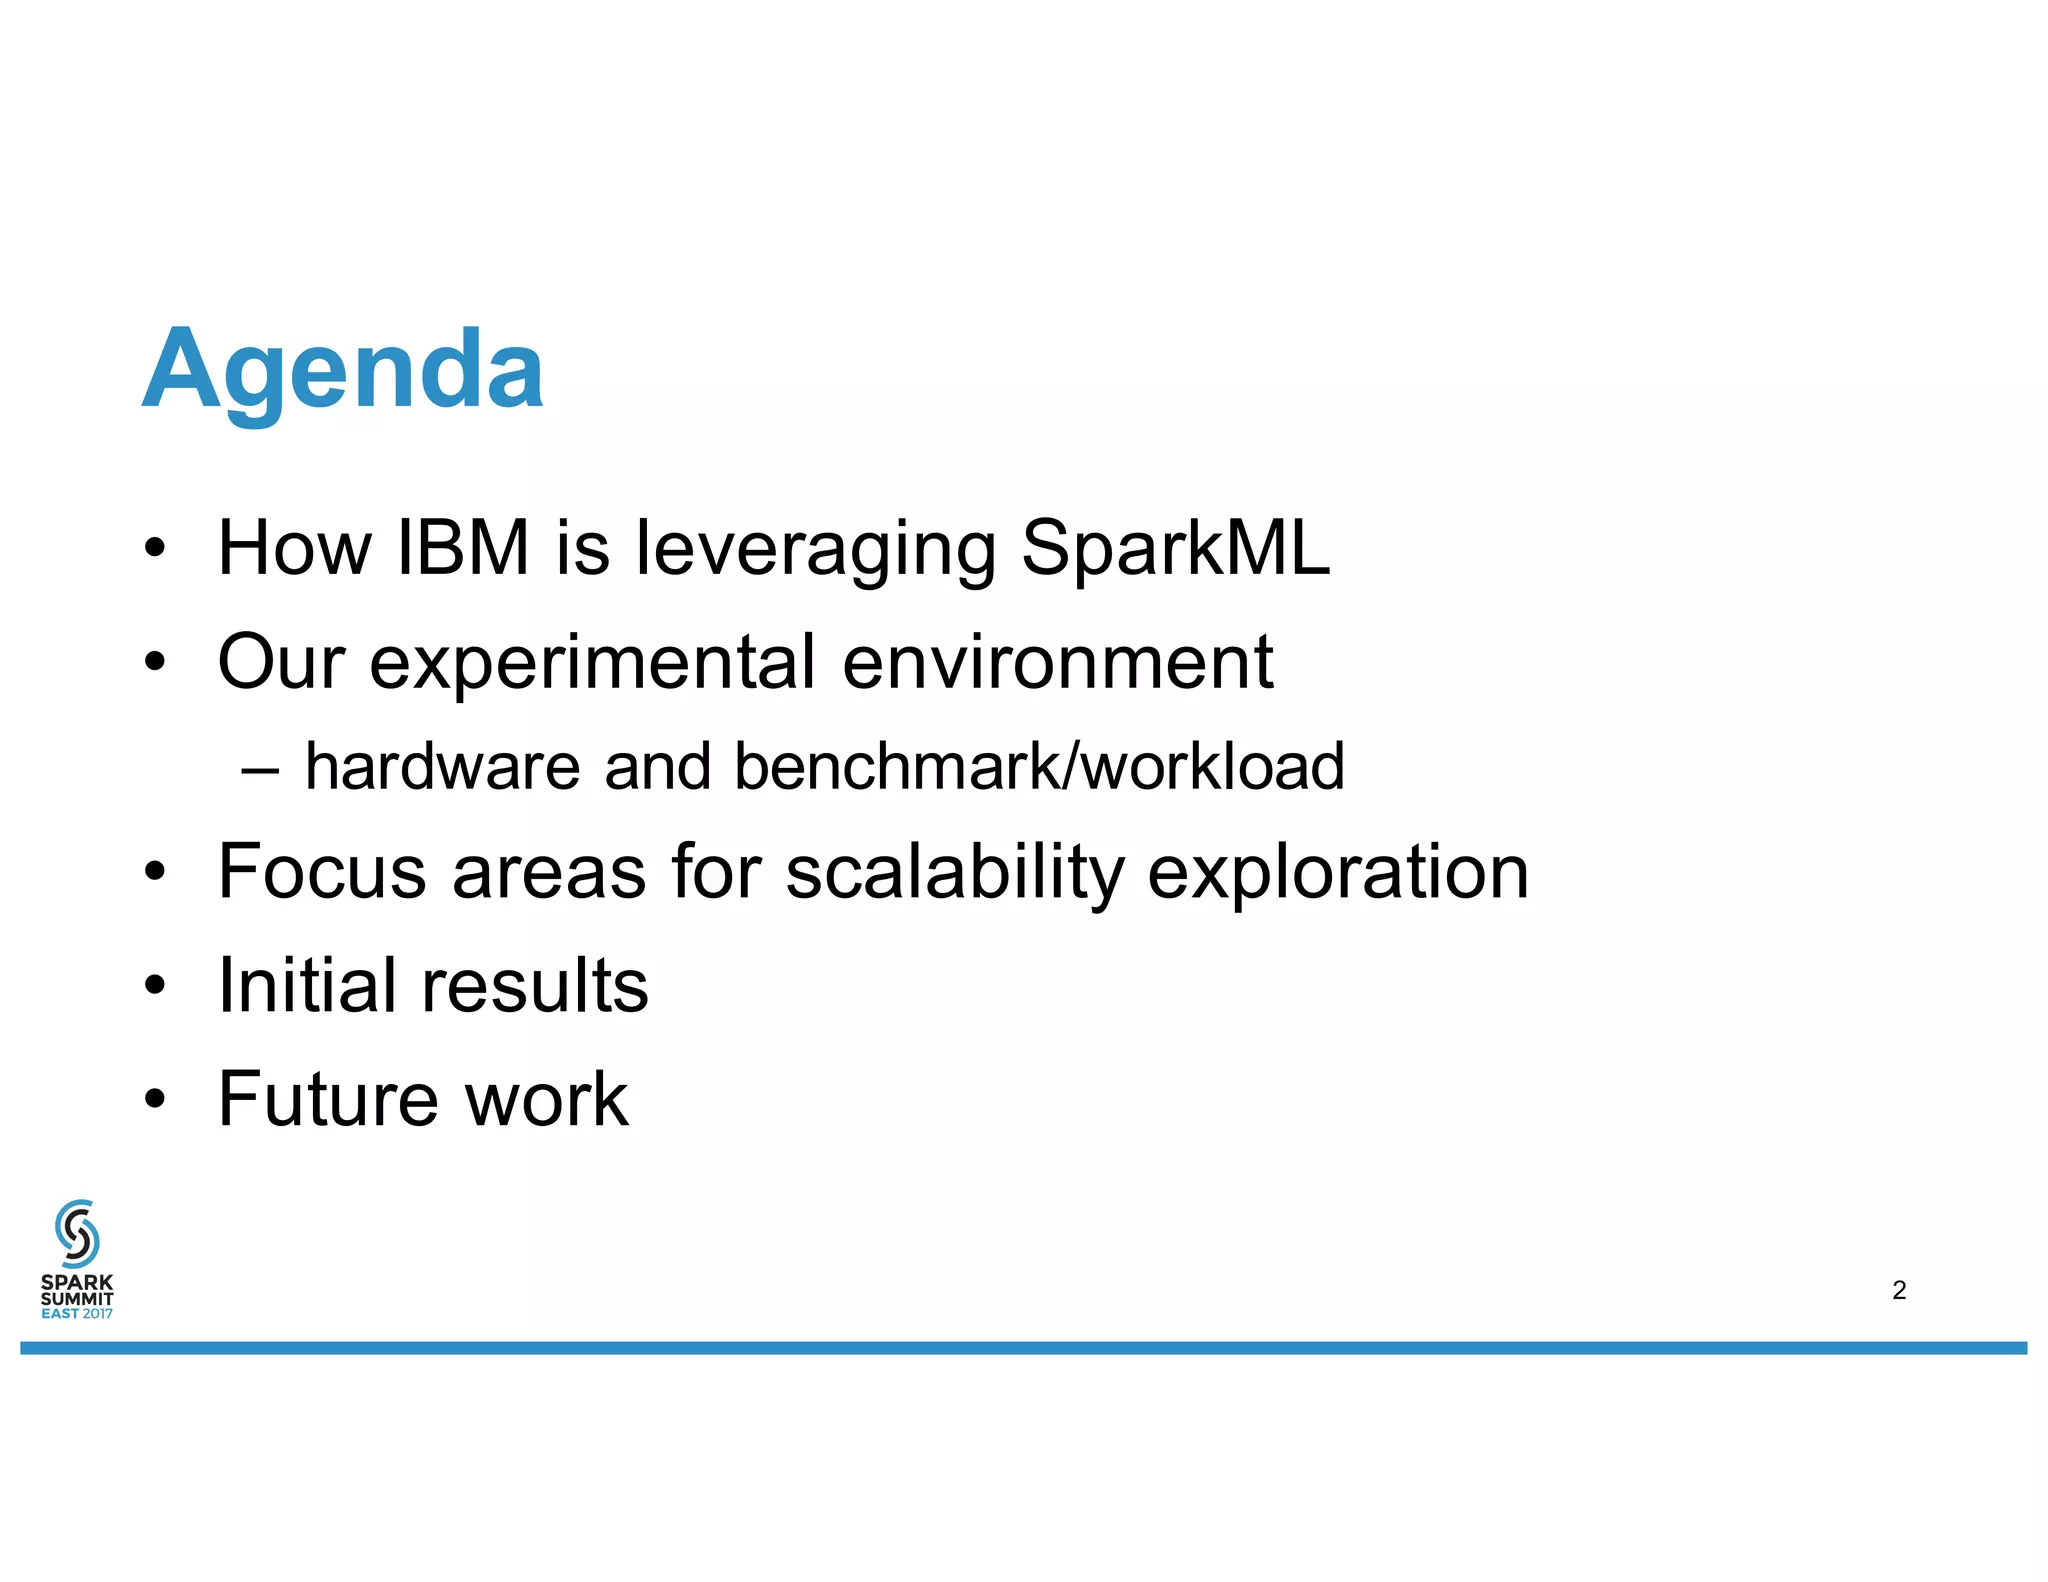
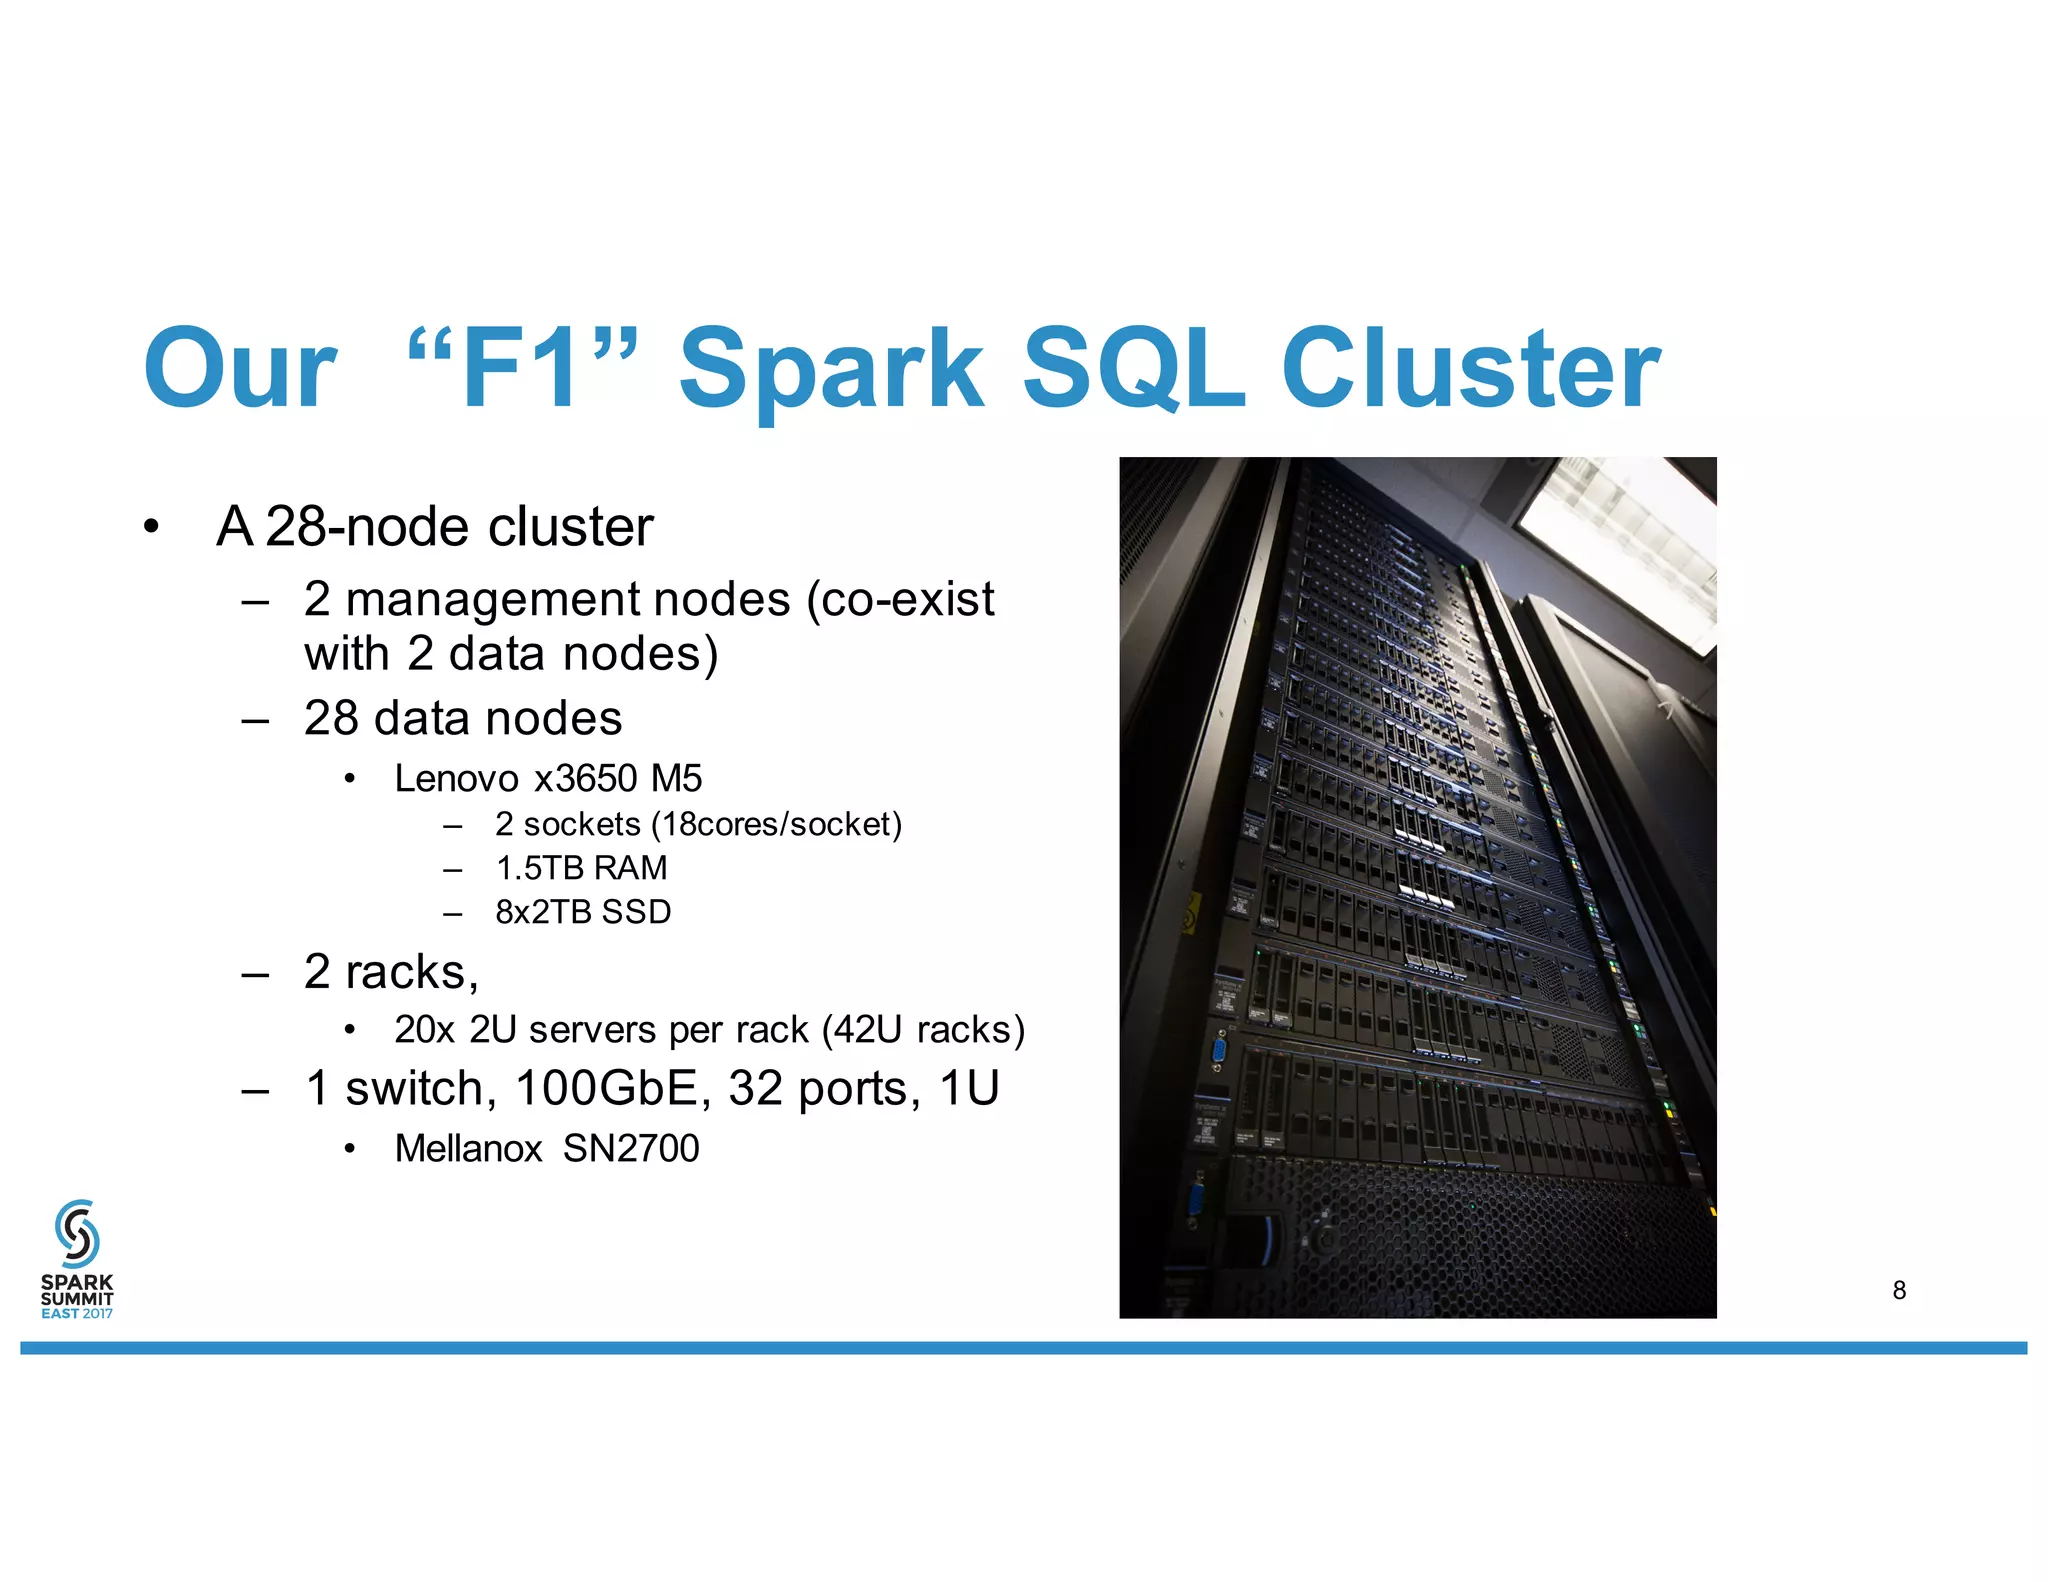
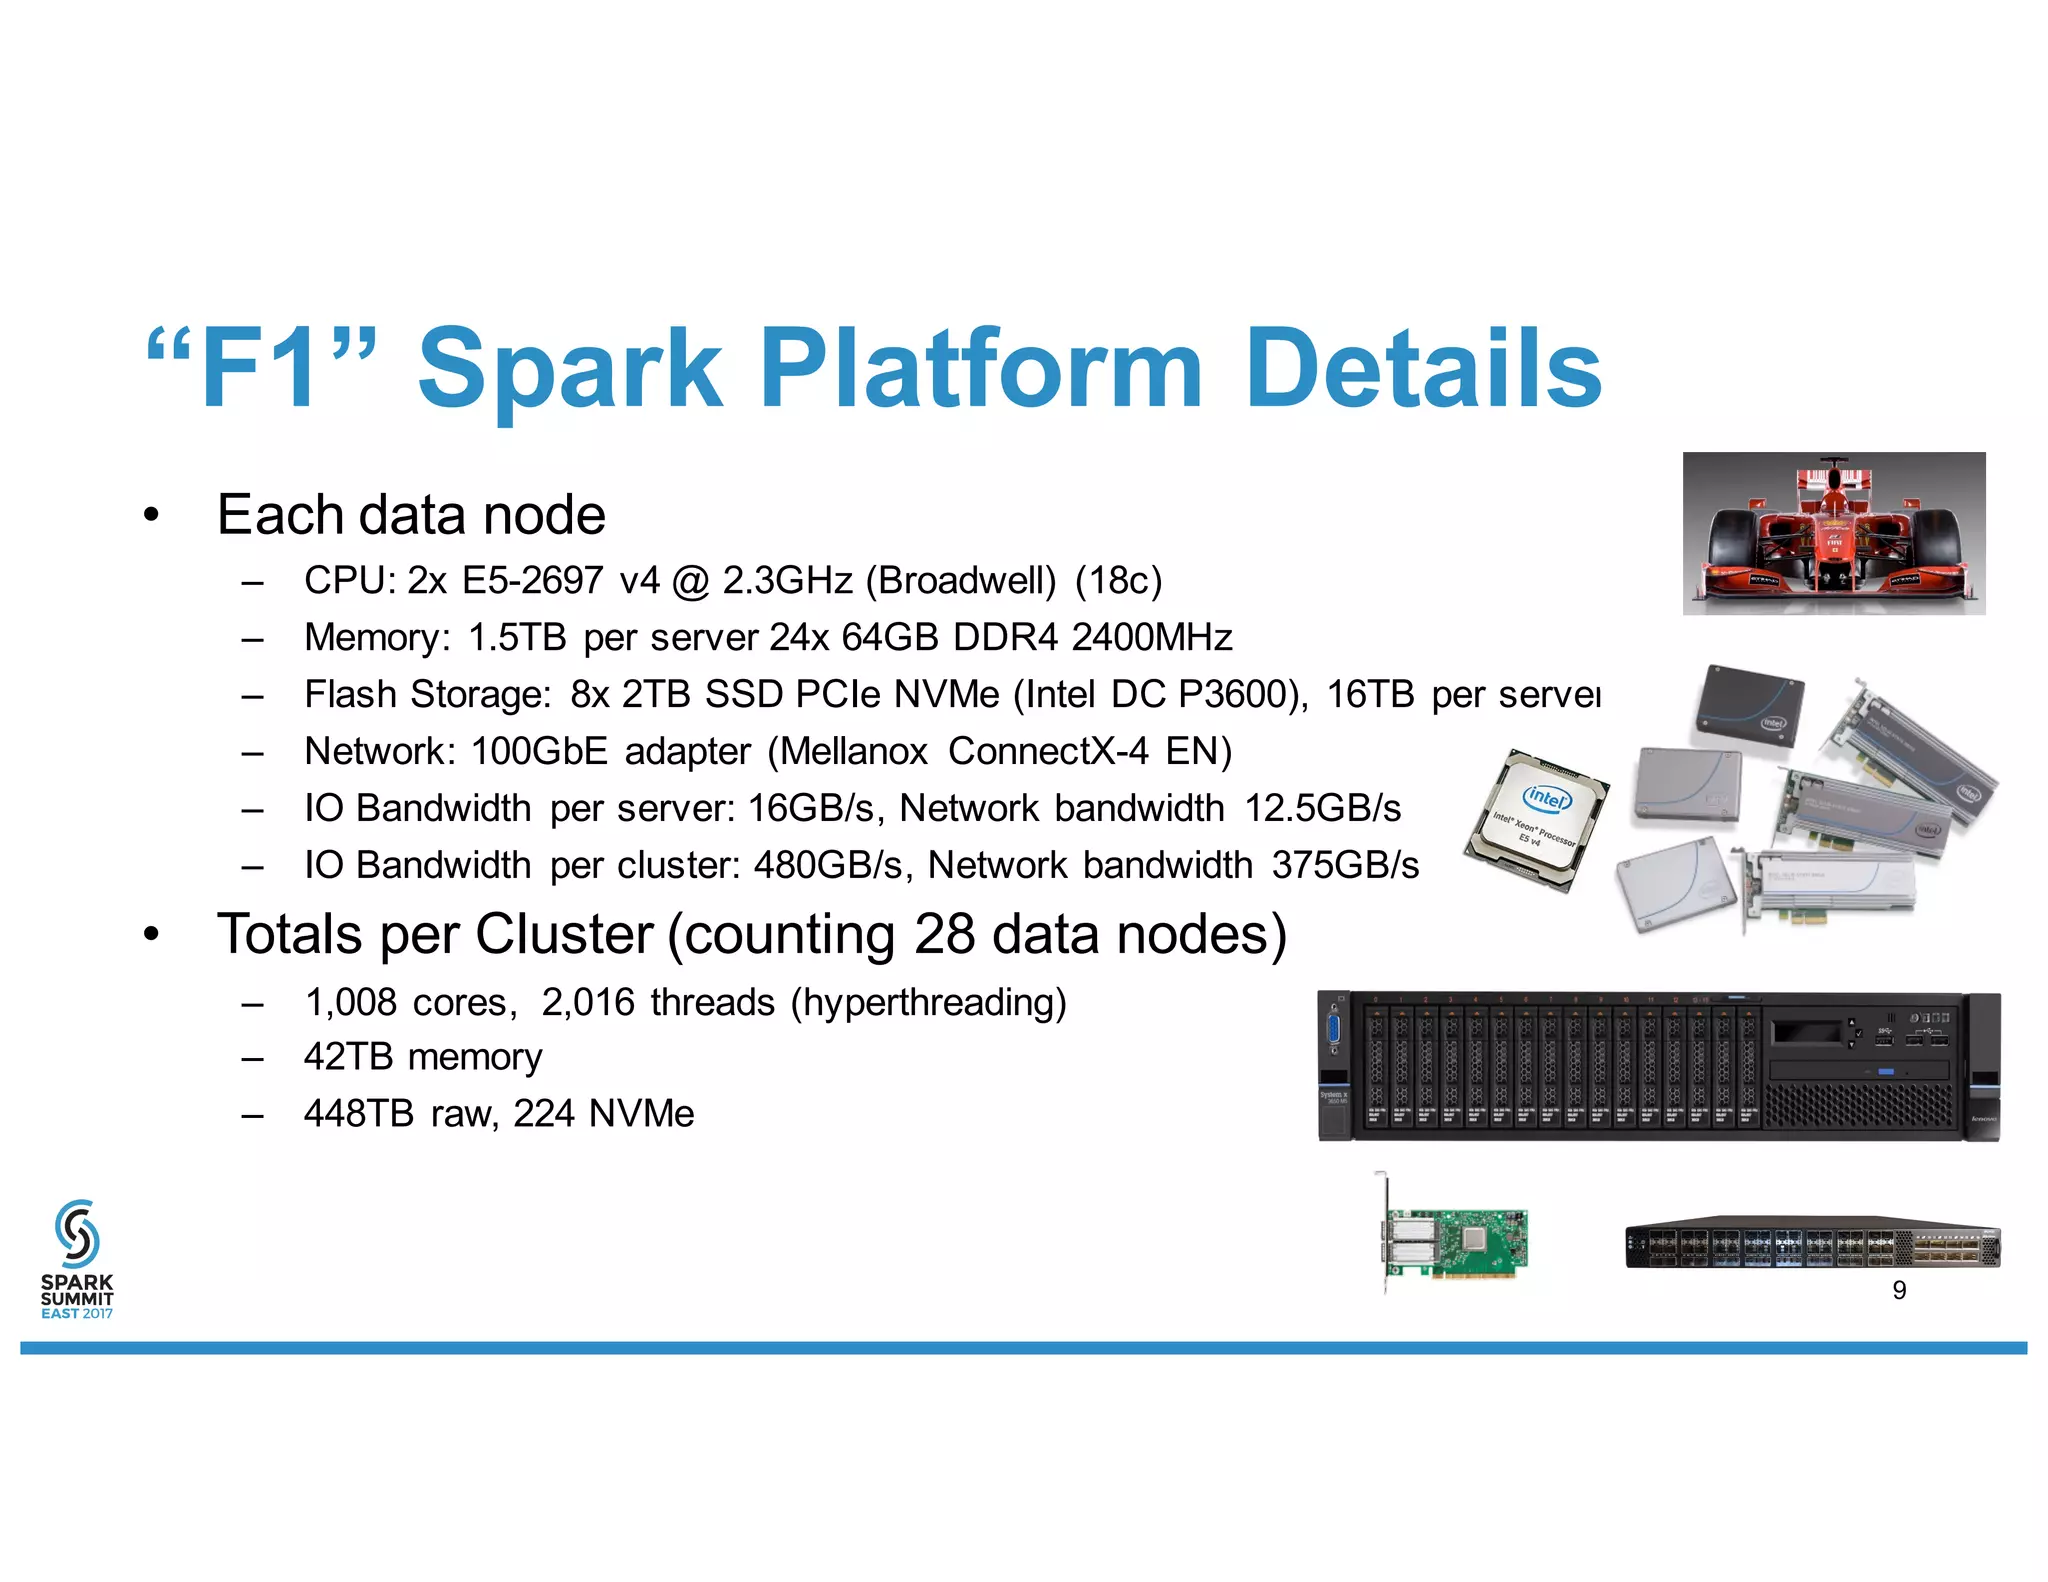
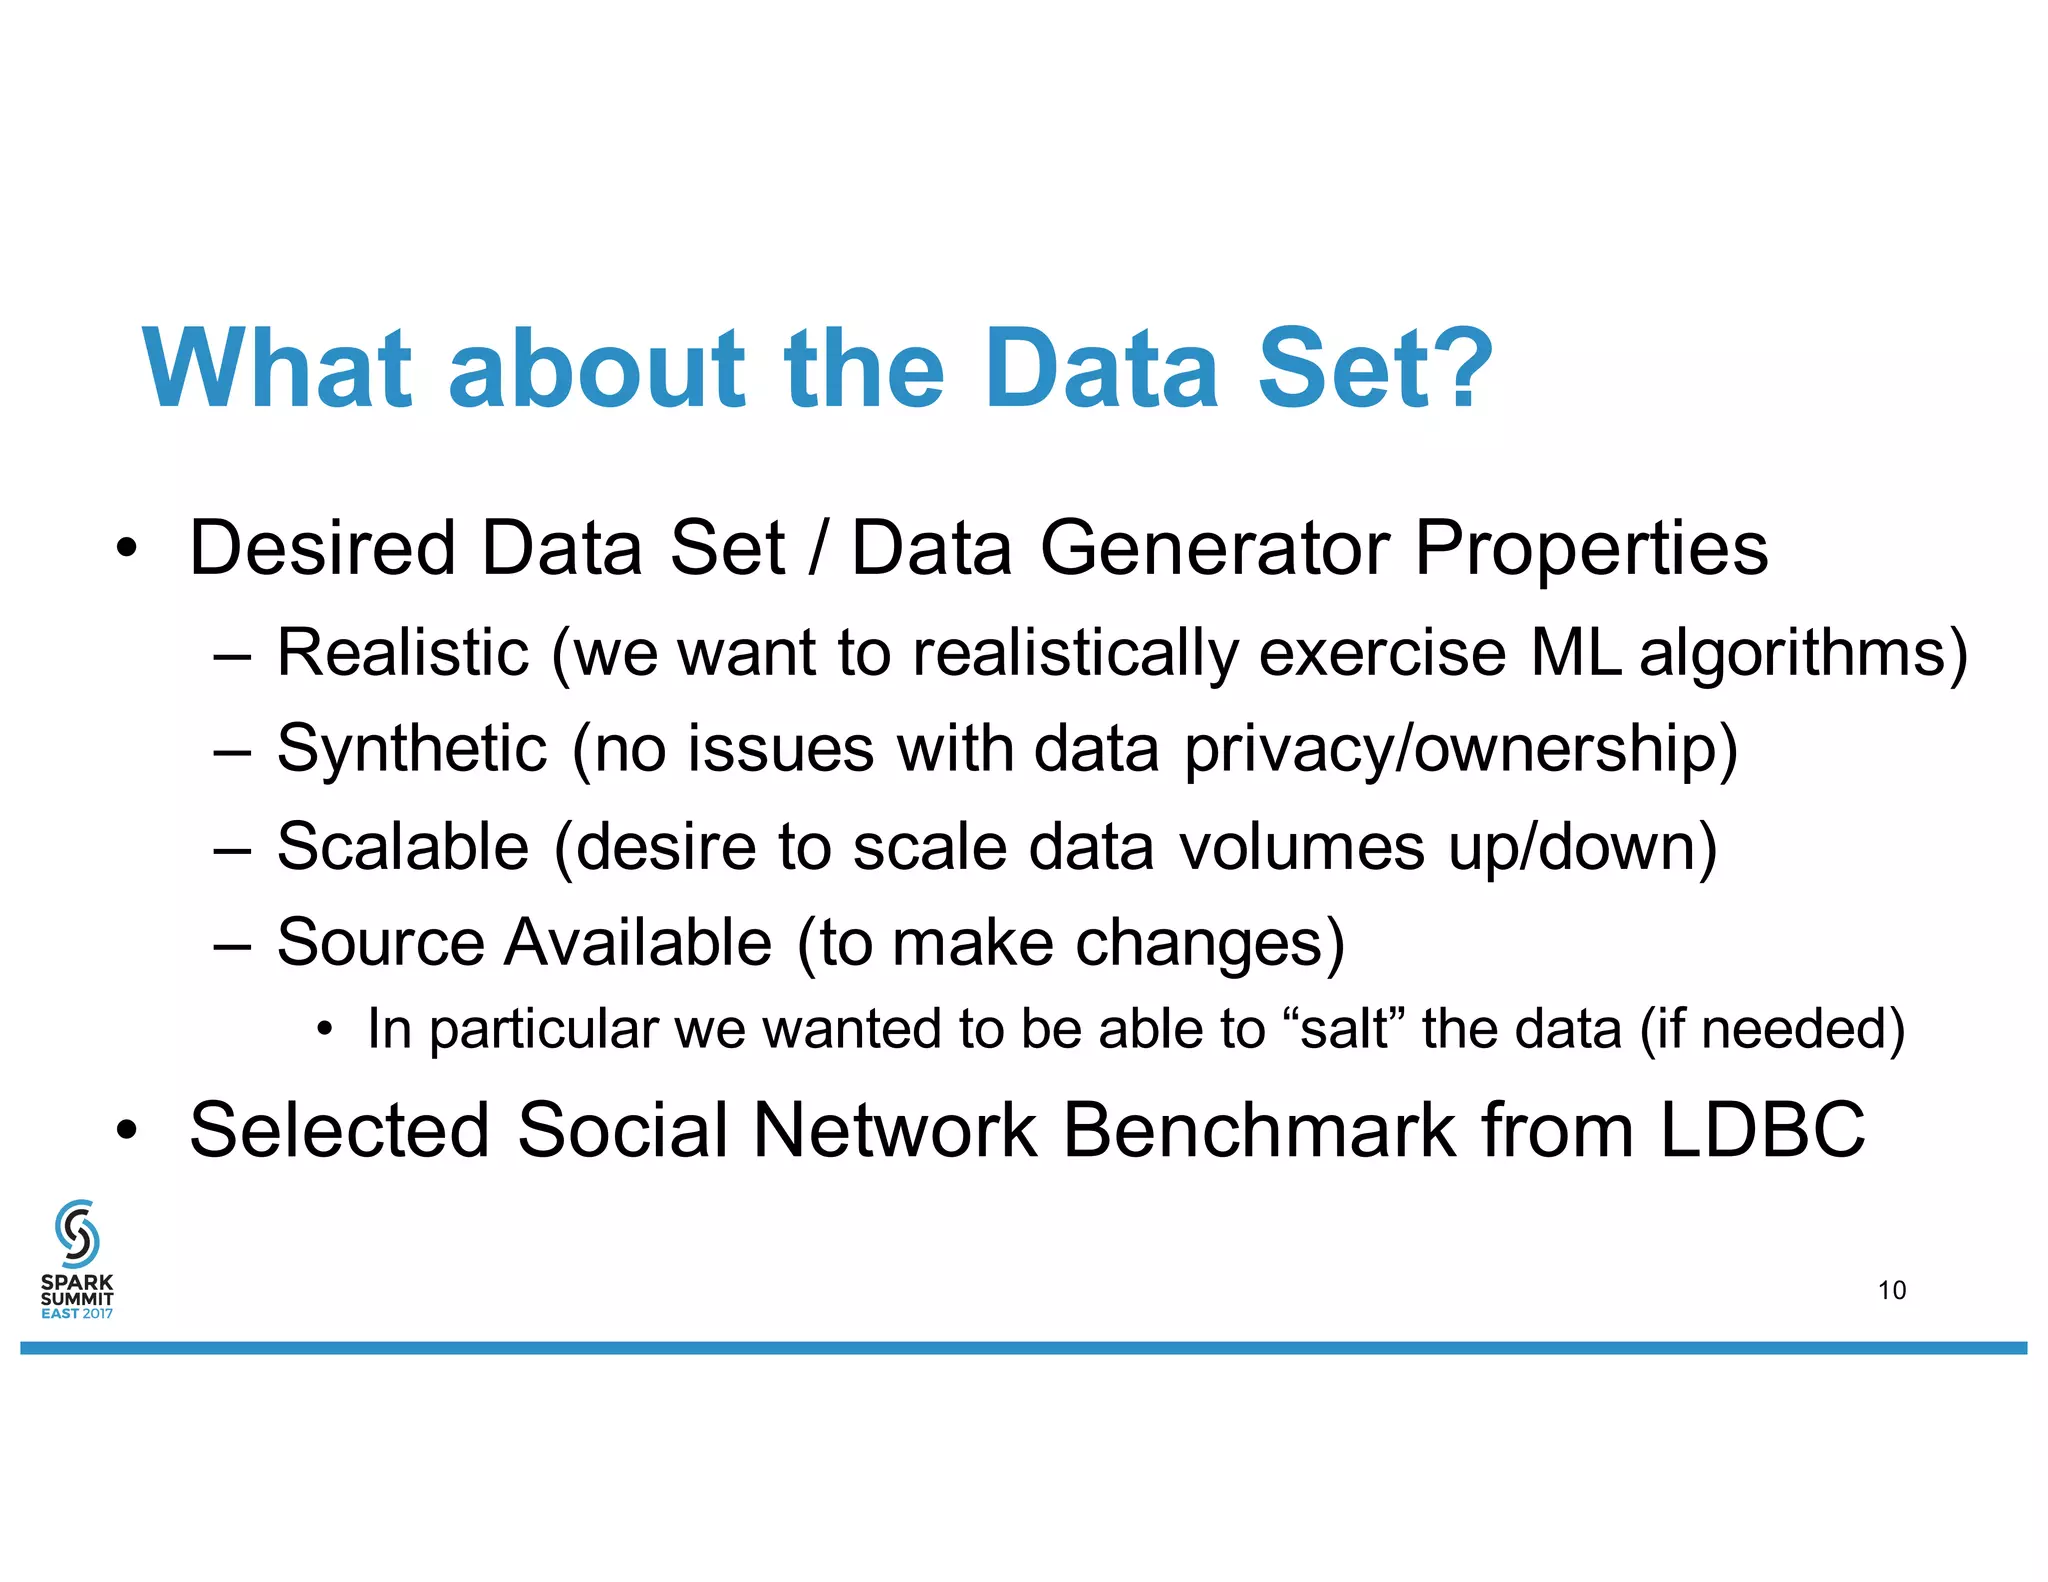
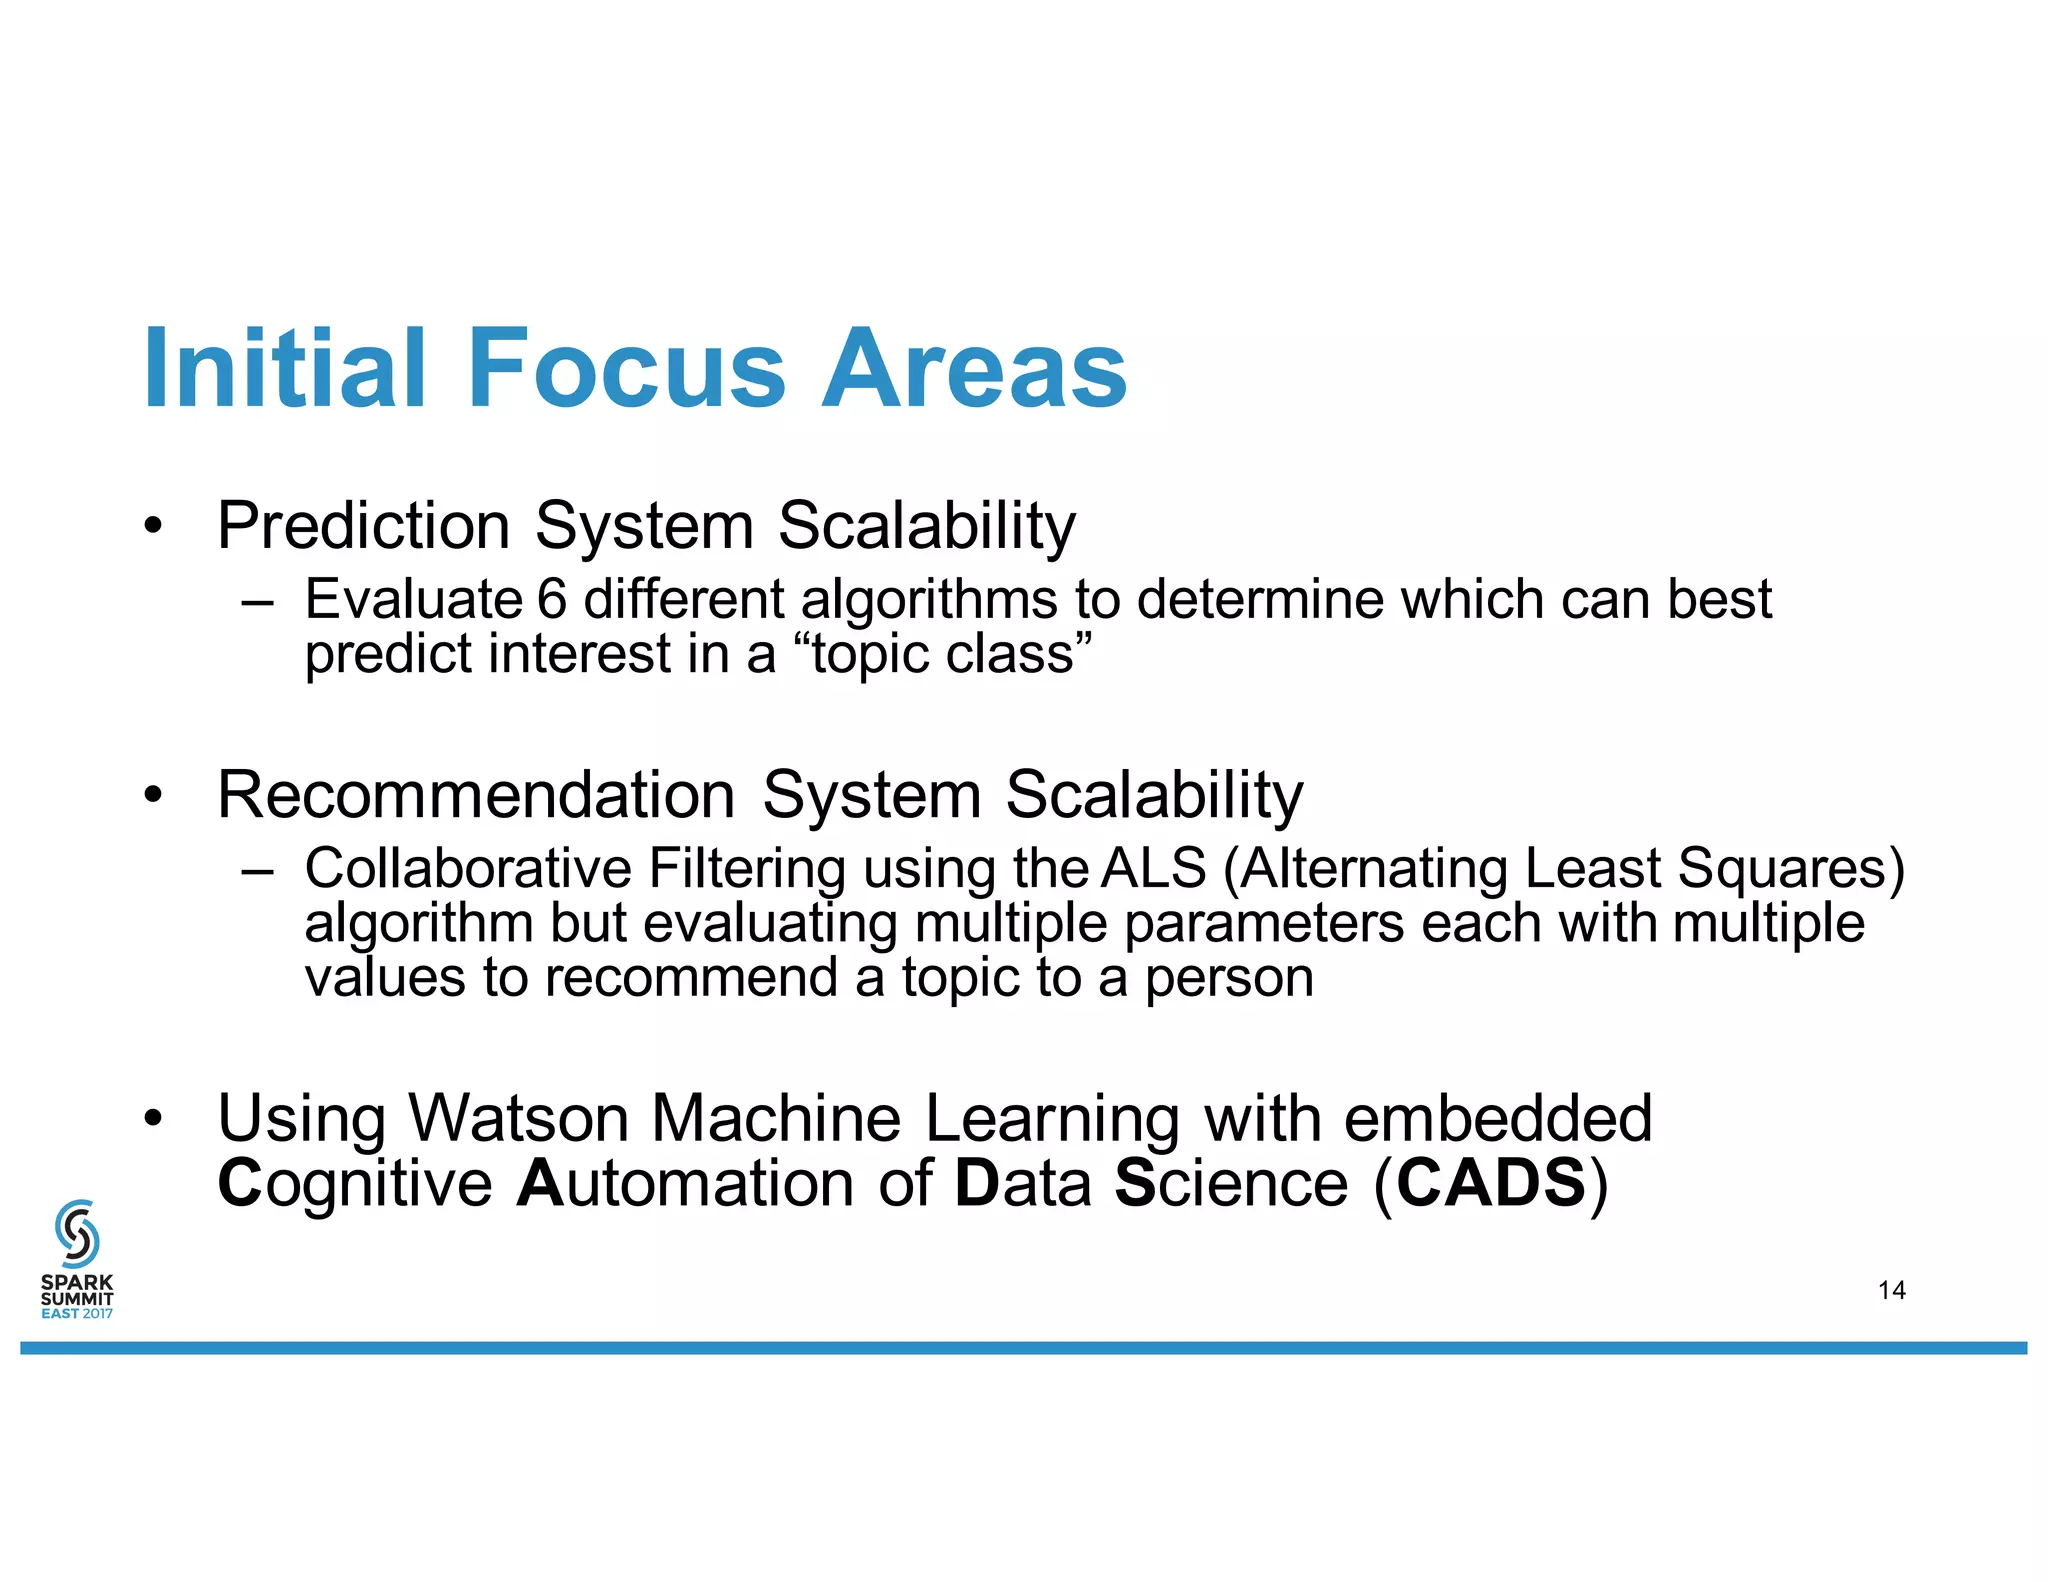
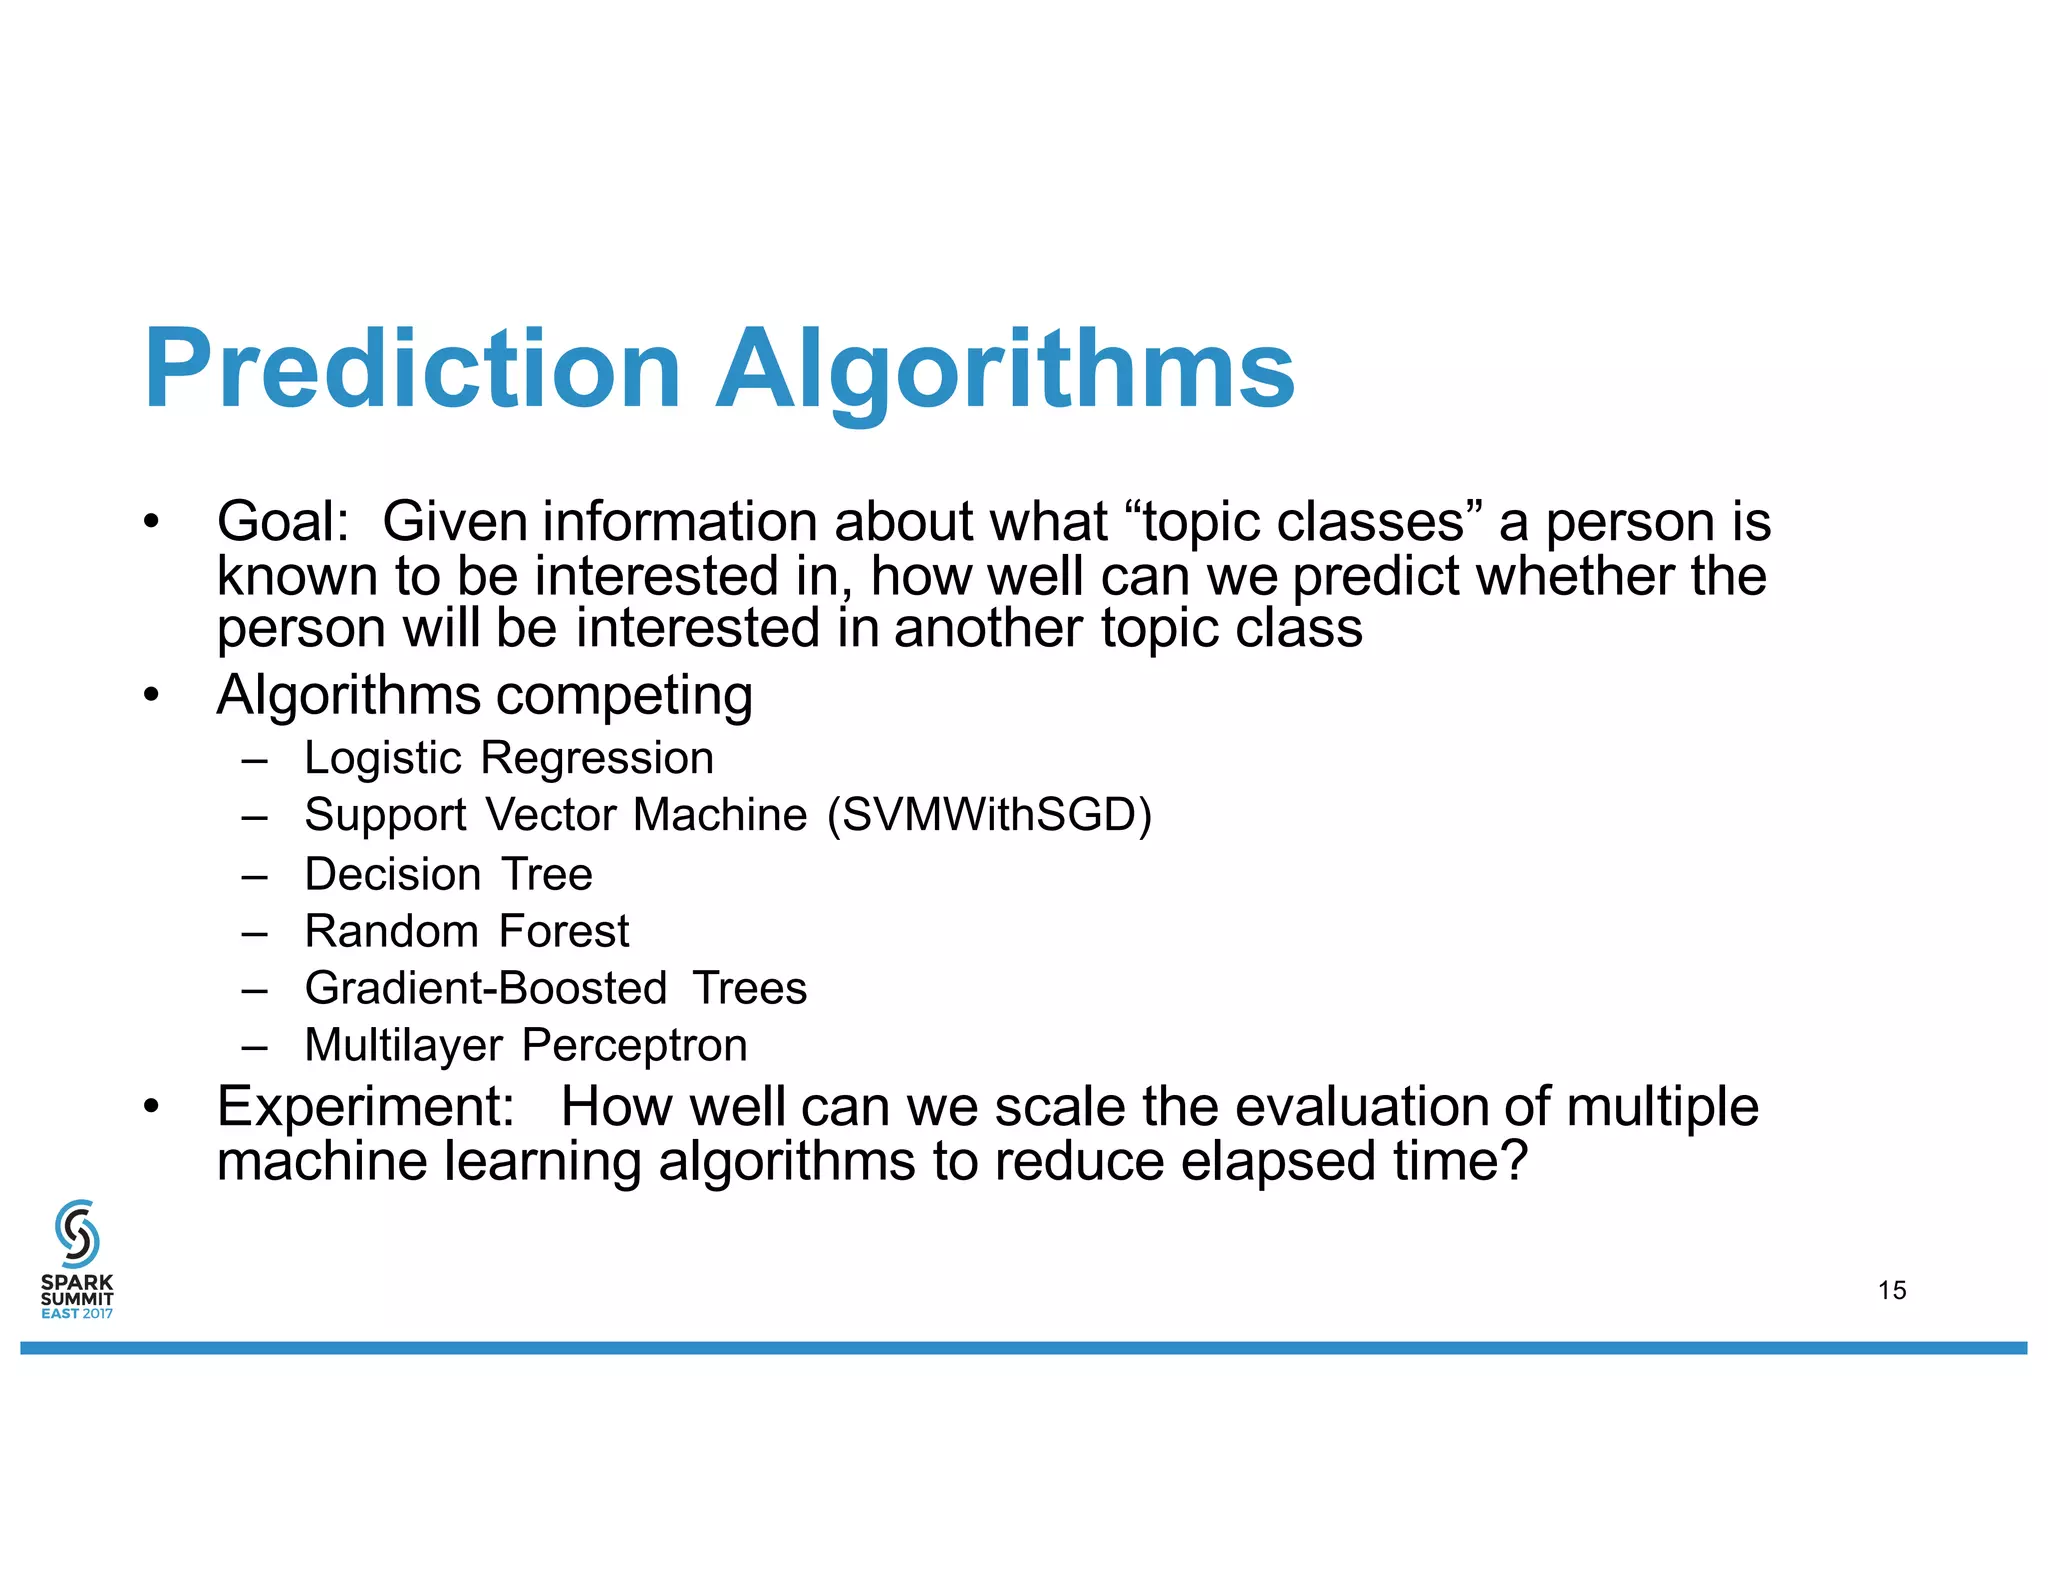
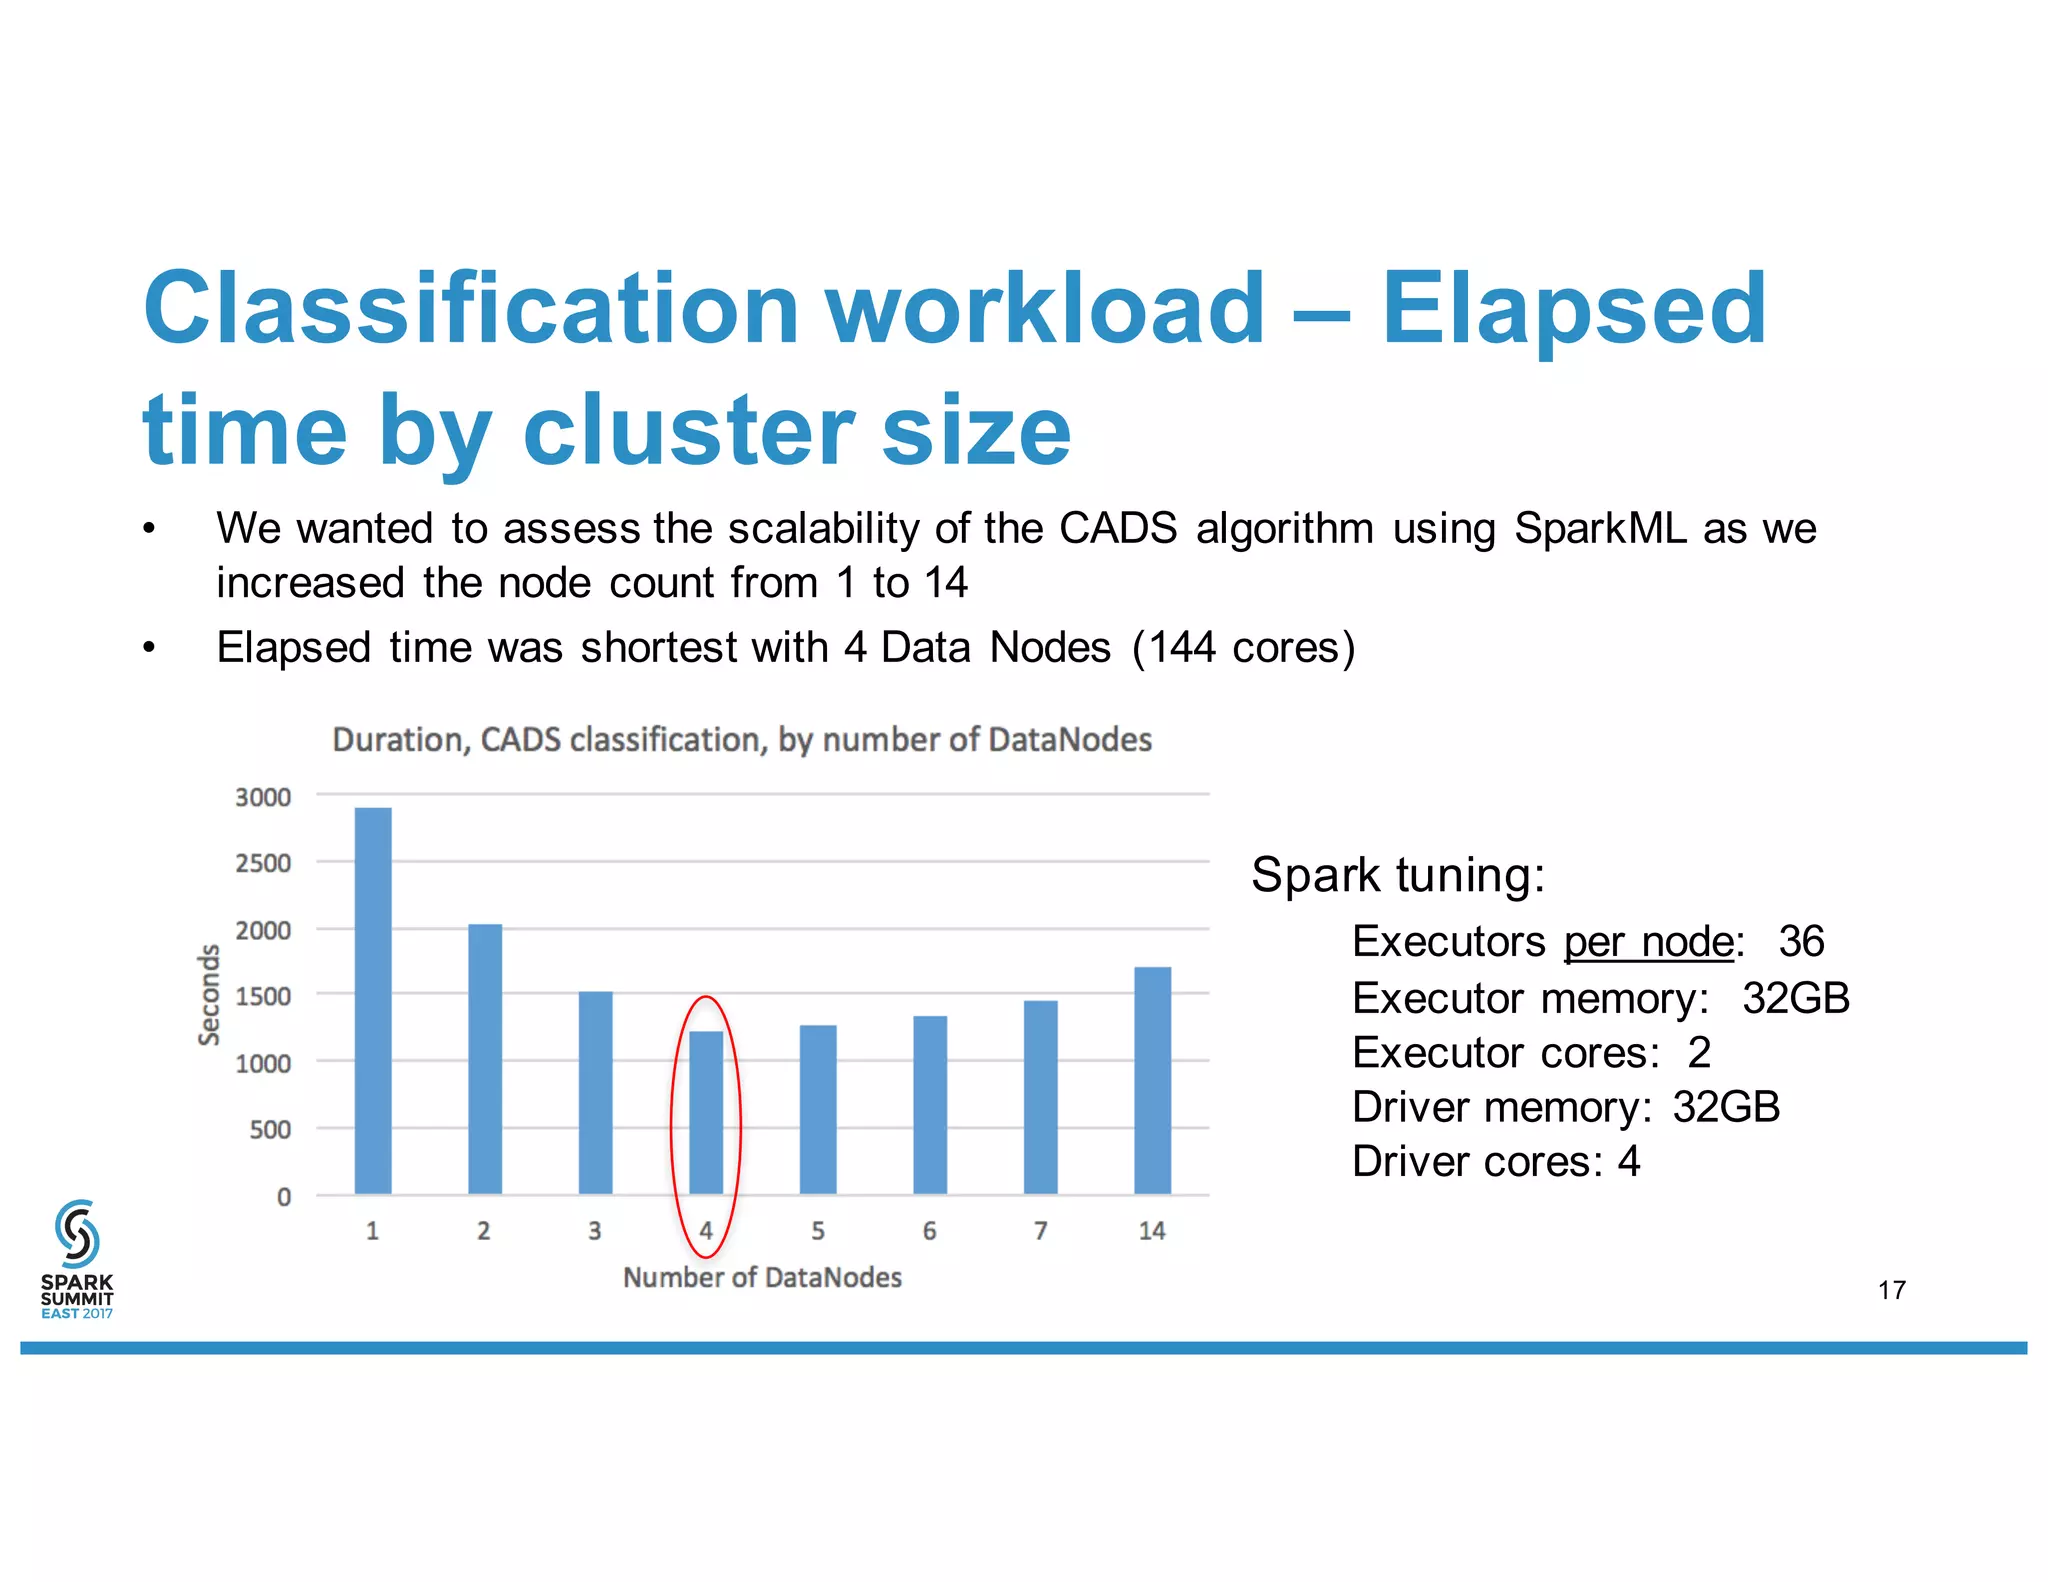
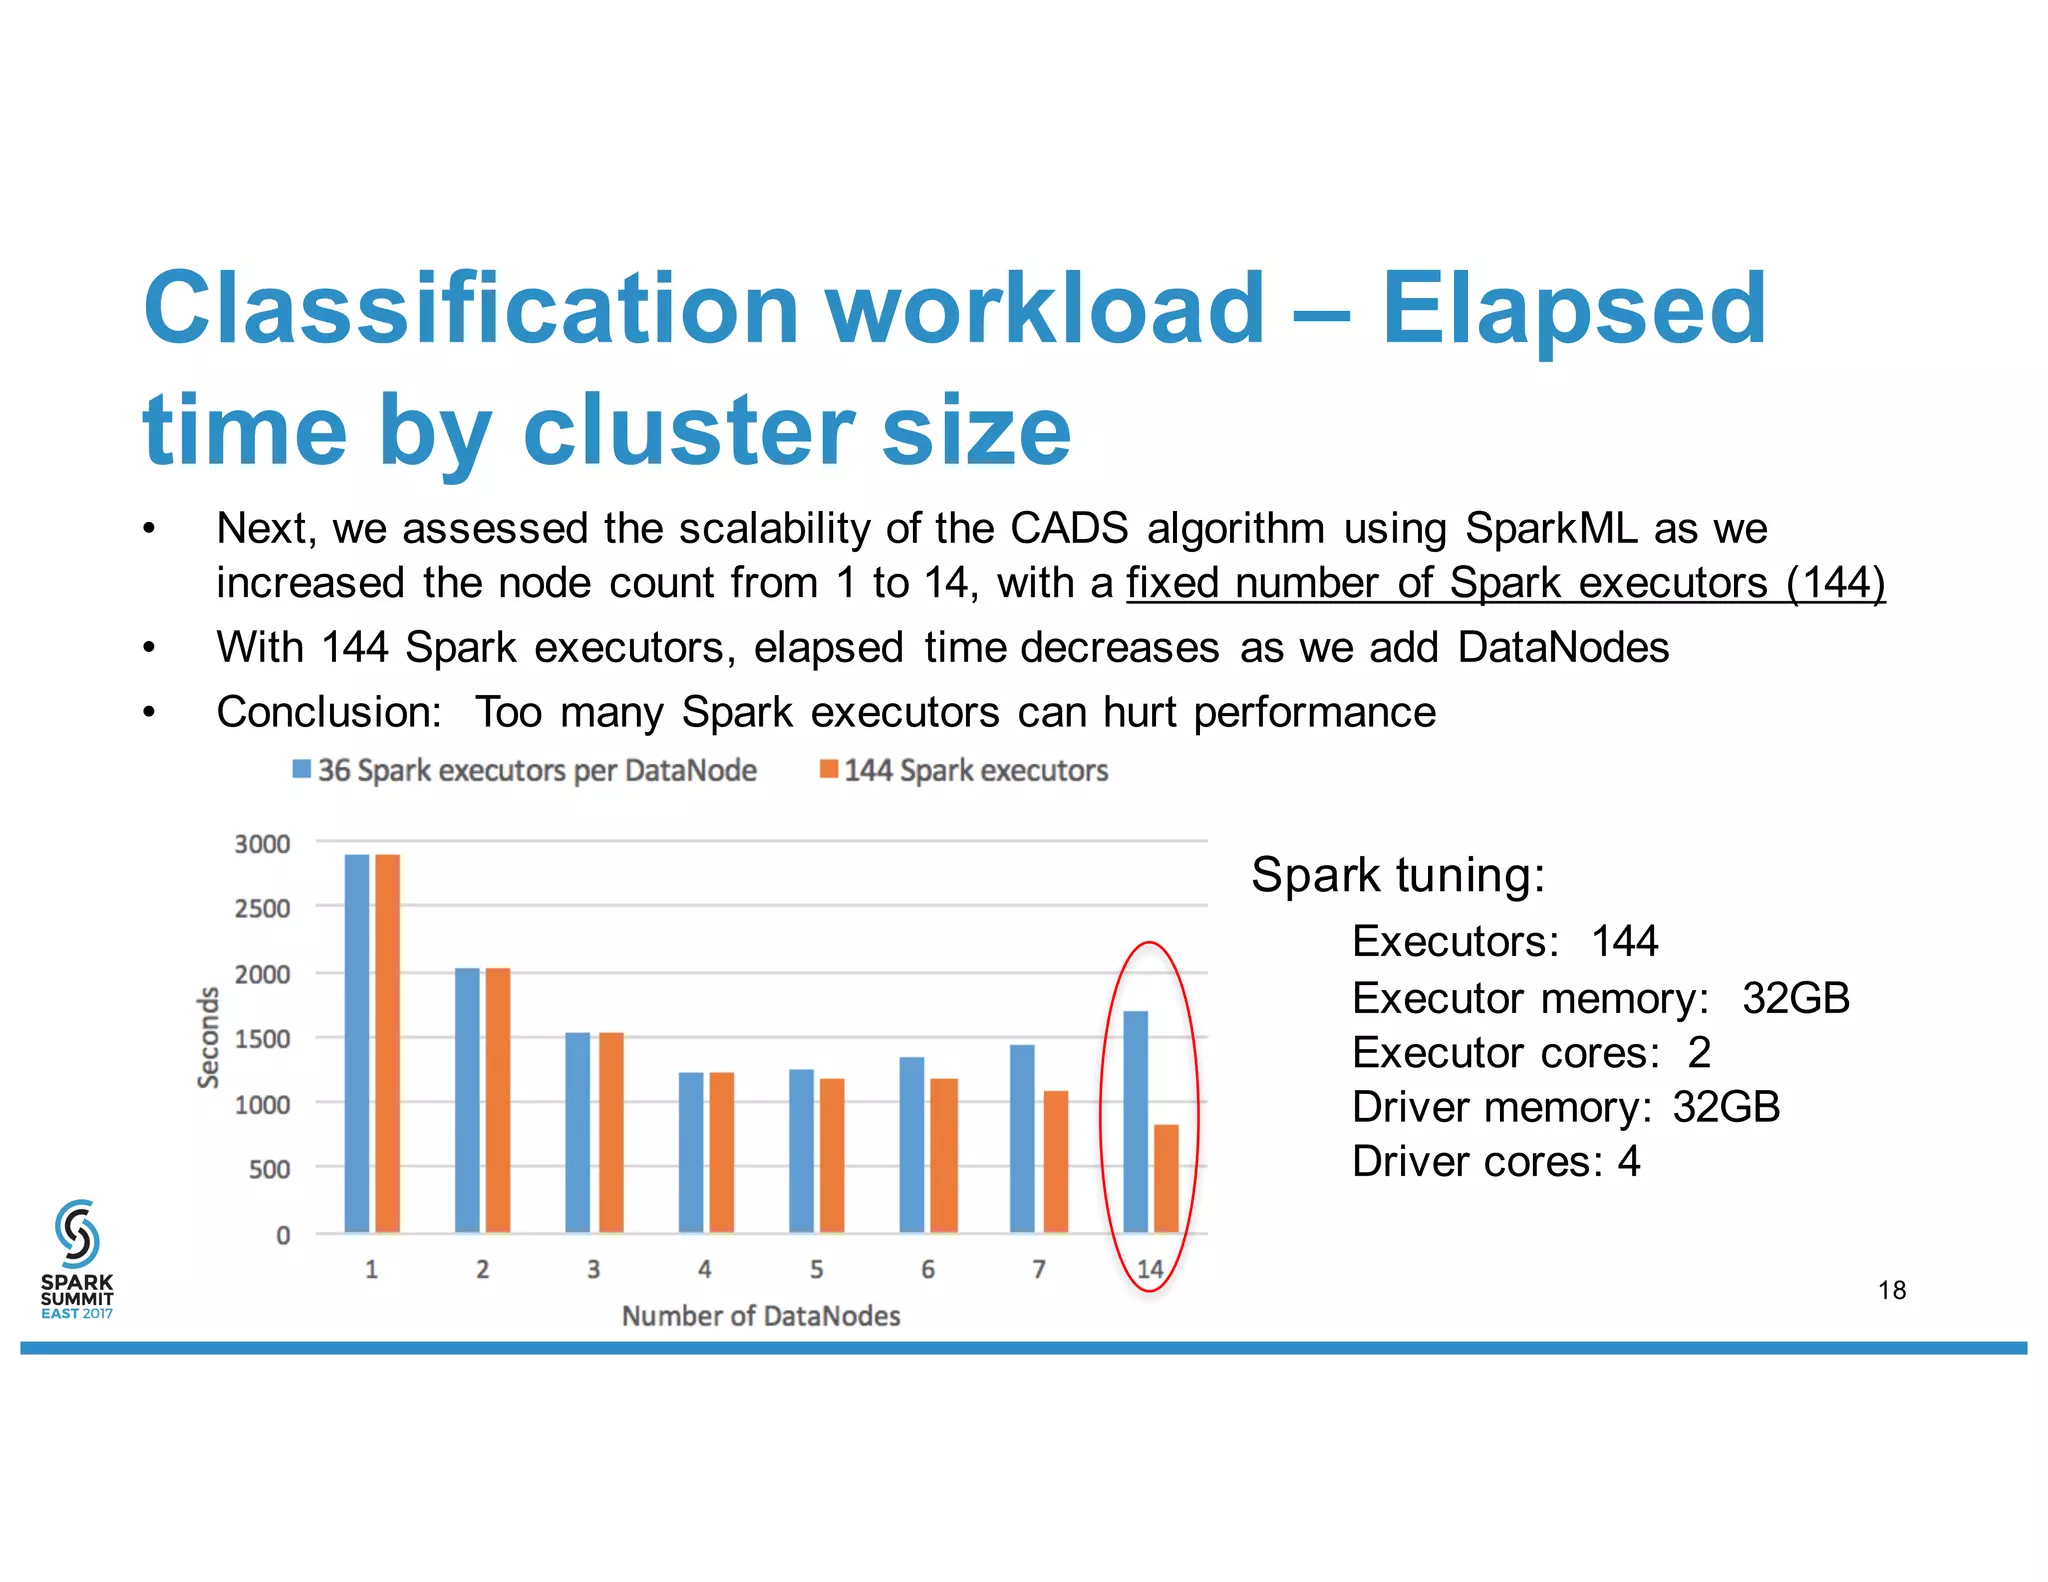
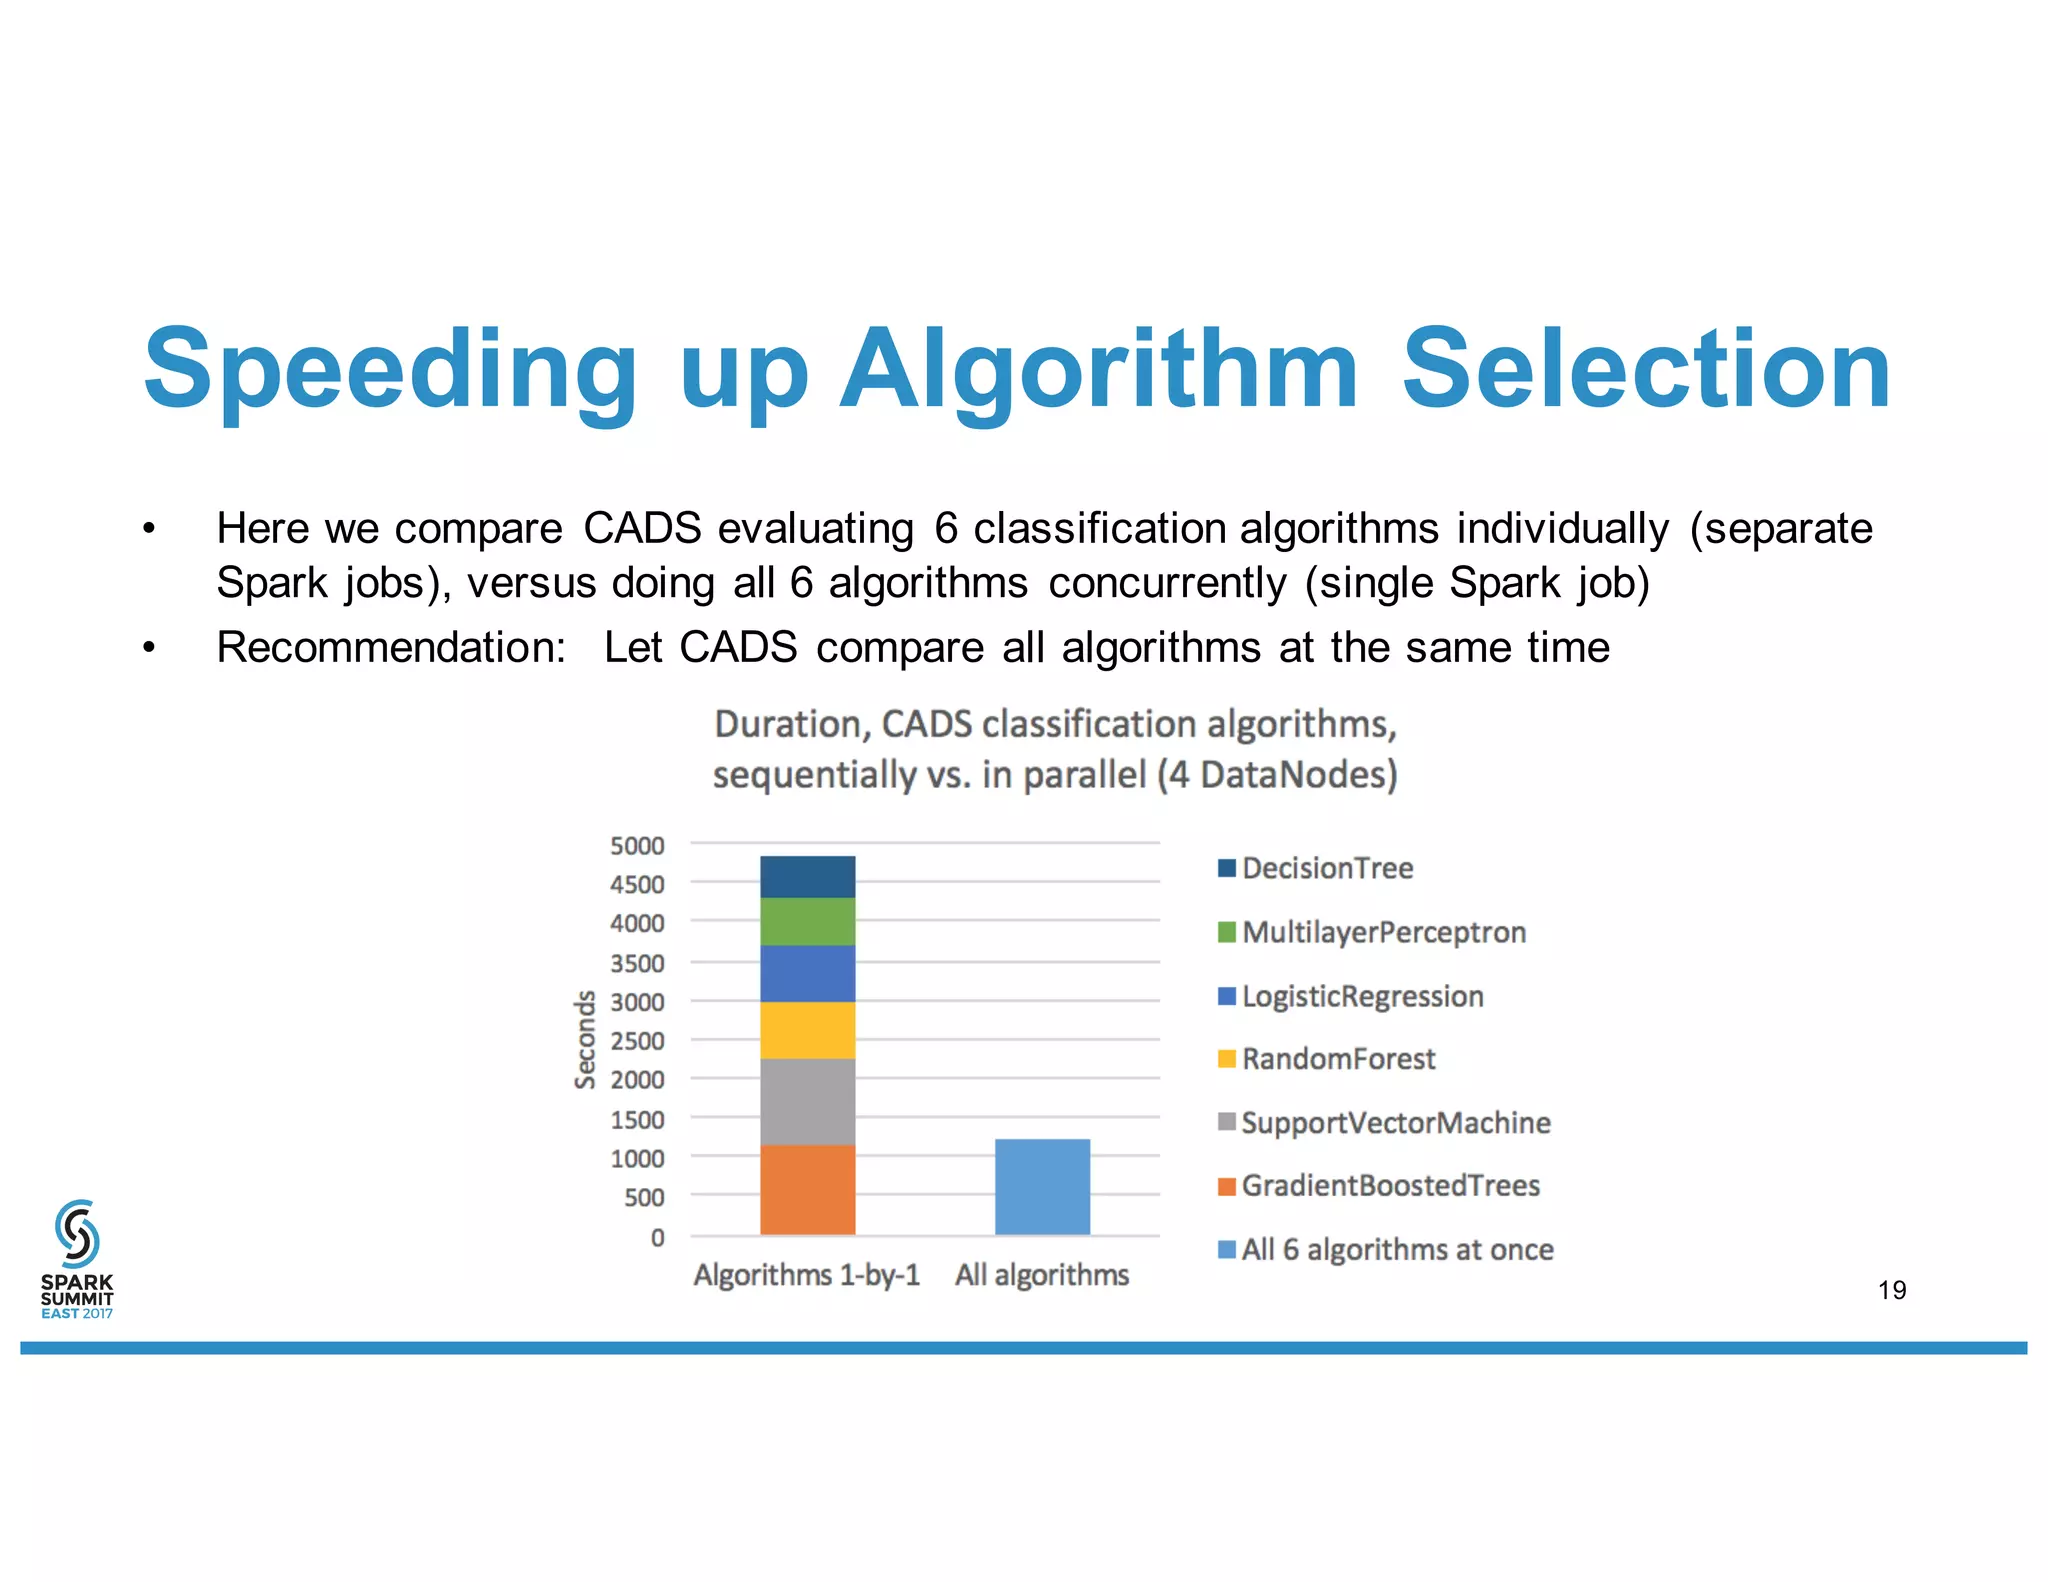
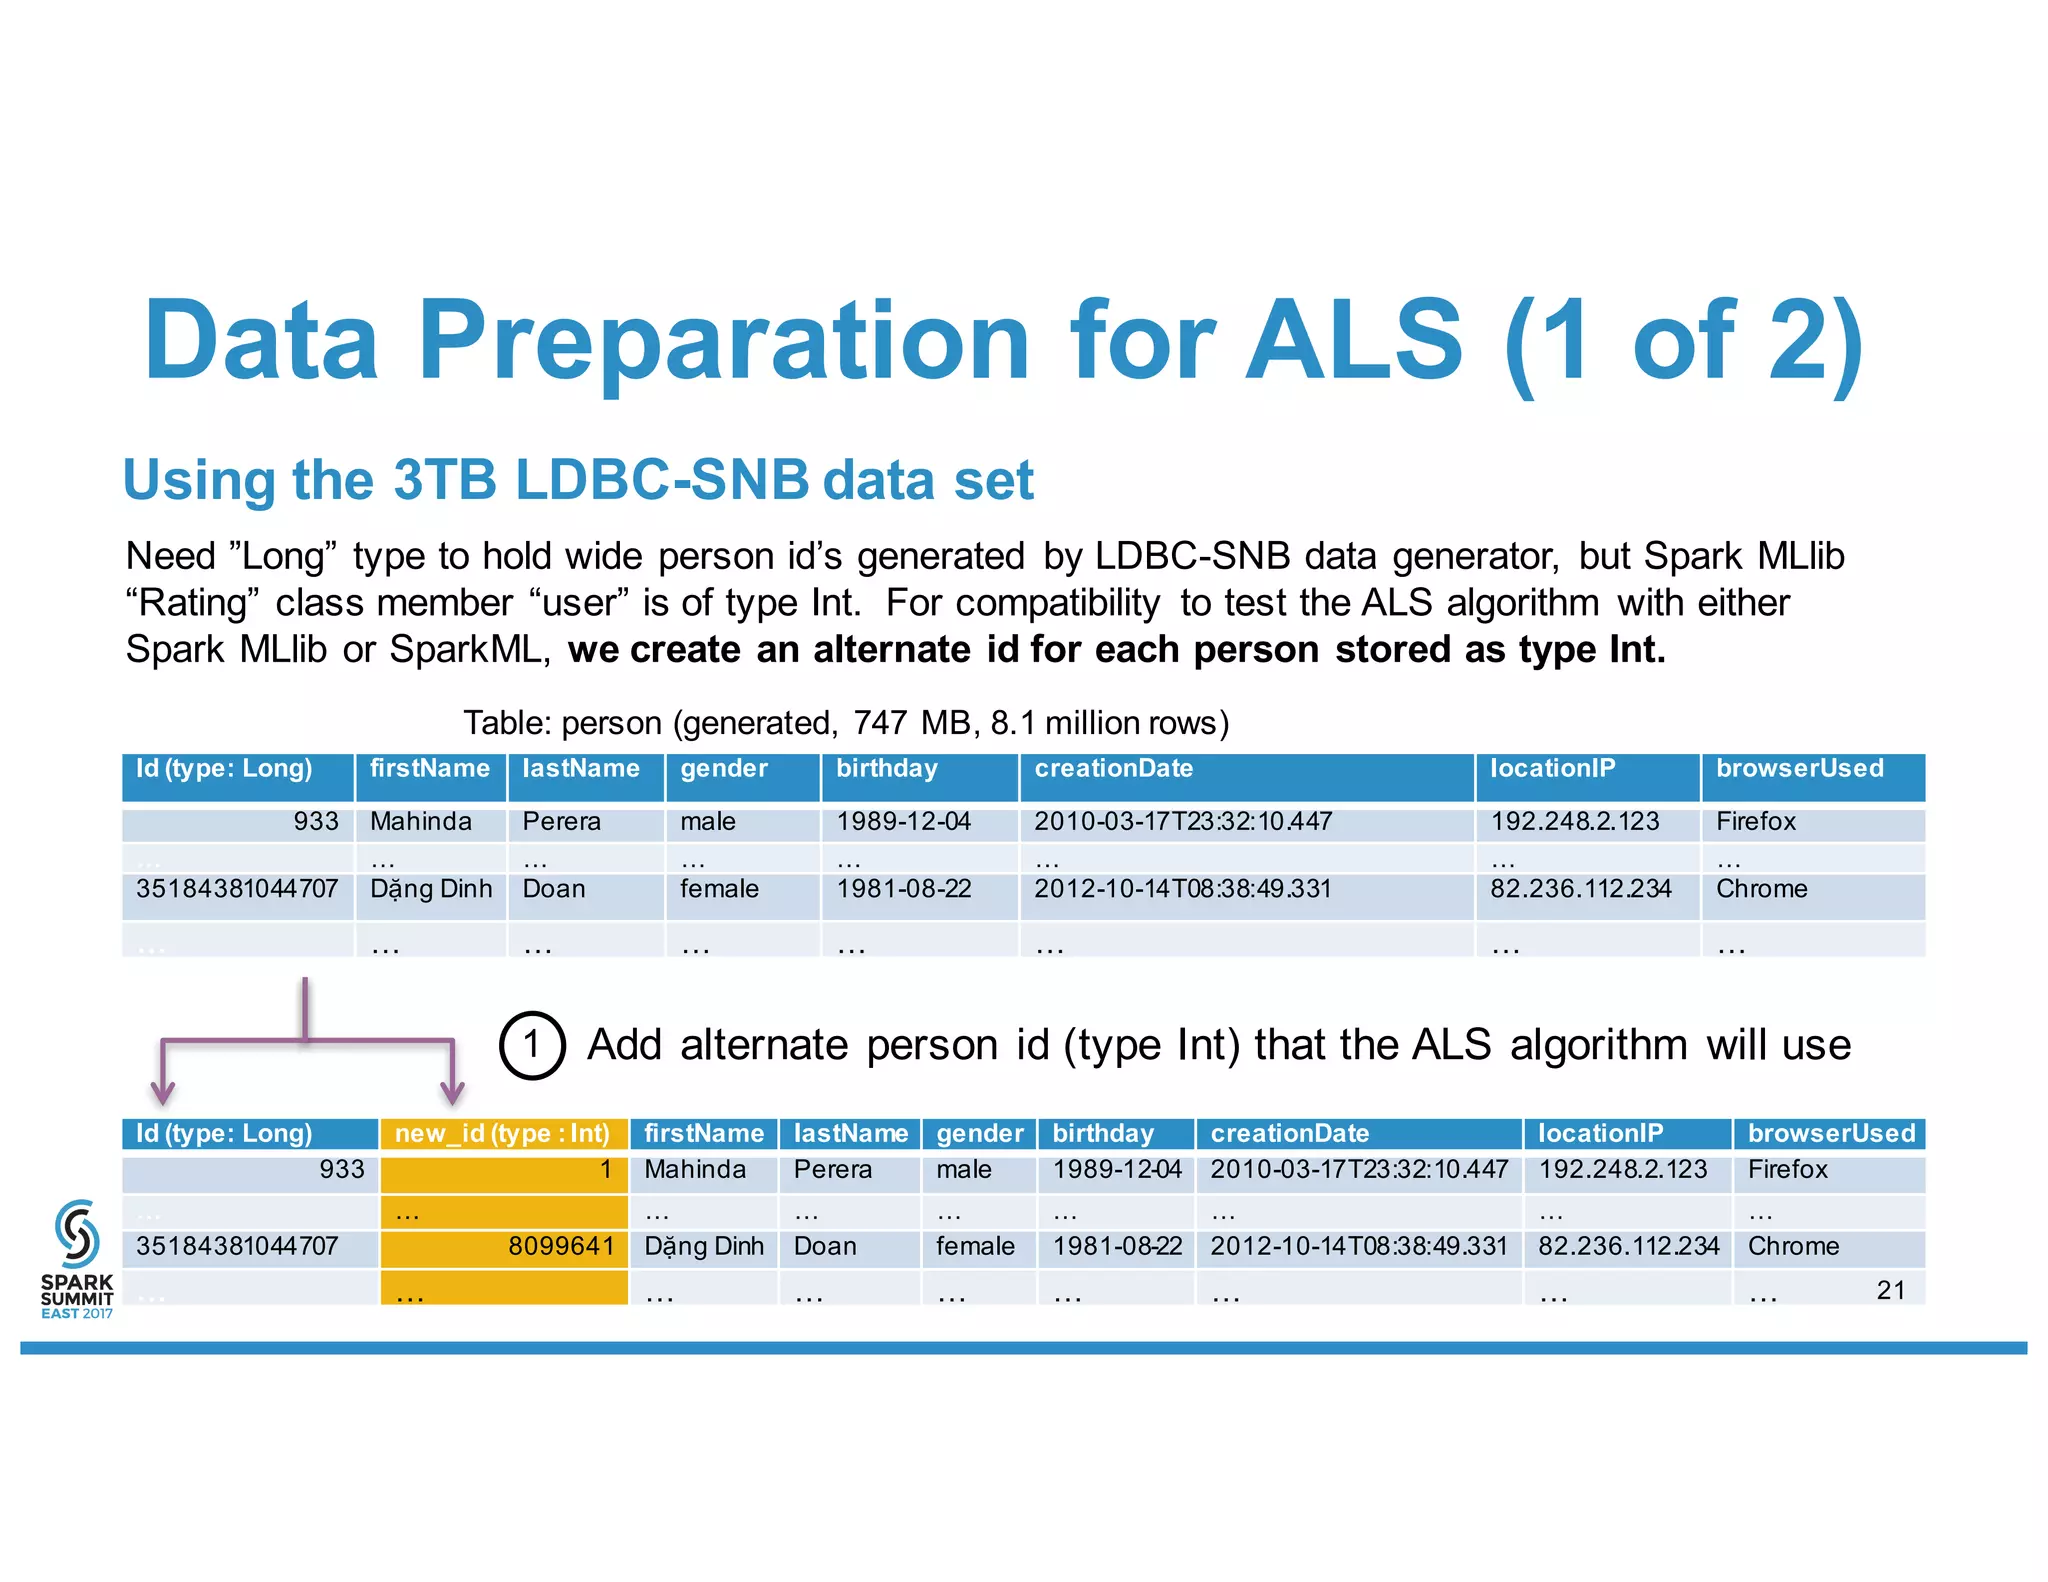
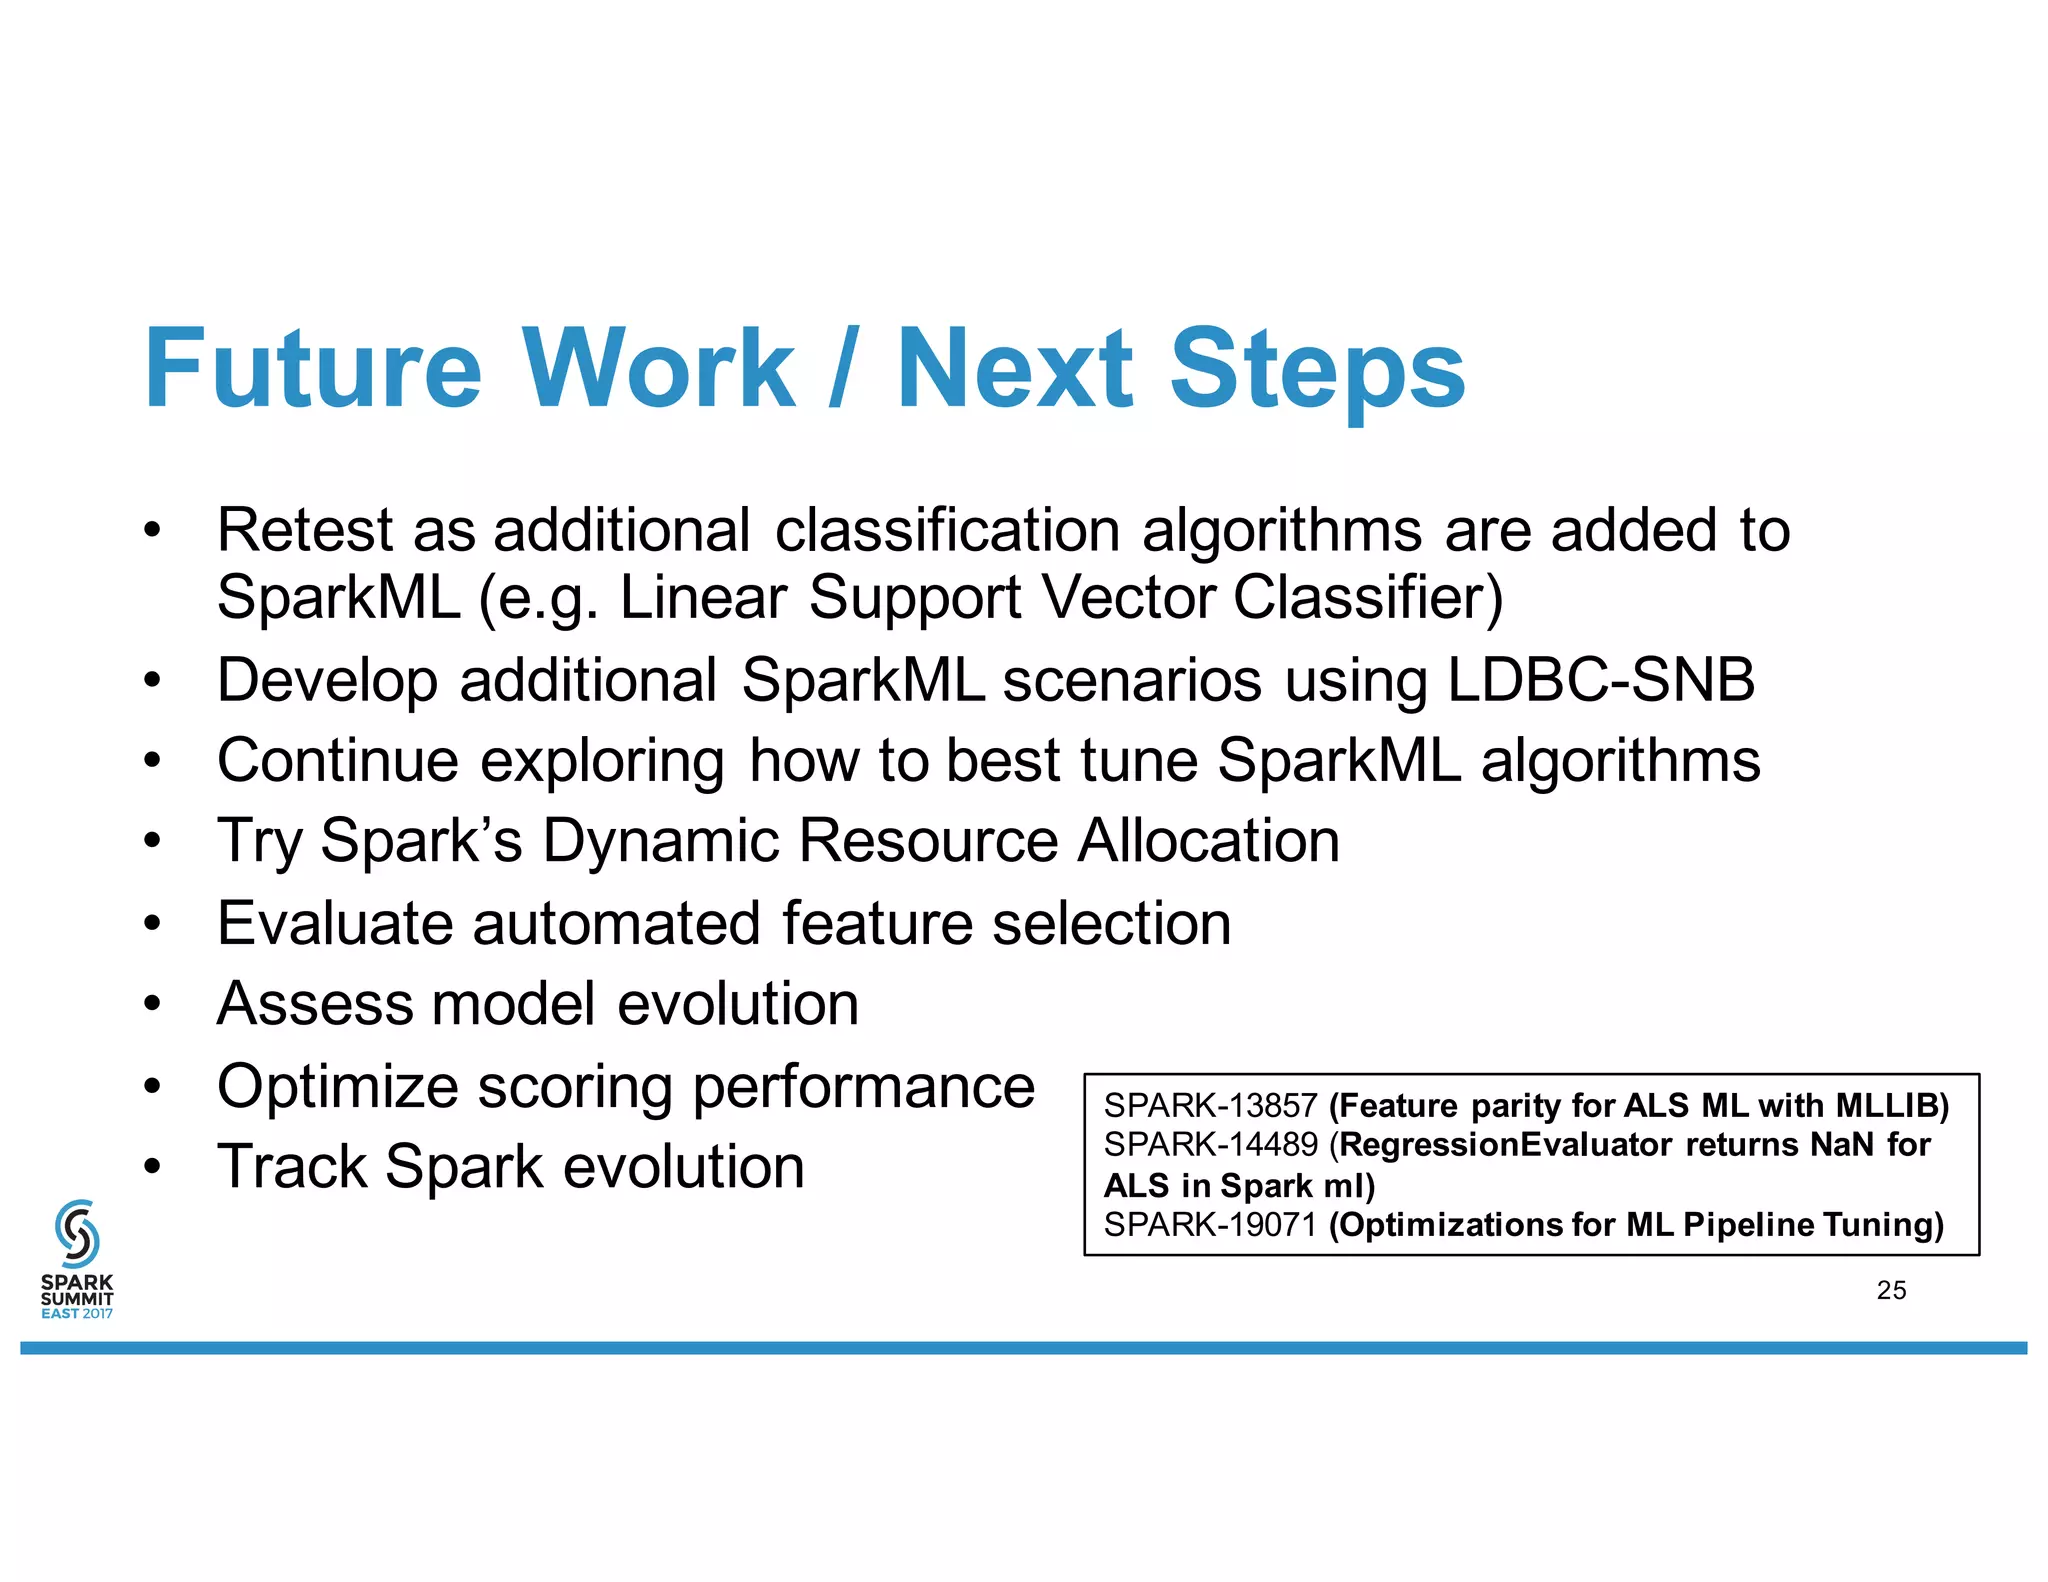
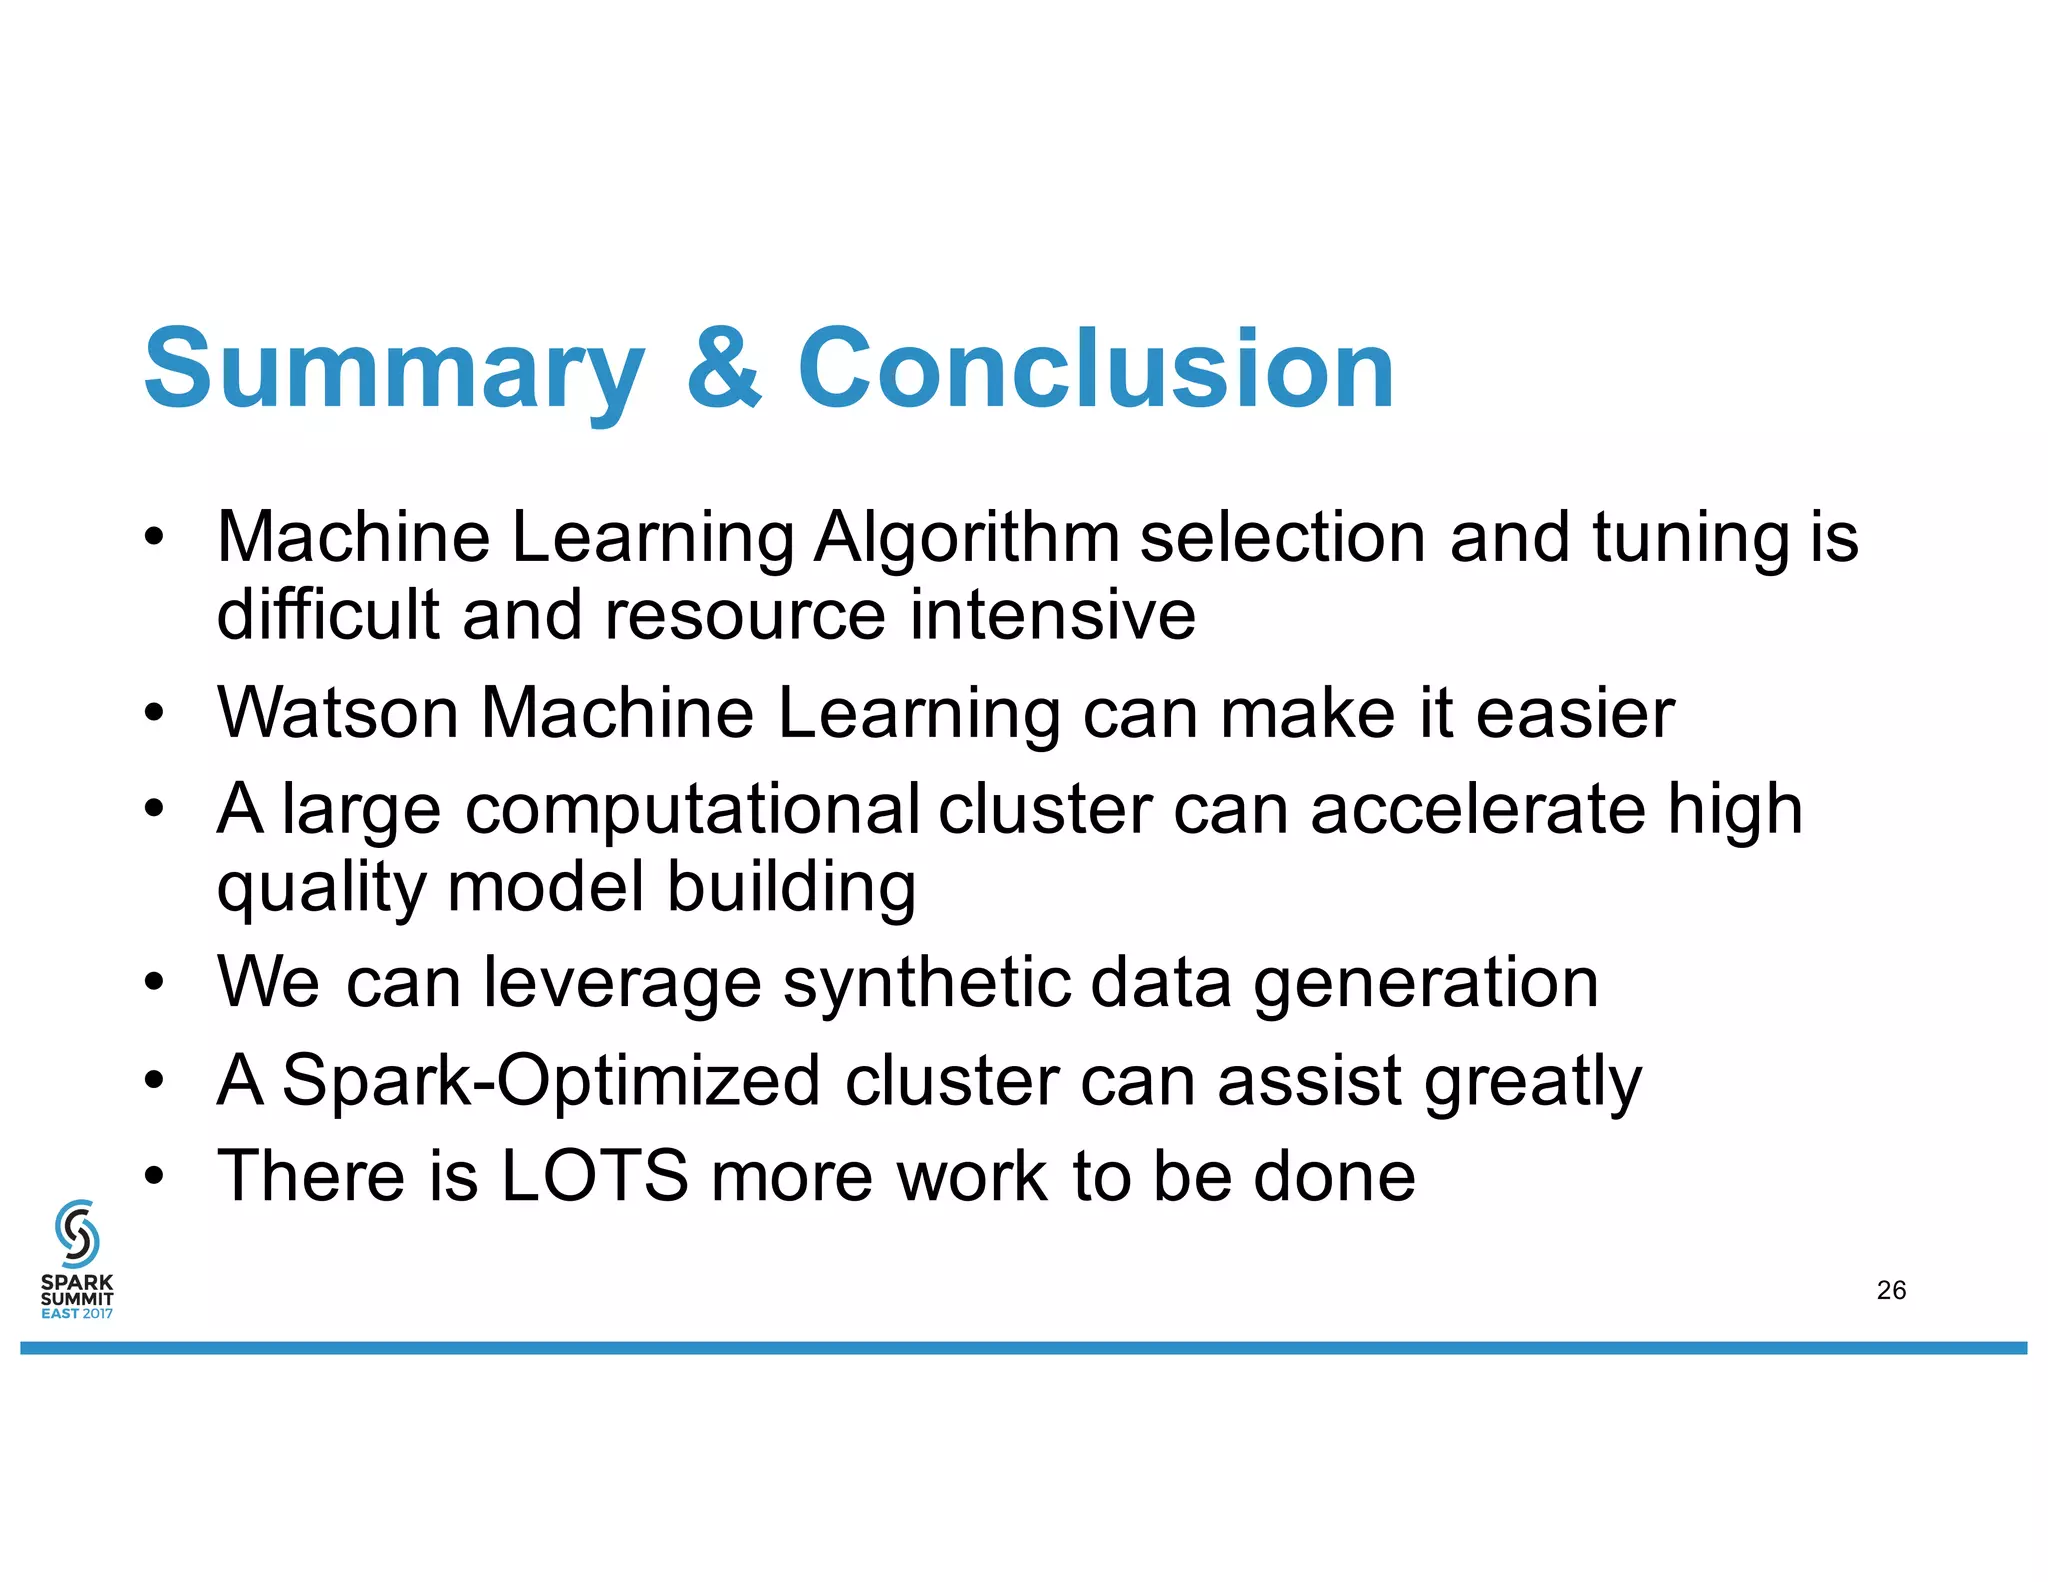
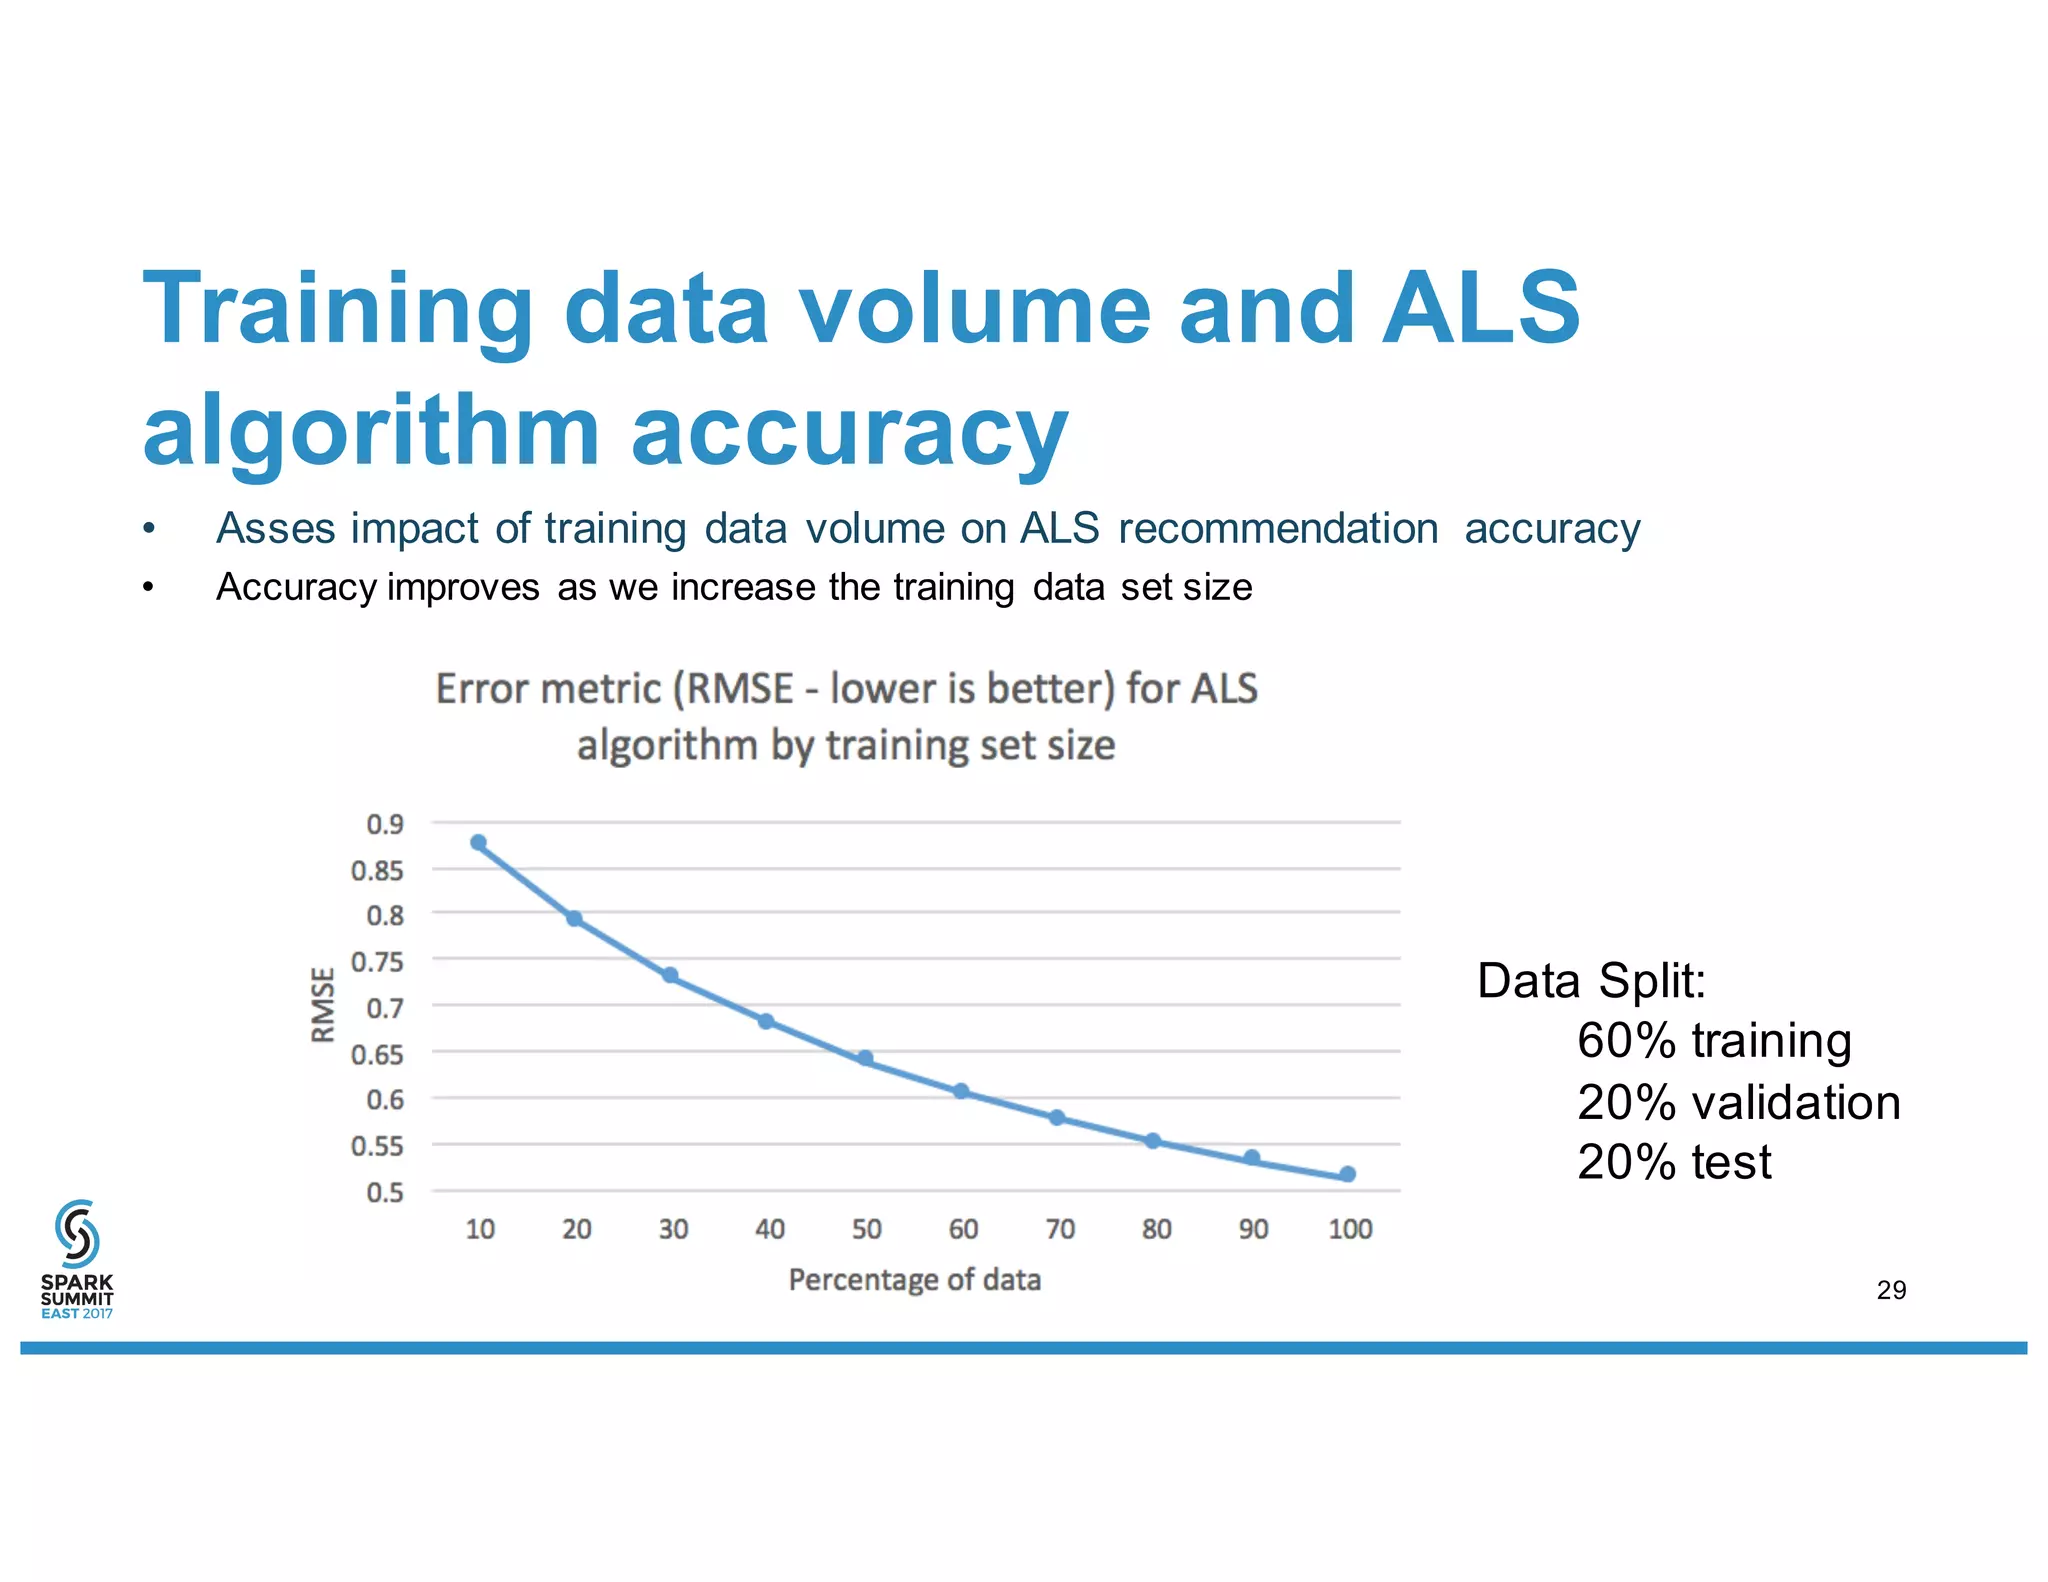
PRACTICAL LARGE SCALE
EXPERIENCES WITH SPARK
2.1 MACHINE LEARNING
Berni Schiefer
IBM, Spark Technology Center
Agenda
• How IBM is leveraging SparkML
• Our experimental environment
– hardware and benchmark/workload
• Focus areas for scalability exploration
• Initial results
• Future work
2
Built-in learning to
get started or go
the distance with
advanced
tutorials
Learn
The best of open source
and IBM value-add to
create state-of-the-art
data products
Create
Community and
social features that
provide meaningful
collaboration
Collaborate
Sign up today! - http://datascience.ibm.com
IBM Data Science Experience
3
Pipeline
Model
The Machine Learning Workflow
retraining
History
Data
Pipeline
Model
Feedback
Data
scoring
monitoring
Operational
Data
deploying
redeploying
Predictions
Data
Scientist
ML
Pipeline
Data visualization
Feature
engineering
Model training
Model Evaluation
Developer/
stackholder
IBM Watson Machine Learning 4
Key Model Training Questions:
• Which machine learning algorithm should I use?
• For a chosen machine learning algorithm what
hyper-parameters should be tuned?
Explosive search space!
5
© 2015 IBM Corporation
Data Scientist Workflow With CADS
6
Science of
Analytics
Repository
Deployed Analytic
UserInterface(orREST-APIdirectly)
1
4
5
Deployed Analytic
62
LearningController
Tactical
Planner
Orchestrator
and Scheduler
Learning Controller
Analytic Monitoring
and Adaptation
Analytic
Platforms
Knowledge Acquisition
External Knowledge
about Analytics
3
AI technology automatically determines best analytics pipeline
Data ScientistcaninteractwithSystem
Cross-PlatformDeploymentandEvaluation
Input: Supervisedprediction problem
Submit to
CADS
…
© 2015 IBM Corporation
Model Selection via “Data Allocation using Upper Bounds (DAUB) “
7
Logistic Regression
A3
SVMRandom Forest
…
500 500# Additional
Data points
------------------
Built Model
------------------
Prediction Accuracy
versus #Data Points
TrainingData
Ranking based on
upper bound
estimate on
performance of
each pipeline
(‘slope’ of learning
curve)
https://arxiv.org/pdf
/1601.00024.pdf
7
Our “F1” Spark SQL Cluster
• A 28-node cluster
– 2 management nodes (co-exist
with 2 data nodes)
– 28 data nodes
• Lenovo x3650 M5
– 2 sockets (18cores/socket)
– 1.5TB RAM
– 8x2TB SSD
– 2 racks,
• 20x 2U servers per rack (42U racks)
– 1 switch, 100GbE, 32 ports, 1U
• Mellanox SN2700
8
• Each data node
– CPU: 2x E5-2697 v4 @ 2.3GHz (Broadwell) (18c)
– Memory: 1.5TB per server 24x 64GB DDR4 2400MHz
– Flash Storage: 8x 2TB SSD PCIe NVMe (Intel DC P3600), 16TB per server
– Network: 100GbE adapter (Mellanox ConnectX-4 EN)
– IO Bandwidth per server: 16GB/s, Network bandwidth 12.5GB/s
– IO Bandwidth per cluster: 480GB/s, Network bandwidth 375GB/s
• Totals per Cluster (counting 28 data nodes)
– 1,008 cores, 2,016 threads (hyperthreading)
– 42TB memory
– 448TB raw, 224 NVMe
“F1” Spark Platform Details
9
What about the Data Set?
• Desired Data Set / Data Generator Properties
– Realistic (we want to realistically exercise ML algorithms)
– Synthetic (no issues with data privacy/ownership)
– Scalable (desire to scale data volumes up/down)
– Source Available (to make changes)
• In particular we wanted to be able to “salt” the data (if needed)
• Selected Social Network Benchmark from LDBC
10
What is the LDBC?
+ non-profit members (FORTH) & personal members
+ Task Forces, volunteers developing benchmarks
+ TUC: Technical User Community
http://ldbcouncil.org
Linked Data Benchmark Council = LDBC
• Industry entity similar to TPC (www.tpc.org)
• Focusing on graph and RDF store benchmarking
11
LDBC benchmarks consist of..
• Four main elements:
– data schema: defines the structure of the data
– workloads: defines the set of operations to perform
– performance metrics: used to measure (quantitatively) the
performance of the systems
– execution rules: defined to assure that the results from
different executions of the benchmark are valid and
comparable
• Software as Open Source (GitHub)
– data generator, query drivers, validation tools, ...
12
Social Network Benchmark
www.cwi.nl/~boncz/graphta.ppt
Focus of our machine learning
13
Initial Focus Areas
• Prediction System Scalability
– Evaluate 6 different algorithms to determine which can best
predict interest in a “topic class”
• Recommendation System Scalability
– Collaborative Filtering using the ALS (Alternating Least Squares)
algorithm but evaluating multiple parameters each with multiple
values to recommend a topic to a person
• Using Watson Machine Learning with embedded
Cognitive Automation of Data Science (CADS)
14
Prediction Algorithms
• Goal: Given information about what “topic classes” a person is
known to be interested in, how well can we predict whether the
person will be interested in another topic class
• Algorithms competing
– Logistic Regression
– Support Vector Machine (SVMWithSGD)
– Decision Tree
– Random Forest
– Gradient-Boosted Trees
– Multilayer Perceptron
• Experiment: How well can we scale the evaluation of multiple
machine learning algorithms to reduce elapsed time?
15
Data Preparation for Prediction
Person.id Tag.id
1 6
1 138
1 523
1 573
1 576
1 775
1 777
1 973
2 3
… …
Table: person_hasInterest_tag
(generated, 98.4GB, 5.47 billion rows)
Tag.id TagClass.id
0 349
1 211
2 98
3 13
4 13
5 13
6 3
7 82
8 88
… …
Table: tag_hasType_tagclass
(generated, 145KB, 16080 rows)
Person.id TagClass.id
1 3
2 13
… …
Table: person_hasInterest_tagclass
(derived, 1.8 billion rows)
Person.id TagClass.id.0 TagClass.id.3 TagClass.id.13 … TagClass.id.115 … TagClass.id.355
1 0.0 1.0 0.0 … 0.0 … 0.0
2 0.0 0.0 1.0 … 0.0 … 0.0
… … … … … … … …
Replace “TagClass.id” column with
columns for each unique TagClass.id
(derived, 234 million rows, 63 columns,
30.1 GB CSV file stored on HDFS)
1
2
“distinct rows” join
on “Tag.id” column
Using the 100TB LDBC-SNB data set
16
Classification workload – Elapsed
time by cluster size
• We wanted to assess the scalability of the CADS algorithm using SparkML as we
increased the node count from 1 to 14
• Elapsed time was shortest with 4 Data Nodes (144 cores)
Spark tuning:
Executors per node: 36
Executor memory: 32GB
Executor cores: 2
Driver memory: 32GB
Driver cores: 4
17
Classification workload – Elapsed
time by cluster size
• Next, we assessed the scalability of the CADS algorithm using SparkML as we
increased the node count from 1 to 14, with a fixed number of Spark executors (144)
• With 144 Spark executors, elapsed time decreases as we add DataNodes
• Conclusion: Too many Spark executors can hurt performance
Spark tuning:
Executors: 144
Executor memory: 32GB
Executor cores: 2
Driver memory: 32GB
Driver cores: 4
18
Speeding up Algorithm Selection
• Here we compare CADS evaluating 6 classification algorithms individually (separate
Spark jobs), versus doing all 6 algorithms concurrently (single Spark job)
• Recommendation: Let CADS compare all algorithms at the same time
19
Recommendation Algorithm
• Goal: Given a matrix of people and topics and information
about which people like which topics can we recommend
other topics that they may be interested in?
• Algorithm chosen: ALS (Alternating Least Squares)
• Hyper-parameters
– Regularization Parameter (0.1, 0.01)
– Rank (5, 10)
– Alpha (1.0, 100.0)
• Experiment: How well can we parallelize and scale the
evaluation of the combinations of Hyper-parameter values of
ALS?
20
Data Preparation for ALS (1 of 2)
Id (type: Long) firstName lastName gender birthday creationDate locationIP browserUsed
933 Mahinda Perera male 1989-12-04 2010-03-17T23:32:10.447 192.248.2.123 Firefox
… … … … … … … …
35184381044707 Dặng Dinh Doan female 1981-08-22 2012-10-14T08:38:49.331 82.236.112.234 Chrome
… … … … … … … …
Id (type: Long) new_id (type : Int) firstName lastName gender birthday creationDate locationIP browserUsed
933 1 Mahinda Perera male 1989-12-04 2010-03-17T23:32:10.447 192.248.2.123 Firefox
… … … … … … … … …
35184381044707 8099641 Dặng Dinh Doan female 1981-08-22 2012-10-14T08:38:49.331 82.236.112.234 Chrome
… … … … … … … … …
Need ”Long” type to hold wide person id’s generated by LDBC-SNB data generator, but Spark MLlib
“Rating” class member “user” is of type Int. For compatibility to test the ALS algorithm with either
Spark MLlib or SparkML, we create an alternate id for each person stored as type Int.
Add alternate person id (type Int) that the ALS algorithm will use1
Table: person (generated, 747 MB, 8.1 million rows)
Using the 3TB LDBC-SNB data set
21
Data Preparation for ALS (2 of 2)
id new_id …
933 1 …
… … …
35184381044707 8099641 …
… … …
Table: person (with “new_id” added, 8.1 million rows)
Person.id Tag.id
933 6
933 138
933 523
933 573
933 576
933 775
933 777
933 787
933 973
… …
Table: person_hasInterest_tag
(generated, 3.39 GB, 189 million rows)
new_id Tag.id rating
1 6 1.0
1 138 1.0
1 523 1.0
1 573 1.0
1 576 1.0
1 775 1.0
1 777 1.0
1 787 1.0
1 973 1.0
… … …
Value in “rating” column is always 1.0
2 Join on “Person.id”,
add ”rating” column
Table: ratings (derived,189 million rows,
8.1 million distinct users, 16080 items,
3.3 GB CSV file stored on HDFS)
22
• We wanted to assess the scalability of CADS-HPO with the ALS algorithm
using SparkML as we increased the node count from 1 to 14
• Elapsed time was shortest with 14 Data Nodes
ALS hyper-parameter tuning – Elapsed
time by cluster size
Spark tuning:
Executors per node: 36
Executor memory: 32GB
Executor cores: 2
Driver memory: 32GB
Driver cores: 4
23
“Error” of competing ALS
hyper-parameter combinations
• Used error metric “root mean squared error” (RMSE), lower is better
– ALS-0, ALS-2, ALS-4, ALS-6 drop out first
– ALS-1, ALS-5 still left after Iter-4
CADS-HPO
Iteration
Percentage of
training data
Iter-0 10%
Iter-1 20%
Iter-2 40%
Iter-3 80%
Iter-4 100%
RegParam Rank Alpha
ALS-0 0.1 5 1.0
ALS-1 0.1 5 100.0
ALS-2 0.1 10 1.0
ALS-3 0.1 10 100.0
ALS-4 0.01 5 1.0
ALS-5 0.01 5 100.0
ALS-6 0.01 10 1.0
ALS-7 0.01 10 100.0 24
Future Work / Next Steps
• Retest as additional classification algorithms are added to
SparkML (e.g. Linear Support Vector Classifier)
• Develop additional SparkML scenarios using LDBC-SNB
• Continue exploring how to best tune SparkML algorithms
• Try Spark’s Dynamic Resource Allocation
• Evaluate automated feature selection
• Assess model evolution
• Optimize scoring performance
• Track Spark evolution
SPARK-13857 (Feature parity for ALS ML with MLLIB)
SPARK-14489 (RegressionEvaluator returns NaN for
ALS in Spark ml)
SPARK-19071 (Optimizations for ML Pipeline Tuning)
25
Summary & Conclusion
• Machine Learning Algorithm selection and tuning is
difficult and resource intensive
• Watson Machine Learning can make it easier
• A large computational cluster can accelerate high
quality model building
• We can leverage synthetic data generation
• A Spark-Optimized cluster can assist greatly
• There is LOTS more work to be done
26
Try Watson Machine Learning
http://datascience.ibm.com/features#machinelearning 27
Thank You.
Berni Schiefer
schiefer@ca.ibm.com
Training data volume and ALS
algorithm accuracy
• Asses impact of training data volume on ALS recommendation accuracy
• Accuracy improves as we increase the training data set size
Data Split:
60% training
20% validation
20% test
29

Practical Large Scale Experiences with Spark 2.0 Machine Learning: Spark Summit East talk by Berni Schiefer

  • 1.
    PRACTICAL LARGE SCALE EXPERIENCESWITH SPARK 2.1 MACHINE LEARNING Berni Schiefer IBM, Spark Technology Center
  • 2.
    Agenda • How IBMis leveraging SparkML • Our experimental environment – hardware and benchmark/workload • Focus areas for scalability exploration • Initial results • Future work 2
  • 3.
    Built-in learning to getstarted or go the distance with advanced tutorials Learn The best of open source and IBM value-add to create state-of-the-art data products Create Community and social features that provide meaningful collaboration Collaborate Sign up today! - http://datascience.ibm.com IBM Data Science Experience 3
  • 4.
    Pipeline Model The Machine LearningWorkflow retraining History Data Pipeline Model Feedback Data scoring monitoring Operational Data deploying redeploying Predictions Data Scientist ML Pipeline Data visualization Feature engineering Model training Model Evaluation Developer/ stackholder IBM Watson Machine Learning 4
  • 5.
    Key Model TrainingQuestions: • Which machine learning algorithm should I use? • For a chosen machine learning algorithm what hyper-parameters should be tuned? Explosive search space! 5
  • 6.
    © 2015 IBMCorporation Data Scientist Workflow With CADS 6 Science of Analytics Repository Deployed Analytic UserInterface(orREST-APIdirectly) 1 4 5 Deployed Analytic 62 LearningController Tactical Planner Orchestrator and Scheduler Learning Controller Analytic Monitoring and Adaptation Analytic Platforms Knowledge Acquisition External Knowledge about Analytics 3 AI technology automatically determines best analytics pipeline Data ScientistcaninteractwithSystem Cross-PlatformDeploymentandEvaluation Input: Supervisedprediction problem Submit to CADS …
  • 7.
    © 2015 IBMCorporation Model Selection via “Data Allocation using Upper Bounds (DAUB) “ 7 Logistic Regression A3 SVMRandom Forest … 500 500# Additional Data points ------------------ Built Model ------------------ Prediction Accuracy versus #Data Points TrainingData Ranking based on upper bound estimate on performance of each pipeline (‘slope’ of learning curve) https://arxiv.org/pdf /1601.00024.pdf 7
  • 8.
    Our “F1” SparkSQL Cluster • A 28-node cluster – 2 management nodes (co-exist with 2 data nodes) – 28 data nodes • Lenovo x3650 M5 – 2 sockets (18cores/socket) – 1.5TB RAM – 8x2TB SSD – 2 racks, • 20x 2U servers per rack (42U racks) – 1 switch, 100GbE, 32 ports, 1U • Mellanox SN2700 8
  • 9.
    • Each datanode – CPU: 2x E5-2697 v4 @ 2.3GHz (Broadwell) (18c) – Memory: 1.5TB per server 24x 64GB DDR4 2400MHz – Flash Storage: 8x 2TB SSD PCIe NVMe (Intel DC P3600), 16TB per server – Network: 100GbE adapter (Mellanox ConnectX-4 EN) – IO Bandwidth per server: 16GB/s, Network bandwidth 12.5GB/s – IO Bandwidth per cluster: 480GB/s, Network bandwidth 375GB/s • Totals per Cluster (counting 28 data nodes) – 1,008 cores, 2,016 threads (hyperthreading) – 42TB memory – 448TB raw, 224 NVMe “F1” Spark Platform Details 9
  • 10.
    What about theData Set? • Desired Data Set / Data Generator Properties – Realistic (we want to realistically exercise ML algorithms) – Synthetic (no issues with data privacy/ownership) – Scalable (desire to scale data volumes up/down) – Source Available (to make changes) • In particular we wanted to be able to “salt” the data (if needed) • Selected Social Network Benchmark from LDBC 10
  • 11.
    What is theLDBC? + non-profit members (FORTH) & personal members + Task Forces, volunteers developing benchmarks + TUC: Technical User Community http://ldbcouncil.org Linked Data Benchmark Council = LDBC • Industry entity similar to TPC (www.tpc.org) • Focusing on graph and RDF store benchmarking 11
  • 12.
    LDBC benchmarks consistof.. • Four main elements: – data schema: defines the structure of the data – workloads: defines the set of operations to perform – performance metrics: used to measure (quantitatively) the performance of the systems – execution rules: defined to assure that the results from different executions of the benchmark are valid and comparable • Software as Open Source (GitHub) – data generator, query drivers, validation tools, ... 12
  • 13.
  • 14.
    Initial Focus Areas •Prediction System Scalability – Evaluate 6 different algorithms to determine which can best predict interest in a “topic class” • Recommendation System Scalability – Collaborative Filtering using the ALS (Alternating Least Squares) algorithm but evaluating multiple parameters each with multiple values to recommend a topic to a person • Using Watson Machine Learning with embedded Cognitive Automation of Data Science (CADS) 14
  • 15.
    Prediction Algorithms • Goal:Given information about what “topic classes” a person is known to be interested in, how well can we predict whether the person will be interested in another topic class • Algorithms competing – Logistic Regression – Support Vector Machine (SVMWithSGD) – Decision Tree – Random Forest – Gradient-Boosted Trees – Multilayer Perceptron • Experiment: How well can we scale the evaluation of multiple machine learning algorithms to reduce elapsed time? 15
  • 16.
    Data Preparation forPrediction Person.id Tag.id 1 6 1 138 1 523 1 573 1 576 1 775 1 777 1 973 2 3 … … Table: person_hasInterest_tag (generated, 98.4GB, 5.47 billion rows) Tag.id TagClass.id 0 349 1 211 2 98 3 13 4 13 5 13 6 3 7 82 8 88 … … Table: tag_hasType_tagclass (generated, 145KB, 16080 rows) Person.id TagClass.id 1 3 2 13 … … Table: person_hasInterest_tagclass (derived, 1.8 billion rows) Person.id TagClass.id.0 TagClass.id.3 TagClass.id.13 … TagClass.id.115 … TagClass.id.355 1 0.0 1.0 0.0 … 0.0 … 0.0 2 0.0 0.0 1.0 … 0.0 … 0.0 … … … … … … … … Replace “TagClass.id” column with columns for each unique TagClass.id (derived, 234 million rows, 63 columns, 30.1 GB CSV file stored on HDFS) 1 2 “distinct rows” join on “Tag.id” column Using the 100TB LDBC-SNB data set 16
  • 17.
    Classification workload –Elapsed time by cluster size • We wanted to assess the scalability of the CADS algorithm using SparkML as we increased the node count from 1 to 14 • Elapsed time was shortest with 4 Data Nodes (144 cores) Spark tuning: Executors per node: 36 Executor memory: 32GB Executor cores: 2 Driver memory: 32GB Driver cores: 4 17
  • 18.
    Classification workload –Elapsed time by cluster size • Next, we assessed the scalability of the CADS algorithm using SparkML as we increased the node count from 1 to 14, with a fixed number of Spark executors (144) • With 144 Spark executors, elapsed time decreases as we add DataNodes • Conclusion: Too many Spark executors can hurt performance Spark tuning: Executors: 144 Executor memory: 32GB Executor cores: 2 Driver memory: 32GB Driver cores: 4 18
  • 19.
    Speeding up AlgorithmSelection • Here we compare CADS evaluating 6 classification algorithms individually (separate Spark jobs), versus doing all 6 algorithms concurrently (single Spark job) • Recommendation: Let CADS compare all algorithms at the same time 19
  • 20.
    Recommendation Algorithm • Goal:Given a matrix of people and topics and information about which people like which topics can we recommend other topics that they may be interested in? • Algorithm chosen: ALS (Alternating Least Squares) • Hyper-parameters – Regularization Parameter (0.1, 0.01) – Rank (5, 10) – Alpha (1.0, 100.0) • Experiment: How well can we parallelize and scale the evaluation of the combinations of Hyper-parameter values of ALS? 20
  • 21.
    Data Preparation forALS (1 of 2) Id (type: Long) firstName lastName gender birthday creationDate locationIP browserUsed 933 Mahinda Perera male 1989-12-04 2010-03-17T23:32:10.447 192.248.2.123 Firefox … … … … … … … … 35184381044707 Dặng Dinh Doan female 1981-08-22 2012-10-14T08:38:49.331 82.236.112.234 Chrome … … … … … … … … Id (type: Long) new_id (type : Int) firstName lastName gender birthday creationDate locationIP browserUsed 933 1 Mahinda Perera male 1989-12-04 2010-03-17T23:32:10.447 192.248.2.123 Firefox … … … … … … … … … 35184381044707 8099641 Dặng Dinh Doan female 1981-08-22 2012-10-14T08:38:49.331 82.236.112.234 Chrome … … … … … … … … … Need ”Long” type to hold wide person id’s generated by LDBC-SNB data generator, but Spark MLlib “Rating” class member “user” is of type Int. For compatibility to test the ALS algorithm with either Spark MLlib or SparkML, we create an alternate id for each person stored as type Int. Add alternate person id (type Int) that the ALS algorithm will use1 Table: person (generated, 747 MB, 8.1 million rows) Using the 3TB LDBC-SNB data set 21
  • 22.
    Data Preparation forALS (2 of 2) id new_id … 933 1 … … … … 35184381044707 8099641 … … … … Table: person (with “new_id” added, 8.1 million rows) Person.id Tag.id 933 6 933 138 933 523 933 573 933 576 933 775 933 777 933 787 933 973 … … Table: person_hasInterest_tag (generated, 3.39 GB, 189 million rows) new_id Tag.id rating 1 6 1.0 1 138 1.0 1 523 1.0 1 573 1.0 1 576 1.0 1 775 1.0 1 777 1.0 1 787 1.0 1 973 1.0 … … … Value in “rating” column is always 1.0 2 Join on “Person.id”, add ”rating” column Table: ratings (derived,189 million rows, 8.1 million distinct users, 16080 items, 3.3 GB CSV file stored on HDFS) 22
  • 23.
    • We wantedto assess the scalability of CADS-HPO with the ALS algorithm using SparkML as we increased the node count from 1 to 14 • Elapsed time was shortest with 14 Data Nodes ALS hyper-parameter tuning – Elapsed time by cluster size Spark tuning: Executors per node: 36 Executor memory: 32GB Executor cores: 2 Driver memory: 32GB Driver cores: 4 23
  • 24.
    “Error” of competingALS hyper-parameter combinations • Used error metric “root mean squared error” (RMSE), lower is better – ALS-0, ALS-2, ALS-4, ALS-6 drop out first – ALS-1, ALS-5 still left after Iter-4 CADS-HPO Iteration Percentage of training data Iter-0 10% Iter-1 20% Iter-2 40% Iter-3 80% Iter-4 100% RegParam Rank Alpha ALS-0 0.1 5 1.0 ALS-1 0.1 5 100.0 ALS-2 0.1 10 1.0 ALS-3 0.1 10 100.0 ALS-4 0.01 5 1.0 ALS-5 0.01 5 100.0 ALS-6 0.01 10 1.0 ALS-7 0.01 10 100.0 24
  • 25.
    Future Work /Next Steps • Retest as additional classification algorithms are added to SparkML (e.g. Linear Support Vector Classifier) • Develop additional SparkML scenarios using LDBC-SNB • Continue exploring how to best tune SparkML algorithms • Try Spark’s Dynamic Resource Allocation • Evaluate automated feature selection • Assess model evolution • Optimize scoring performance • Track Spark evolution SPARK-13857 (Feature parity for ALS ML with MLLIB) SPARK-14489 (RegressionEvaluator returns NaN for ALS in Spark ml) SPARK-19071 (Optimizations for ML Pipeline Tuning) 25
  • 26.
    Summary & Conclusion •Machine Learning Algorithm selection and tuning is difficult and resource intensive • Watson Machine Learning can make it easier • A large computational cluster can accelerate high quality model building • We can leverage synthetic data generation • A Spark-Optimized cluster can assist greatly • There is LOTS more work to be done 26
  • 27.
    Try Watson MachineLearning http://datascience.ibm.com/features#machinelearning 27
  • 28.
  • 29.
    Training data volumeand ALS algorithm accuracy • Asses impact of training data volume on ALS recommendation accuracy • Accuracy improves as we increase the training data set size Data Split: 60% training 20% validation 20% test 29