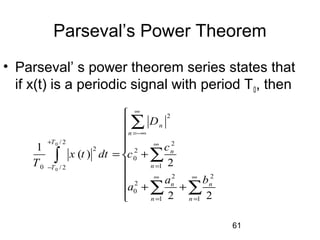
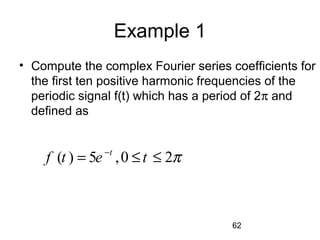
This document provides an introduction to signals and systems. It begins by classifying different types of signals as continuous-time/discrete-time, analog/digital, deterministic/random, periodic/aperiodic, power/energy. It then discusses representations of signals in the time and frequency domains, including the Fourier series representation of periodic signals. Key concepts covered include the unit step, rectangular, triangular and sinc functions, as well as signal operations like time shifting, scaling and inversion. The document concludes by introducing Parseval's theorem relating the power of a signal to the power of its Fourier coefficients.


![22
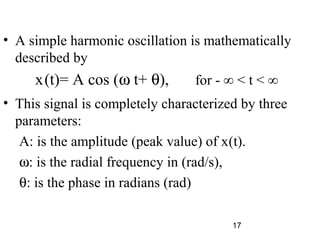
Exercise
• Determine whether the signals are power or
energy signals or neither
1) x(t)= u(t)
2) y(t)= A sin t
3) s(t)= t u(t)
4)z(t)=
5)
6)
)(tδ
( ) cos(10 ) ( )v t t u tπ=
( ) sin 2 [ ( ) ( 2 )]w t t u t u tπ π= − −](https://image.slidesharecdn.com/chapter2-130606133144-phpapp02/85/Chapter-2-22-320.jpg)


![42
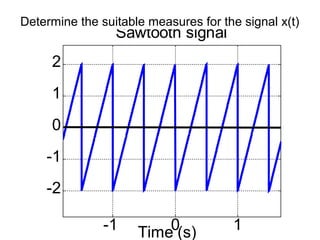
Inner product of signals
• Inner product of two complex signals x(t), y(t) over
the interval [t1,t2] is
If inner product=0, x(t), y(t) are orthogonal.
2
1
( ( ), ( )) ( ) ( )
t
t
x t y t x t y t dt∗
= ∫](https://image.slidesharecdn.com/chapter2-130606133144-phpapp02/85/Chapter-2-42-320.jpg)
![43
Inner product cont.
• The approximation of x(t) by y(t) over the interval
is given by
• The optimum value of the constant C that minimize
the energy of the error signal
is given by
( ) ( ) ( )e t x t cy t= −
2
1
1
( ) ( )
t
y t
C x t y t dt
E
= ∫
1 2[ , ]t t
( ) ( )x t cy t=](https://image.slidesharecdn.com/chapter2-130606133144-phpapp02/85/Chapter-2-43-320.jpg)


![65
Classification of systems
• Linear and non-linear:
-linear :if system i/o satisfies the superposition
principle. i.e.
1 2 1 2
1 1
2 2
[ ( ) ( )] ( ) ( )
where ( ) [ ( )]
and ( ) [ ( )]
F ax t bx t ay t by t
y t F x t
y t F x t
+ = +
=
=](https://image.slidesharecdn.com/chapter2-130606133144-phpapp02/85/Chapter-2-65-320.jpg)
![66
Classification of sys. Cont.
• Time-shift invariant and time varying
-invariant: delay i/p by the o/p delayed by same a
mount. i.e
0 0
if ( ) [ ( )]
then ( ) [ ( )]
y t F x t
y t t F x t t
=
− = −
0t](https://image.slidesharecdn.com/chapter2-130606133144-phpapp02/85/Chapter-2-66-320.jpg)
![67
Classification of sys. Cont.
• Causal and non-causal system
-causal: if the o/p at t=t0 only depends on the present
and previous values of the i/p. i.e
LTI system is causal if its impulse response is causal.
i.e.
0 0( ) [ ( ), ]y t F x t t t= ≤
( ) 0, 0h t t= ∀ p](https://image.slidesharecdn.com/chapter2-130606133144-phpapp02/85/Chapter-2-67-320.jpg)