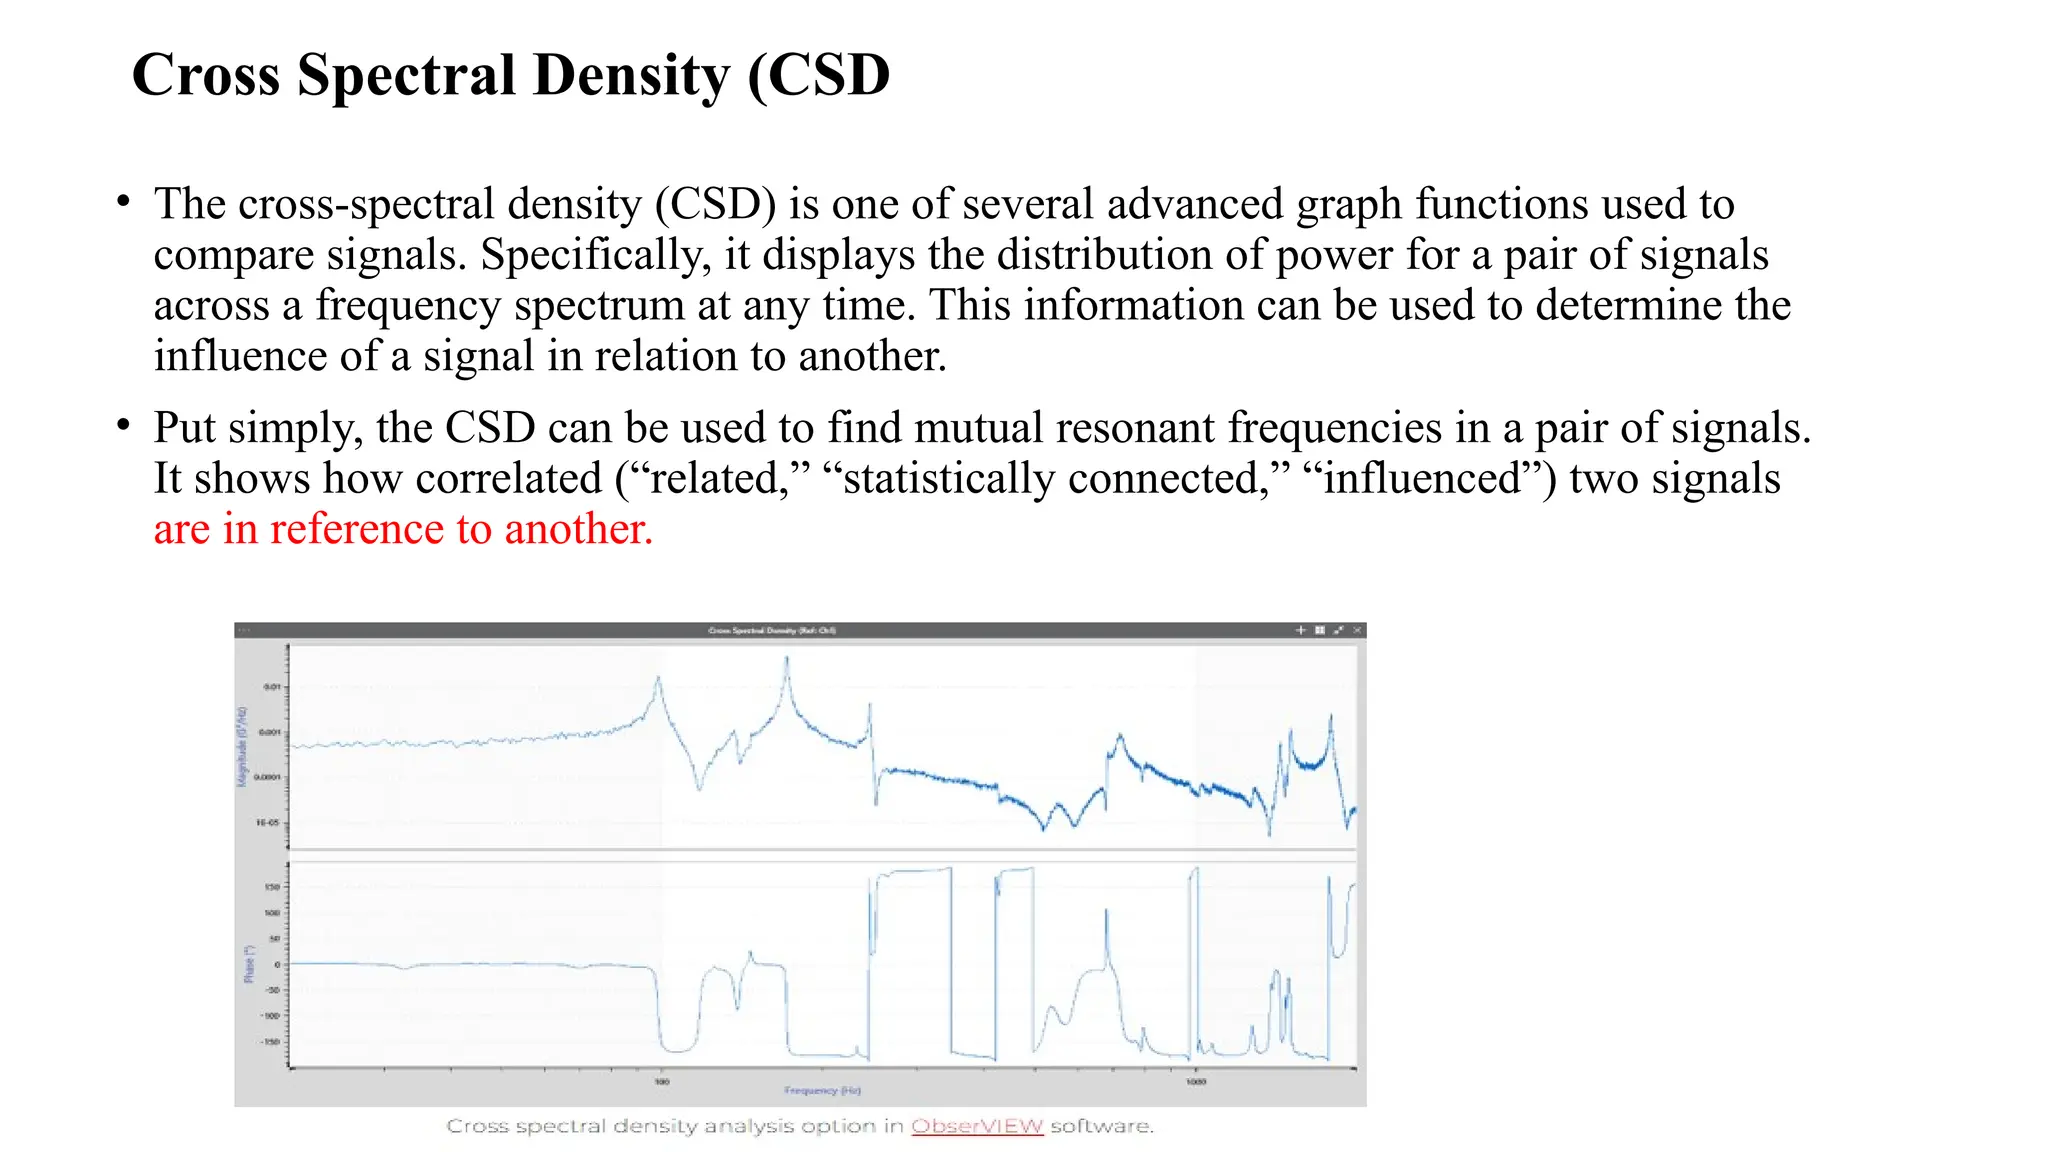
Course name:
probability and Random process
Chapter 7.
Spectral Estimation
Eng. Abdirahman Farah Ali
c.raxmaanfc@gmail.com
• Spectral estimation is a technique used to estimate the frequency content of a signal. It is
widely used in various fields such as signal processing, communications, and control
systems. The frequency content of a signal is referred to as its spectrum, which provides
valuable information about the underlying physical process that generated the signal.
Methods for Spectral Estimation
• Periodogram: Simplest and most commonly used method
• Welch Method: Divides signal into overlapping segments and averages periodograms
• Blackman-Tukey Method: Computes autocorrelation function
and DFT of autocorrelation function
• Maximum Entropy Method: Finds spectrum with maximum entropy subject to
constraints
• Choice of method depends on signal characteristics and application
• Factors that affect accuracy include signal length, window function, and noise level
The power spectrum reveals the existence, or the absence, of repetitive patterns and
correlation structures in a signal process. These structural patterns are important in a wide
range of applications such as data forecasting, signal coding, signal detection, radar, pattern
recognition, and decision-making systems.
• The most common method of spectral estimation is based on the fast Fourier transform
(FFT). For many applications, FFT-based methods produce sufficiently good results.
However, more advanced methods of spectral estimation can offer better frequency
resolution, and less variance.
• This chapter begins with an introduction to the Fourier series and transform and the basic
principles of spectral estimation. The classical methods for power spectrum estimation are
based on periodograms.
• A periodogram is an estimate of the spectral density of a signal.
• Various methods of averaging periodograms, and their effects on the variance of spectral
estimates, are considered.
• maximum entropy and the model-based spectral estimation methods.
There are several high-resolution spectral estimation methods, based on eigen-analysis, for
the estimation of sinusoids observed in additive white noise.
Fourier transform
• The Fourier transform is a mathematical tool that is used to represent a signal in the
frequency domain. It decomposes a signal into a series of complex exponential
functions of different frequencies, which allows us to analyze the frequency content of the
signal.
• Spectral estimation techniques, such as the periodogram and Welch method, are based on
the Fourier transform. In fact, the periodogram is essentially the magnitude squared of
the discrete Fourier transform (DFT) of the signal. The Fourier transform is a powerful
tool in signal processing and is widely used in various applications such as audio
and image processing, communications, and control systems.
Fourier Transform
• The Fourier Transform is a mathematical technique that transforms a function of time, x(t), to a function of
frequency, X(ω). It is closely related to the Fourier Series. If you are familiar with the Fourier Series, the
following derivation may be helpful. If you are only interested in the mathematical statement of transform.
• The Fourier Transform of a function can be derived as a special case of the Fourier Series when the
period, T→∞ (Note: this derivation is performed in more detail elsewhere). Start with the Fourier Series
synthesis equation.
• where cn is given by the Fourier Series analysis equation,
which can be rewritten
• The power spectrum of a signal gives the distribution of the signal power among various
frequencies. The power spectrum is the Fourier transform of the correlation function, and
reveals information on the correlation structure of the signal.
• The strength of the Fourier transform in signal analysis and pattern recognition is its ability to
reveal spectral structures that may be used to characterize a signal.
• This is illustrated in Figure 9.1 for the two extreme cases of a sine wave and a purely random
signal. For a periodic signal, the power is concentrated in extremely narrow bands of
frequencies, indicating the existence of structure and the predictable character of the signal.
• In the case of a pure sine wave as shown in Figure 9.1(a) the signal power is concentrated in
one frequency. For a purely random signal as shown in Figure 9.1(b) the signal power is spread
equally in the frequency domain, indicating the lack of structure in the signal.
Figure 9.1 The concentration/spread of
power in frequency indicates the correlated
or random character of a signal: (a) a
predictable signal, (b) a random signal.
• In general, the more correlated or predictable a signal, the more
concentrated its power spectrum, and conversely the more random or
unpredictable a signal, the more spread its power spectrum.
• Therefore the power spectrum of a signal can be used to deduce the
existence of repetitive structures or correlated patterns in the signal process.
• Such information is crucial in detection, decision making and estimation
problems, and in systems analysis.
White noise
• People often think of white noise as television static, or the serene sounds of rainfall and
crashing ocean waves. But physicists and sound technicians use a much more specific
definition.
• White noise is random noise that has a flat spectral density — that is, the noise has the
same amplitude, or intensity, throughout the audible frequency range (20 to 20,000 hertz).
White noise is so named because it's analogous to white light, which is a mixture of all
visible wavelengths of light.
• Since it includes all audible frequencies, white noise is often used to mask other sounds.
For example, some people use white noise machines as sleep aids to drown out annoying
noises in the environment.
• White noise can be generated artificially or occur naturally in the environment.
• The sound of steady rain falling is a type of white noise, as is the hum of a large crowd of
fans in a football stadium. If you use the whir of a fan or an air conditioner to fall asleep
or sleep more soundly, that's also white noise.
• White noise is a low, humming sound that results from many combined frequencies. There
are machines that create white noise to help people sleep, and there are also many
examples in nature, like the repetitive crashing of ocean waves.
• If you use the whir of a fan or an air conditioner to fall asleep or sleep more soundly,
that's also white noise. In physics, white noise is a signal created by several frequencies
with the same intensity. The term comes from white light, which is created by combining
different colors.
Cross Spectral Density (CSD
• The cross-spectral density (CSD) is one of several advanced graph functions used to
compare signals. Specifically, it displays the distribution of power for a pair of signals
across a frequency spectrum at any time. This information can be used to determine the
influence of a signal in relation to another.
• Put simply, the CSD can be used to find mutual resonant frequencies in a pair of signals.
It shows how correlated (“related,” “statistically connected,” “influenced”) two signals
are in reference to another.
Key Takeaways
• There are several ways to compare two signals, but comparisons should be based
on concrete analysis rather than graphical methods.
• Cross spectral density is a method for comparing the power spectra for two
signals.
• Cross spectral density is also related to other signal comparison metrics, and
signal processing engineers should understand which metrics are best to use in
different situations.
Spectral Estimation in Engineering
• Provides a way to analyze the frequency content of signals
• Essential for signal analysis, signal processing, communications, and control systems
• Used to identify system parameters, detect anomalies, and classify signals
• Plays a crucial role in communication systems for allocating frequency bands and
minimizing interference
• Used in control systems to analyze the frequency response of a system and design control
systems that meet performance specifications
References
• http://dsp-book.narod.ru/302.pdf
• For more information click the above link
• End

Chapter_07 Spectral Estimation .pptx

  • 1.
    Course name: probability andRandom process Chapter 7. Spectral Estimation Eng. Abdirahman Farah Ali c.raxmaanfc@gmail.com
  • 2.
    • Spectral estimationis a technique used to estimate the frequency content of a signal. It is widely used in various fields such as signal processing, communications, and control systems. The frequency content of a signal is referred to as its spectrum, which provides valuable information about the underlying physical process that generated the signal.
  • 3.
    Methods for SpectralEstimation • Periodogram: Simplest and most commonly used method • Welch Method: Divides signal into overlapping segments and averages periodograms • Blackman-Tukey Method: Computes autocorrelation function and DFT of autocorrelation function • Maximum Entropy Method: Finds spectrum with maximum entropy subject to constraints • Choice of method depends on signal characteristics and application • Factors that affect accuracy include signal length, window function, and noise level
  • 4.
    The power spectrumreveals the existence, or the absence, of repetitive patterns and correlation structures in a signal process. These structural patterns are important in a wide range of applications such as data forecasting, signal coding, signal detection, radar, pattern recognition, and decision-making systems. • The most common method of spectral estimation is based on the fast Fourier transform (FFT). For many applications, FFT-based methods produce sufficiently good results. However, more advanced methods of spectral estimation can offer better frequency resolution, and less variance.
  • 5.
    • This chapterbegins with an introduction to the Fourier series and transform and the basic principles of spectral estimation. The classical methods for power spectrum estimation are based on periodograms. • A periodogram is an estimate of the spectral density of a signal. • Various methods of averaging periodograms, and their effects on the variance of spectral estimates, are considered. • maximum entropy and the model-based spectral estimation methods. There are several high-resolution spectral estimation methods, based on eigen-analysis, for the estimation of sinusoids observed in additive white noise.
  • 6.
    Fourier transform • TheFourier transform is a mathematical tool that is used to represent a signal in the frequency domain. It decomposes a signal into a series of complex exponential functions of different frequencies, which allows us to analyze the frequency content of the signal. • Spectral estimation techniques, such as the periodogram and Welch method, are based on the Fourier transform. In fact, the periodogram is essentially the magnitude squared of the discrete Fourier transform (DFT) of the signal. The Fourier transform is a powerful tool in signal processing and is widely used in various applications such as audio and image processing, communications, and control systems.
  • 7.
    Fourier Transform • TheFourier Transform is a mathematical technique that transforms a function of time, x(t), to a function of frequency, X(ω). It is closely related to the Fourier Series. If you are familiar with the Fourier Series, the following derivation may be helpful. If you are only interested in the mathematical statement of transform. • The Fourier Transform of a function can be derived as a special case of the Fourier Series when the period, T→∞ (Note: this derivation is performed in more detail elsewhere). Start with the Fourier Series synthesis equation. • where cn is given by the Fourier Series analysis equation, which can be rewritten
  • 8.
    • The powerspectrum of a signal gives the distribution of the signal power among various frequencies. The power spectrum is the Fourier transform of the correlation function, and reveals information on the correlation structure of the signal. • The strength of the Fourier transform in signal analysis and pattern recognition is its ability to reveal spectral structures that may be used to characterize a signal. • This is illustrated in Figure 9.1 for the two extreme cases of a sine wave and a purely random signal. For a periodic signal, the power is concentrated in extremely narrow bands of frequencies, indicating the existence of structure and the predictable character of the signal. • In the case of a pure sine wave as shown in Figure 9.1(a) the signal power is concentrated in one frequency. For a purely random signal as shown in Figure 9.1(b) the signal power is spread equally in the frequency domain, indicating the lack of structure in the signal. Figure 9.1 The concentration/spread of power in frequency indicates the correlated or random character of a signal: (a) a predictable signal, (b) a random signal.
  • 9.
    • In general,the more correlated or predictable a signal, the more concentrated its power spectrum, and conversely the more random or unpredictable a signal, the more spread its power spectrum. • Therefore the power spectrum of a signal can be used to deduce the existence of repetitive structures or correlated patterns in the signal process. • Such information is crucial in detection, decision making and estimation problems, and in systems analysis.
  • 10.
    White noise • Peopleoften think of white noise as television static, or the serene sounds of rainfall and crashing ocean waves. But physicists and sound technicians use a much more specific definition. • White noise is random noise that has a flat spectral density — that is, the noise has the same amplitude, or intensity, throughout the audible frequency range (20 to 20,000 hertz). White noise is so named because it's analogous to white light, which is a mixture of all visible wavelengths of light. • Since it includes all audible frequencies, white noise is often used to mask other sounds. For example, some people use white noise machines as sleep aids to drown out annoying noises in the environment. • White noise can be generated artificially or occur naturally in the environment.
  • 11.
    • The soundof steady rain falling is a type of white noise, as is the hum of a large crowd of fans in a football stadium. If you use the whir of a fan or an air conditioner to fall asleep or sleep more soundly, that's also white noise. • White noise is a low, humming sound that results from many combined frequencies. There are machines that create white noise to help people sleep, and there are also many examples in nature, like the repetitive crashing of ocean waves. • If you use the whir of a fan or an air conditioner to fall asleep or sleep more soundly, that's also white noise. In physics, white noise is a signal created by several frequencies with the same intensity. The term comes from white light, which is created by combining different colors.
  • 12.
    Cross Spectral Density(CSD • The cross-spectral density (CSD) is one of several advanced graph functions used to compare signals. Specifically, it displays the distribution of power for a pair of signals across a frequency spectrum at any time. This information can be used to determine the influence of a signal in relation to another. • Put simply, the CSD can be used to find mutual resonant frequencies in a pair of signals. It shows how correlated (“related,” “statistically connected,” “influenced”) two signals are in reference to another.
  • 13.
    Key Takeaways • Thereare several ways to compare two signals, but comparisons should be based on concrete analysis rather than graphical methods. • Cross spectral density is a method for comparing the power spectra for two signals. • Cross spectral density is also related to other signal comparison metrics, and signal processing engineers should understand which metrics are best to use in different situations.
  • 14.
    Spectral Estimation inEngineering • Provides a way to analyze the frequency content of signals • Essential for signal analysis, signal processing, communications, and control systems • Used to identify system parameters, detect anomalies, and classify signals • Plays a crucial role in communication systems for allocating frequency bands and minimizing interference • Used in control systems to analyze the frequency response of a system and design control systems that meet performance specifications
  • 15.
    References • http://dsp-book.narod.ru/302.pdf • Formore information click the above link
  • 16.

Editor's Notes

  • #4 What are some examples of correlation? More examples of positive correlations include: The more time you spend running on a treadmill, the more calories you will burn. The longer your hair grows, the more shampoo you will need. The more money you save, the more financially secure you feel. As the temperature goes up, ice cream sales also go up.