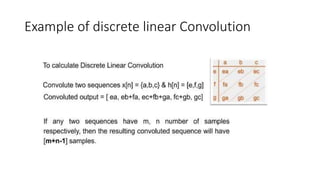
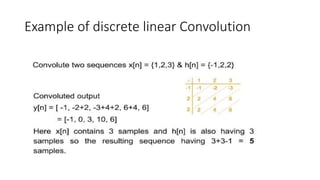
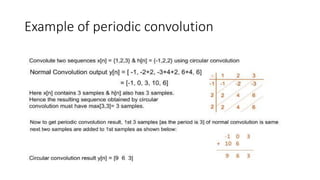
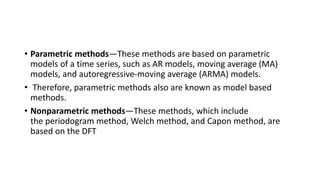
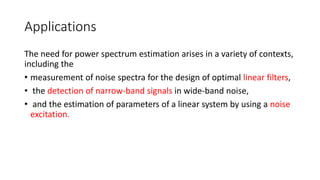
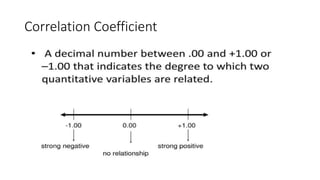
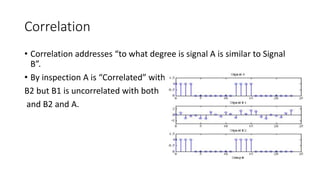
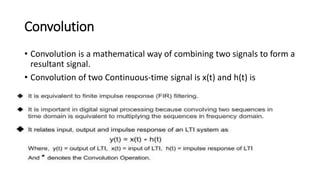
Data Compression
Techniques
Module 3
• Definition: Correlation relates to what degree a relationship exist
between 2 or more variables.
Two types:
• Cross correlation
• Auto correlation
• Correlation index is 1 or -1
Data sets showing different directions and
degrees of correlation
Purpose of correlation
Correlation Coefficient
Correlation
• Correlation addresses “to what degree is signal A is similar to Signal
B”.
• By inspection A is “Correlated” with
B2 but B1 is uncorrelated with both
and B2 and A.
• Correlation XCORR
• Xcorr(a,b);
• Xcorr(a,a);
• Where a=1,2,3,4;
• b= 2,4,1,3 ;
Convolution
• Convolution is a mathematical way of combining two signals to form a
resultant signal.
• Convolution of two Continuous-time signal is x(t) and h(t) is
Discrete Convolution
• For LTI system, if the input sequence is x(n) and impulse response
h(n), the output y(n) can be found
• This is known as convolution sum and is represented as
• Y(n)=x(n)*h(n) = h(n)* x(n)
Properties of Convolution
• Commutative
It states that order of convolution does not matter, which can be shown mathematically as
x1(t)∗x2(t)=x2(t)∗x1(t)
• Associative
It states that order of convolution involving three signals, can be anything. Mathematically, it
can be shown as;
x1(t)∗[x2(t)∗x3(t)]=[x1(t)∗x2(t)]∗x3(t)
• Distributive
x1(t)∗[x2(t)+x3(t)]=[x1(t)∗x2(t)+x1(t)∗x3(t)]
Example of discrete linear Convolution
Periodic Convolution
Example of periodic convolution
Applications of Convolution
• These two applications are:
1. Characterizing a linear time-invariant (LTI) system in terms of its
transfer function
2. Determining the output of an LTI system when its input is known
3. FIR filter design
Power Spectrum Estimation
• A power spectrum describes the energy distribution of a time series
in the frequency domain.
• Energy is a real-valued quantity, so the power spectrum does not
contain phase information.
• Because a time series may contain non-periodic or asynchronously-
sampled periodic signal components, the power spectrum of a time
series typically is considered to be a continuous function of
frequency.
• WHAT IS A SPECTRUM?
• A spectrum is a relationship typically represented by a plot of the
magnitude or relative value of some parameter against frequency.
• Every physical phenomenon, whether it be an electromagnetic,
thermal, mechanical, hydraulic or any other system, has a unique
spectrum associated with it.
• A study of relationships between the time domain and its
corresponding frequency domain representation is the subject of
Fourier analysis and Fourier transforms.
• The PSD measures the signal power per unit bandwidth for a time
series.
• PSD estimation methods are classified as follows:
• Parametric methods
• Nonparametric methods
• Parametric methods—These methods are based on parametric
models of a time series, such as AR models, moving average (MA)
models, and autoregressive-moving average (ARMA) models.
• Therefore, parametric methods also are known as model based
methods.
• Nonparametric methods—These methods, which include
the periodogram method, Welch method, and Capon method, are
based on the DFT
• Autoregressive spectrum estimation:
• A. The autocorrelation method
• B. The covariance method
• C. Modified covariance method
• D. Burg algorithm:
• E. Selection of the model order:
SPECTRAL ESTIMATION BY AVERAGING PERIODOGRAMS:
• It was shown in the last section that the periodogram was not a
consistent estimate of the power spectral density function.
• A technique introduced by Bartlett, however, allows the use of the
periodogram and, in fact, produces a consistent spectral estimation
by averaging periodograms.
• A periodogram is used to identify the dominant periods (or
frequencies) of a time series. This can be a helpful tool for
identifying the dominant cyclical behavior in a series,
particularly when the cycles are not related to the commonly
encountered monthly or quarterly seasonality.
Applications
The need for power spectrum estimation arises in a variety of contexts,
including the
• measurement of noise spectra for the design of optimal linear filters,
• the detection of narrow-band signals in wide-band noise,
• and the estimation of parameters of a linear system by using a noise
excitation.

Module_3_Data Compression Techniques.pptx

  • 1.
  • 2.
    • Definition: Correlationrelates to what degree a relationship exist between 2 or more variables. Two types: • Cross correlation • Auto correlation • Correlation index is 1 or -1
  • 4.
    Data sets showingdifferent directions and degrees of correlation
  • 5.
  • 6.
  • 7.
    Correlation • Correlation addresses“to what degree is signal A is similar to Signal B”. • By inspection A is “Correlated” with B2 but B1 is uncorrelated with both and B2 and A.
  • 8.
    • Correlation XCORR •Xcorr(a,b); • Xcorr(a,a); • Where a=1,2,3,4; • b= 2,4,1,3 ;
  • 9.
    Convolution • Convolution isa mathematical way of combining two signals to form a resultant signal. • Convolution of two Continuous-time signal is x(t) and h(t) is
  • 10.
    Discrete Convolution • ForLTI system, if the input sequence is x(n) and impulse response h(n), the output y(n) can be found • This is known as convolution sum and is represented as • Y(n)=x(n)*h(n) = h(n)* x(n)
  • 11.
    Properties of Convolution •Commutative It states that order of convolution does not matter, which can be shown mathematically as x1(t)∗x2(t)=x2(t)∗x1(t) • Associative It states that order of convolution involving three signals, can be anything. Mathematically, it can be shown as; x1(t)∗[x2(t)∗x3(t)]=[x1(t)∗x2(t)]∗x3(t) • Distributive x1(t)∗[x2(t)+x3(t)]=[x1(t)∗x2(t)+x1(t)∗x3(t)]
  • 12.
    Example of discretelinear Convolution
  • 13.
    Example of discretelinear Convolution
  • 14.
  • 15.
  • 16.
    Applications of Convolution •These two applications are: 1. Characterizing a linear time-invariant (LTI) system in terms of its transfer function 2. Determining the output of an LTI system when its input is known 3. FIR filter design
  • 17.
    Power Spectrum Estimation •A power spectrum describes the energy distribution of a time series in the frequency domain. • Energy is a real-valued quantity, so the power spectrum does not contain phase information. • Because a time series may contain non-periodic or asynchronously- sampled periodic signal components, the power spectrum of a time series typically is considered to be a continuous function of frequency.
  • 18.
    • WHAT ISA SPECTRUM? • A spectrum is a relationship typically represented by a plot of the magnitude or relative value of some parameter against frequency. • Every physical phenomenon, whether it be an electromagnetic, thermal, mechanical, hydraulic or any other system, has a unique spectrum associated with it. • A study of relationships between the time domain and its corresponding frequency domain representation is the subject of Fourier analysis and Fourier transforms.
  • 20.
    • The PSDmeasures the signal power per unit bandwidth for a time series. • PSD estimation methods are classified as follows: • Parametric methods • Nonparametric methods
  • 21.
    • Parametric methods—Thesemethods are based on parametric models of a time series, such as AR models, moving average (MA) models, and autoregressive-moving average (ARMA) models. • Therefore, parametric methods also are known as model based methods. • Nonparametric methods—These methods, which include the periodogram method, Welch method, and Capon method, are based on the DFT
  • 22.
    • Autoregressive spectrumestimation: • A. The autocorrelation method • B. The covariance method • C. Modified covariance method • D. Burg algorithm: • E. Selection of the model order:
  • 23.
    SPECTRAL ESTIMATION BYAVERAGING PERIODOGRAMS: • It was shown in the last section that the periodogram was not a consistent estimate of the power spectral density function. • A technique introduced by Bartlett, however, allows the use of the periodogram and, in fact, produces a consistent spectral estimation by averaging periodograms. • A periodogram is used to identify the dominant periods (or frequencies) of a time series. This can be a helpful tool for identifying the dominant cyclical behavior in a series, particularly when the cycles are not related to the commonly encountered monthly or quarterly seasonality.
  • 25.
    Applications The need forpower spectrum estimation arises in a variety of contexts, including the • measurement of noise spectra for the design of optimal linear filters, • the detection of narrow-band signals in wide-band noise, • and the estimation of parameters of a linear system by using a noise excitation.