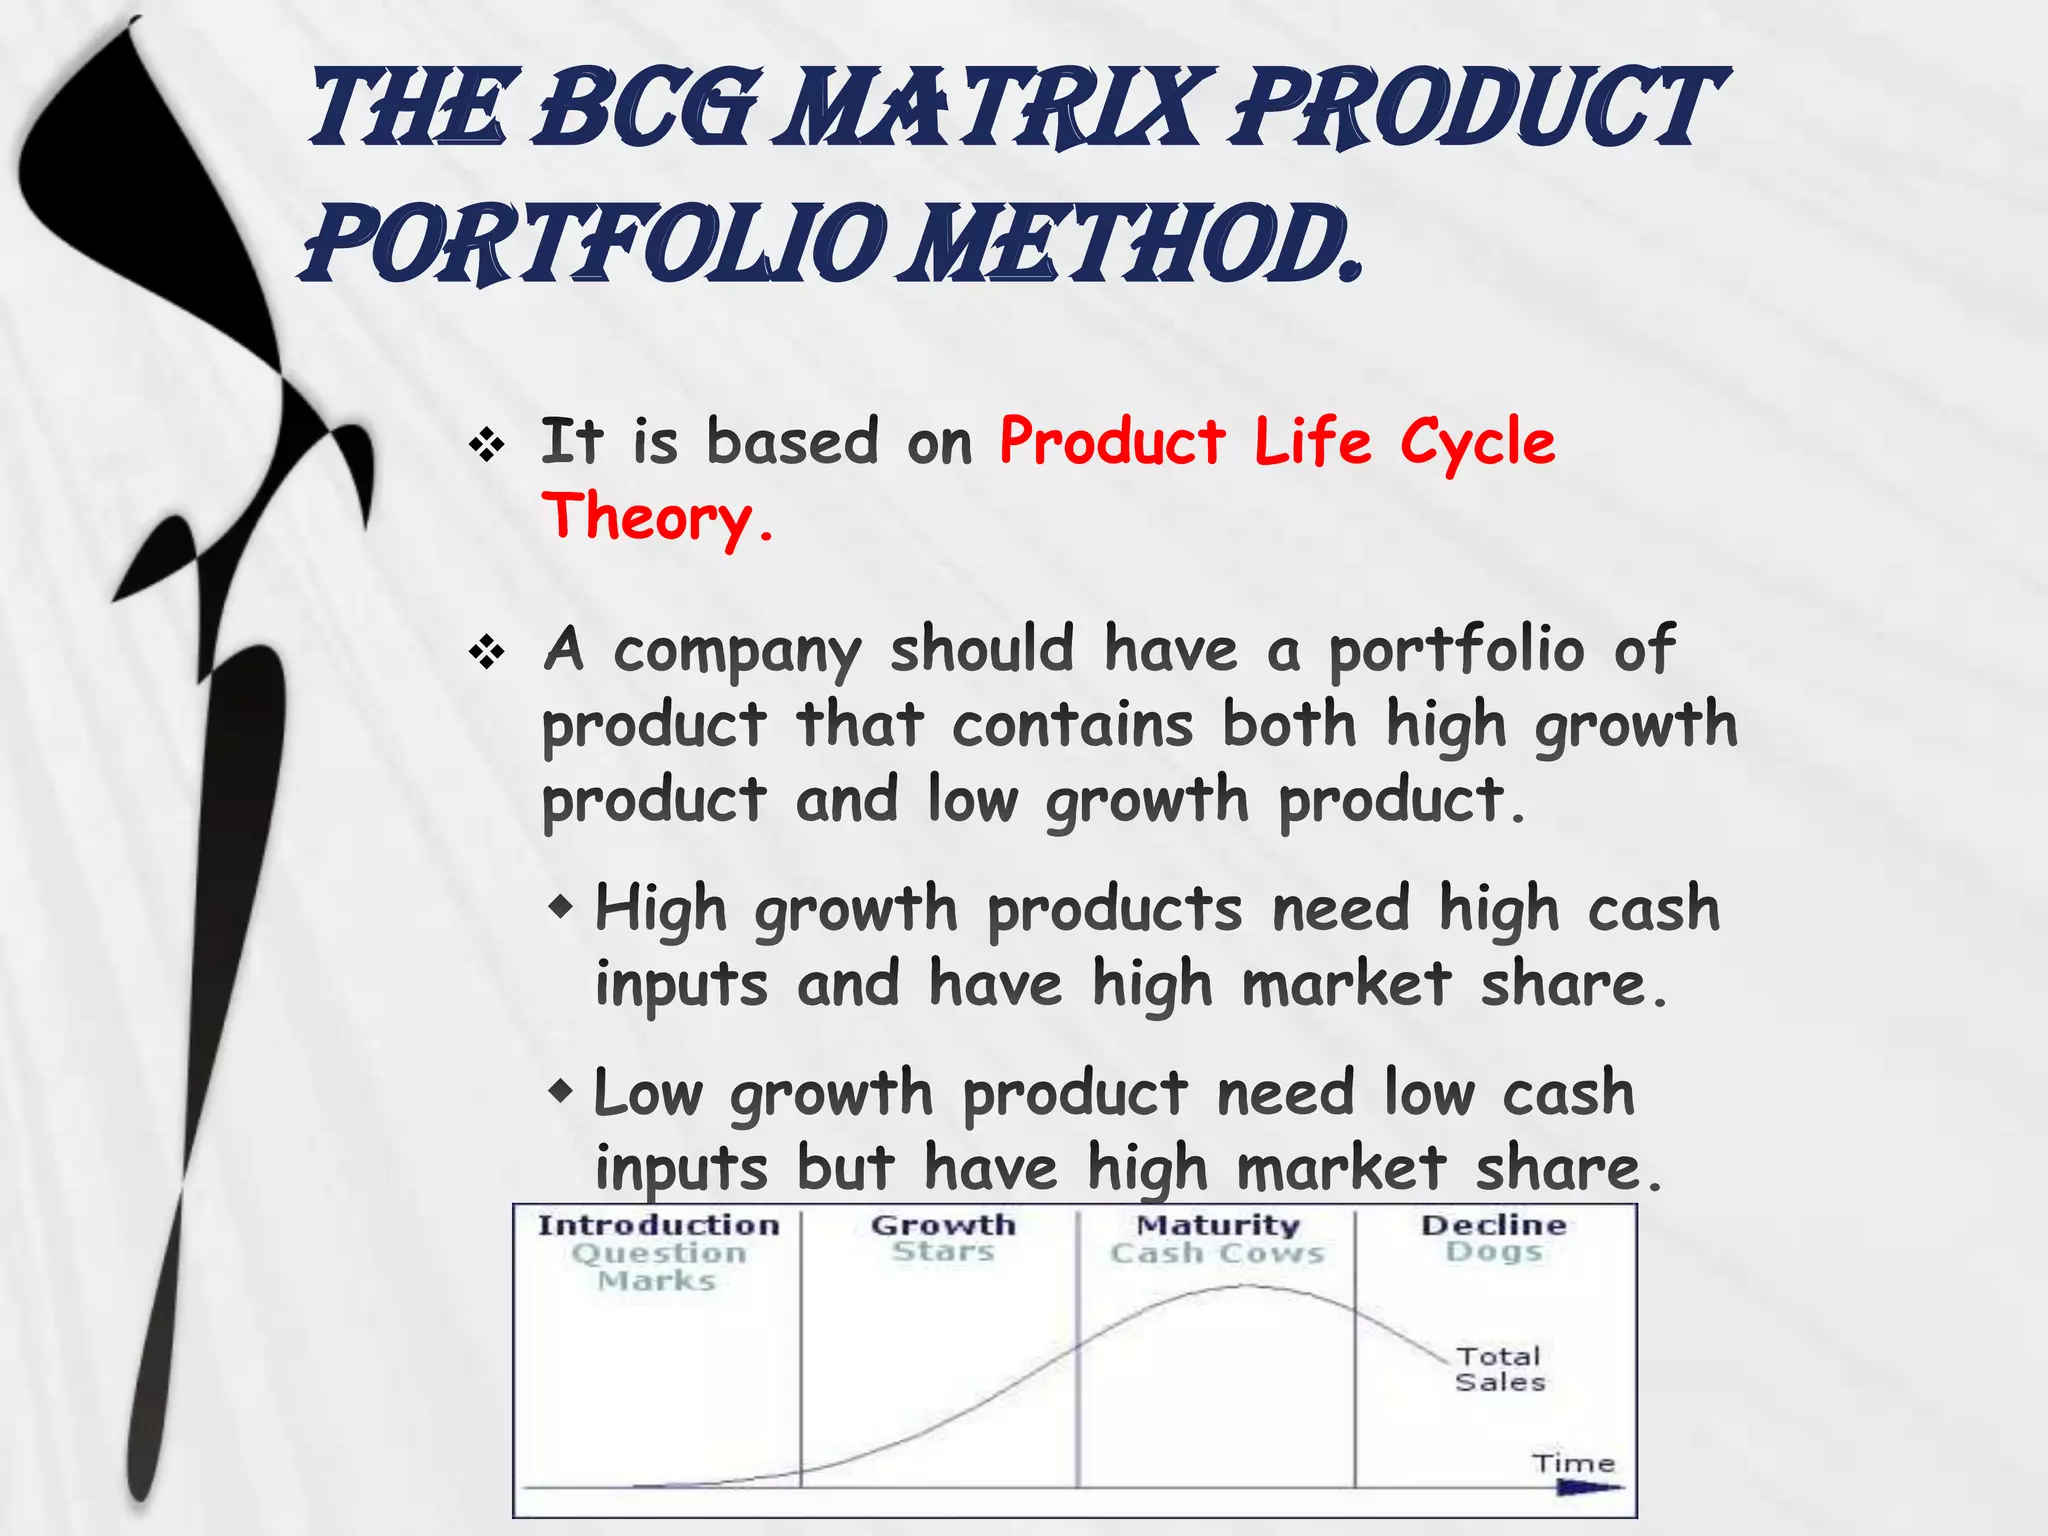
Portfolio matrix


     Submitted
       By-:      Janardan Tiwari.
                 • Nijo Ninan.
CONTENT
  

  

  

  

  

  
Portfolio
 


 
Why portfolio….
  


  

  

  

  
When portfolio….
  


  


  
Techniques of portfolio

Techniques                 Short Description
                           • Based on a graphical representation.
2D and 3D matrices         •Preference is given to those variables
                           which are most important to the
                           decision-maker


                           • Based on complex mathematical
                           Algorithms.
Mathematical programming   • Need computer support.

                           • Methods like decision tress and
Others                     others
The BCG Matrix Product
Portfolio Method.
               Product Life Cycle
      Theory.

  
THE BCG GROWTH-SHARE
MATRIX
    It is a portfolio planning model which is based on
     the observation that a company’s business units can
     be classified in to four categories:
     Stars
     Question marks
     Cash cows
     Dogs


    It is based on the combination of market growth
     and market share relative to the next best
     competitor.
Placing product in BCG
Matrix
  
STARS




     Attempts should be made to hold the
      market share otherwise the star will
      become a CASH COW
CASH COWS




     They are located in an industry that
    is mature, not growing or declining.
DOGS



     Dogs do not have potential to bring in
      much cash.
Question Marks


High
BUSINESS GROWTH RATE


                       Low


                              HIGH                  LOW
                                     MARKET SHARE
liMitAtionS…
     BCG MATRIX uses only two
      dimensions, “Relative Market” share
      and “Market Growth rate”.
     Problems of getting data on market
      share and market growth.
     High market share does not mean
      profits all the time.
     Business with low market
       share can be profitable too.
Portfolio Matrix

Portfolio Matrix

  • 1.
    Portfolio matrix Submitted By-: Janardan Tiwari. • Nijo Ninan.
  • 2.
    CONTENT      
  • 3.
  • 4.
    Why portfolio….     
  • 5.
  • 6.
    Techniques of portfolio Techniques Short Description • Based on a graphical representation. 2D and 3D matrices •Preference is given to those variables which are most important to the decision-maker • Based on complex mathematical Algorithms. Mathematical programming • Need computer support. • Methods like decision tress and Others others
  • 7.
    The BCG MatrixProduct Portfolio Method.  Product Life Cycle Theory. 
  • 8.
    THE BCG GROWTH-SHARE MATRIX  It is a portfolio planning model which is based on the observation that a company’s business units can be classified in to four categories:  Stars  Question marks  Cash cows  Dogs  It is based on the combination of market growth and market share relative to the next best competitor.
  • 9.
    Placing product inBCG Matrix 
  • 10.
    STARS   Attempts should be made to hold the market share otherwise the star will become a CASH COW
  • 11.
    CASH COWS  They are located in an industry that is mature, not growing or declining.
  • 12.
    DOGS   Dogs do not have potential to bring in much cash.
  • 13.
  • 14.
    High BUSINESS GROWTH RATE Low HIGH LOW MARKET SHARE
  • 15.
    liMitAtionS…  BCG MATRIX uses only two dimensions, “Relative Market” share and “Market Growth rate”.  Problems of getting data on market share and market growth.  High market share does not mean profits all the time.  Business with low market share can be profitable too.

Editor's Notes

  • #4 BOSTON CONSULTING GROUP (BCG) MATRIX is developed by “BRUCE HENDERSON “of the BOSTON CONSULTING GROUP IN THE EARLY 1970’s.According to this technique, businesses or products are classified as low or high performers depending upon their market growth rate and relative market share.
  • #5 BCG MATRIX is simple and easy to understand.It helps you to quickly and simply screen the opportunities open to you, and helps you think about how you can make the most of them.It is used to identify how corporate cash resources can best be used to maximize a company’s future growth and profitability.
  • #14 Most businesses start of as question marks.They will absorb great amounts of cash if the market share remains unchanged, (low).Why question marks?Question marks have potential to become star and eventually cash cow but can also become a dog.Investments should be high for question marks.
  • #16 High market share is not the only success matter. Market growth is not then indicator of the attractiveness of the market.Sometimes dogs can earn even more cash than cash cows.