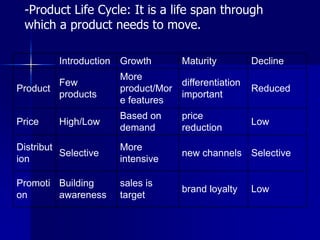
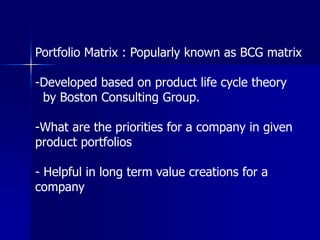
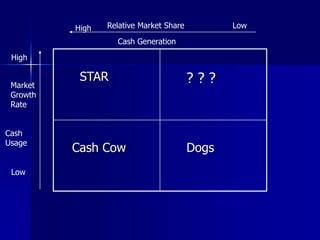
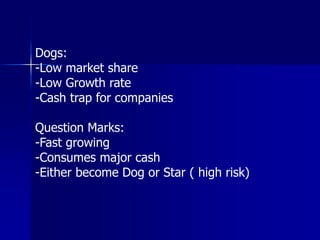
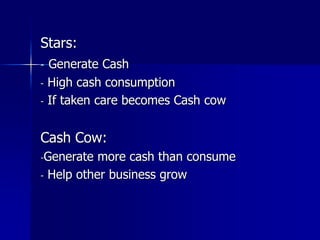
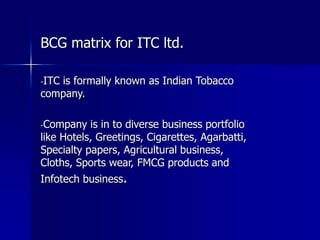
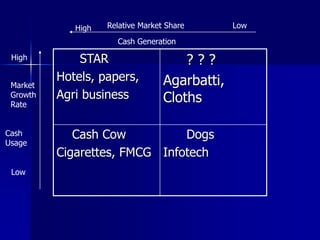
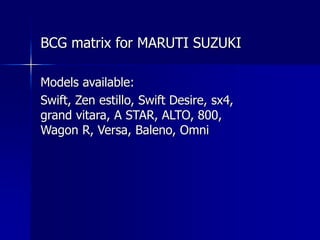
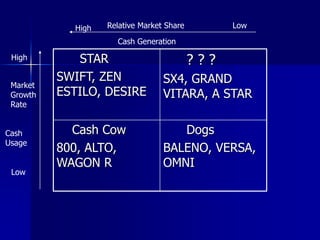
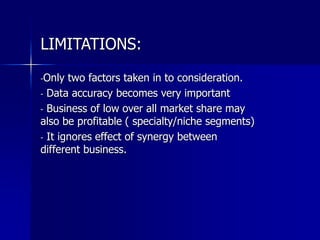
PORTFOLIO ANALYSIS
- By Prof. Purvish Shah
BE ( Mech), PGDBM (Gold Medalist)
-Product Life Cycle: It is a life span through
which a product needs to move.
Introduction Growth Maturity Decline
Product
Few
products
More
product/Mor
e features
differentiation
important
Reduced
Price High/Low
Based on
demand
price
reduction
Low
Distribut
ion
Selective
More
intensive
new channels Selective
Promoti
on
Building
awareness
sales is
target
brand loyalty Low
Portfolio Matrix : Popularly known as BCG matrix
-Developed based on product life cycle theory
by Boston Consulting Group.
-What are the priorities for a company in given
product portfolios
- Helpful in long term value creations for a
company
STAR ? ? ?
Cash Cow Dogs
Low
Low
High
High
Market
Growth
Rate
Relative Market Share
Cash
Usage
Cash Generation
Dogs:
-Low market share
-Low Growth rate
-Cash trap for companies
Question Marks:
-Fast growing
-Consumes major cash
-Either become Dog or Star ( high risk)
Stars:
- Generate Cash
- High cash consumption
- If taken care becomes Cash cow
Cash Cow:
-Generate more cash than consume
- Help other business grow
BCG matrix for ITC ltd.
-ITC is formally known as Indian Tobacco
company.
-Company is in to diverse business portfolio
like Hotels, Greetings, Cigarettes, Agarbatti,
Specialty papers, Agricultural business,
Cloths, Sports wear, FMCG products and
Infotech business.
STAR
Hotels, papers,
Agri business
? ? ?
Agarbatti,
Cloths
Cash Cow
Cigarettes, FMCG
Dogs
Infotech
Low
Low
High
High
Market
Growth
Rate
Relative Market Share
Cash
Usage
Cash Generation
BCG matrix for MARUTI SUZUKI
Models available:
Swift, Zen estillo, Swift Desire, sx4,
grand vitara, A STAR, ALTO, 800,
Wagon R, Versa, Baleno, Omni
STAR
SWIFT, ZEN
ESTILO, DESIRE
? ? ?
SX4, GRAND
VITARA, A STAR
Cash Cow
800, ALTO,
WAGON R
Dogs
BALENO, VERSA,
OMNI
Low
Low
High
High
Market
Growth
Rate
Relative Market Share
Cash
Usage
Cash Generation
LIMITATIONS:
-Only two factors taken in to consideration.
- Data accuracy becomes very important
- Business of low over all market share may
also be profitable ( specialty/niche segments)
- It ignores effect of synergy between
different business.

Portfolio matrix

  • 1.
    PORTFOLIO ANALYSIS - ByProf. Purvish Shah BE ( Mech), PGDBM (Gold Medalist)
  • 2.
    -Product Life Cycle:It is a life span through which a product needs to move. Introduction Growth Maturity Decline Product Few products More product/Mor e features differentiation important Reduced Price High/Low Based on demand price reduction Low Distribut ion Selective More intensive new channels Selective Promoti on Building awareness sales is target brand loyalty Low
  • 3.
    Portfolio Matrix :Popularly known as BCG matrix -Developed based on product life cycle theory by Boston Consulting Group. -What are the priorities for a company in given product portfolios - Helpful in long term value creations for a company
  • 4.
    STAR ? ?? Cash Cow Dogs Low Low High High Market Growth Rate Relative Market Share Cash Usage Cash Generation
  • 5.
    Dogs: -Low market share -LowGrowth rate -Cash trap for companies Question Marks: -Fast growing -Consumes major cash -Either become Dog or Star ( high risk)
  • 6.
    Stars: - Generate Cash -High cash consumption - If taken care becomes Cash cow Cash Cow: -Generate more cash than consume - Help other business grow
  • 7.
    BCG matrix forITC ltd. -ITC is formally known as Indian Tobacco company. -Company is in to diverse business portfolio like Hotels, Greetings, Cigarettes, Agarbatti, Specialty papers, Agricultural business, Cloths, Sports wear, FMCG products and Infotech business.
  • 8.
    STAR Hotels, papers, Agri business ?? ? Agarbatti, Cloths Cash Cow Cigarettes, FMCG Dogs Infotech Low Low High High Market Growth Rate Relative Market Share Cash Usage Cash Generation
  • 9.
    BCG matrix forMARUTI SUZUKI Models available: Swift, Zen estillo, Swift Desire, sx4, grand vitara, A STAR, ALTO, 800, Wagon R, Versa, Baleno, Omni
  • 10.
    STAR SWIFT, ZEN ESTILO, DESIRE ?? ? SX4, GRAND VITARA, A STAR Cash Cow 800, ALTO, WAGON R Dogs BALENO, VERSA, OMNI Low Low High High Market Growth Rate Relative Market Share Cash Usage Cash Generation
  • 11.
    LIMITATIONS: -Only two factorstaken in to consideration. - Data accuracy becomes very important - Business of low over all market share may also be profitable ( specialty/niche segments) - It ignores effect of synergy between different business.