Downloaded 2,431 times

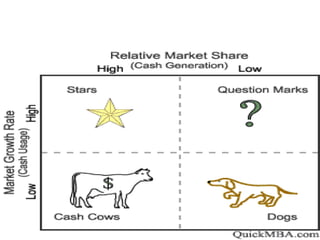

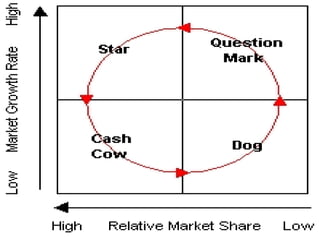
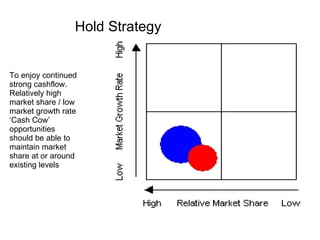
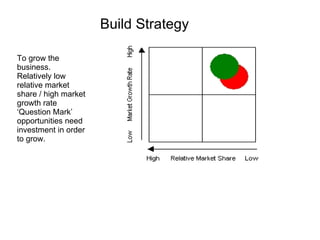
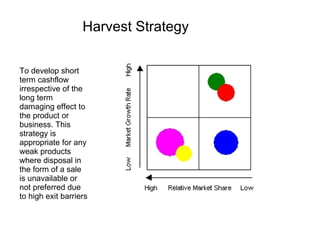
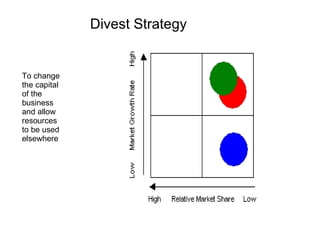
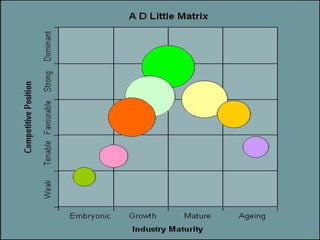
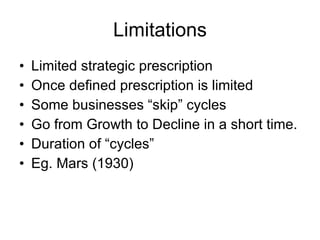
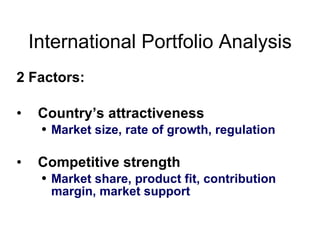
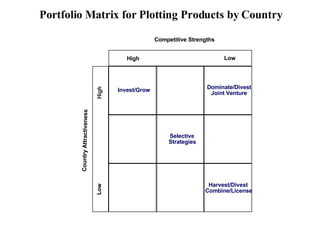
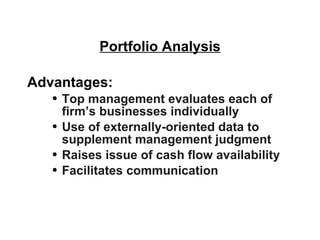
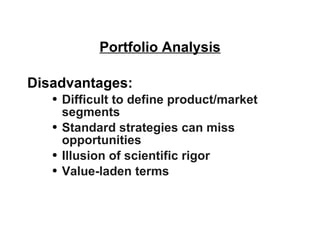

This document discusses different portfolio management strategies and analysis tools used to evaluate a company's multiple business units or product lines. It describes the Boston Box, McKinsey/GE Matrix, AD Little Life-Cycle Matrix and provides examples of how companies like Unilever, Procter & Gamble, and Virgin Group manage their diverse business portfolios. Key portfolio strategies discussed are hold, build, harvest, and divest. It also outlines advantages and limitations of different portfolio analysis models.


![Hofers Method Of Business Portfolio Analysis[1].Ppt2003](https://cdn.slidesharecdn.com/ss_thumbnails/hofersmethodofbusinessportfolioanalysis1-ppt2003-091006110519-phpapp01-thumbnail.jpg?width=640&height=640&fit=bounds)


