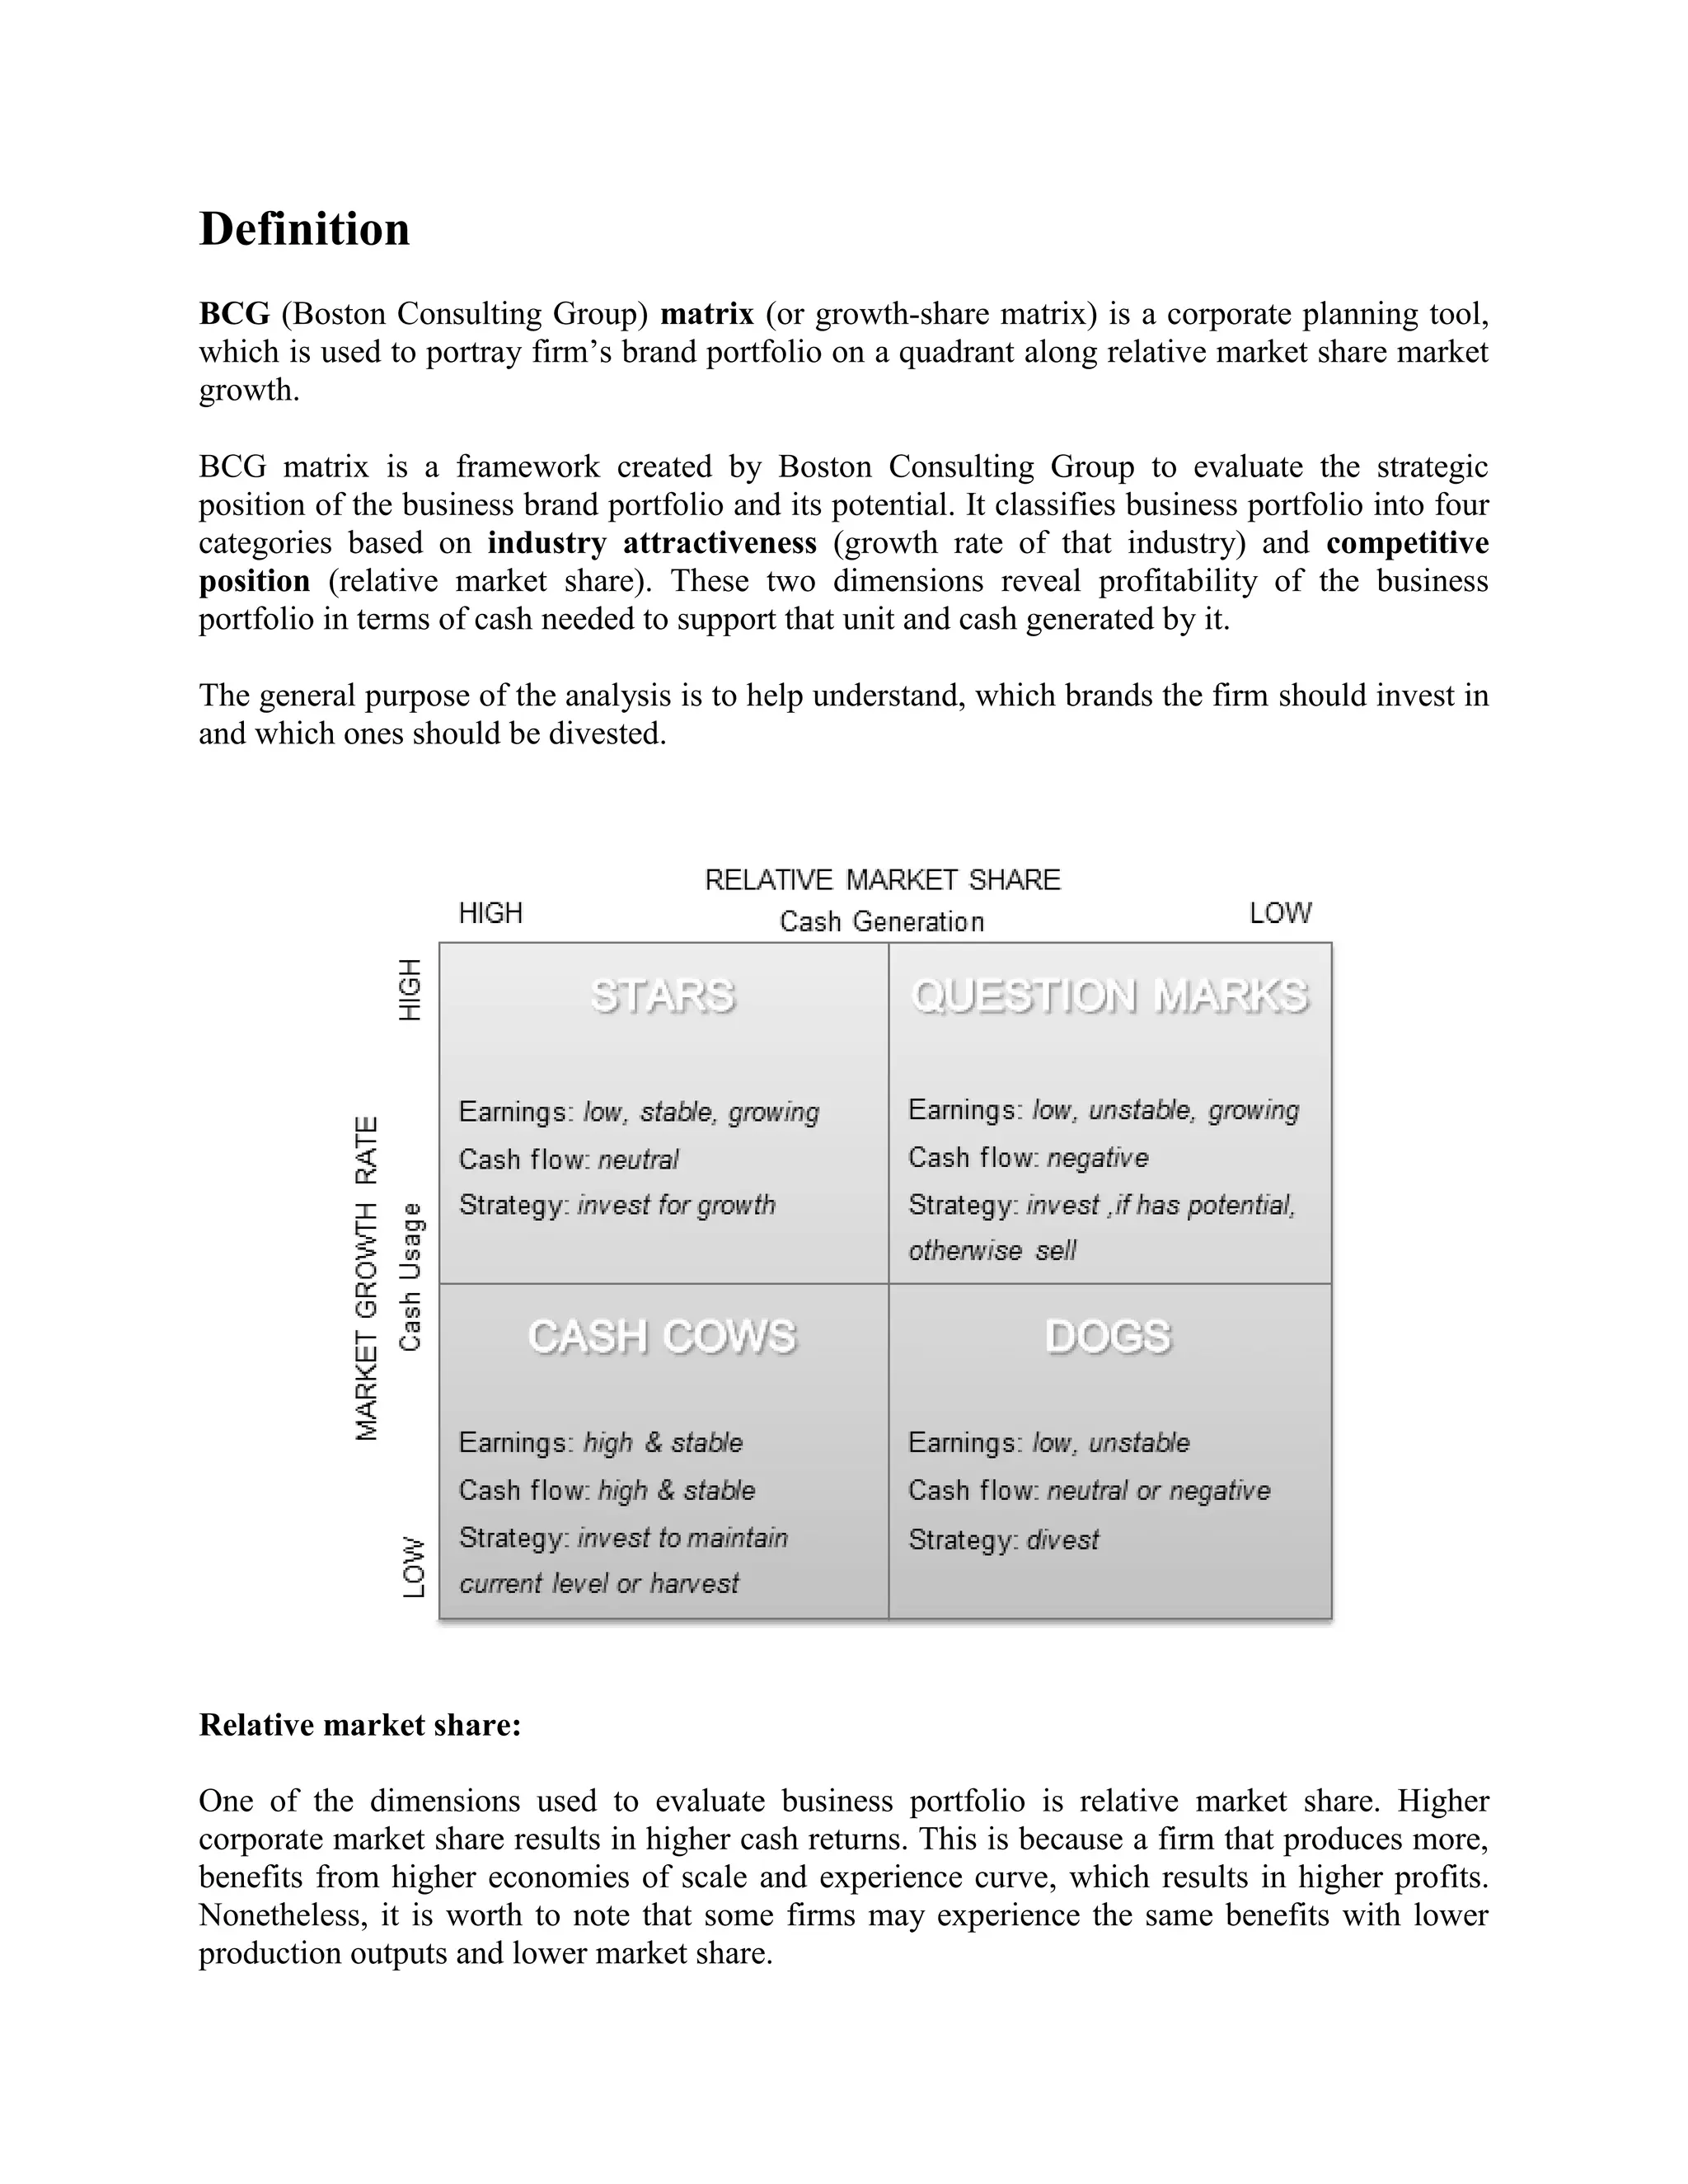
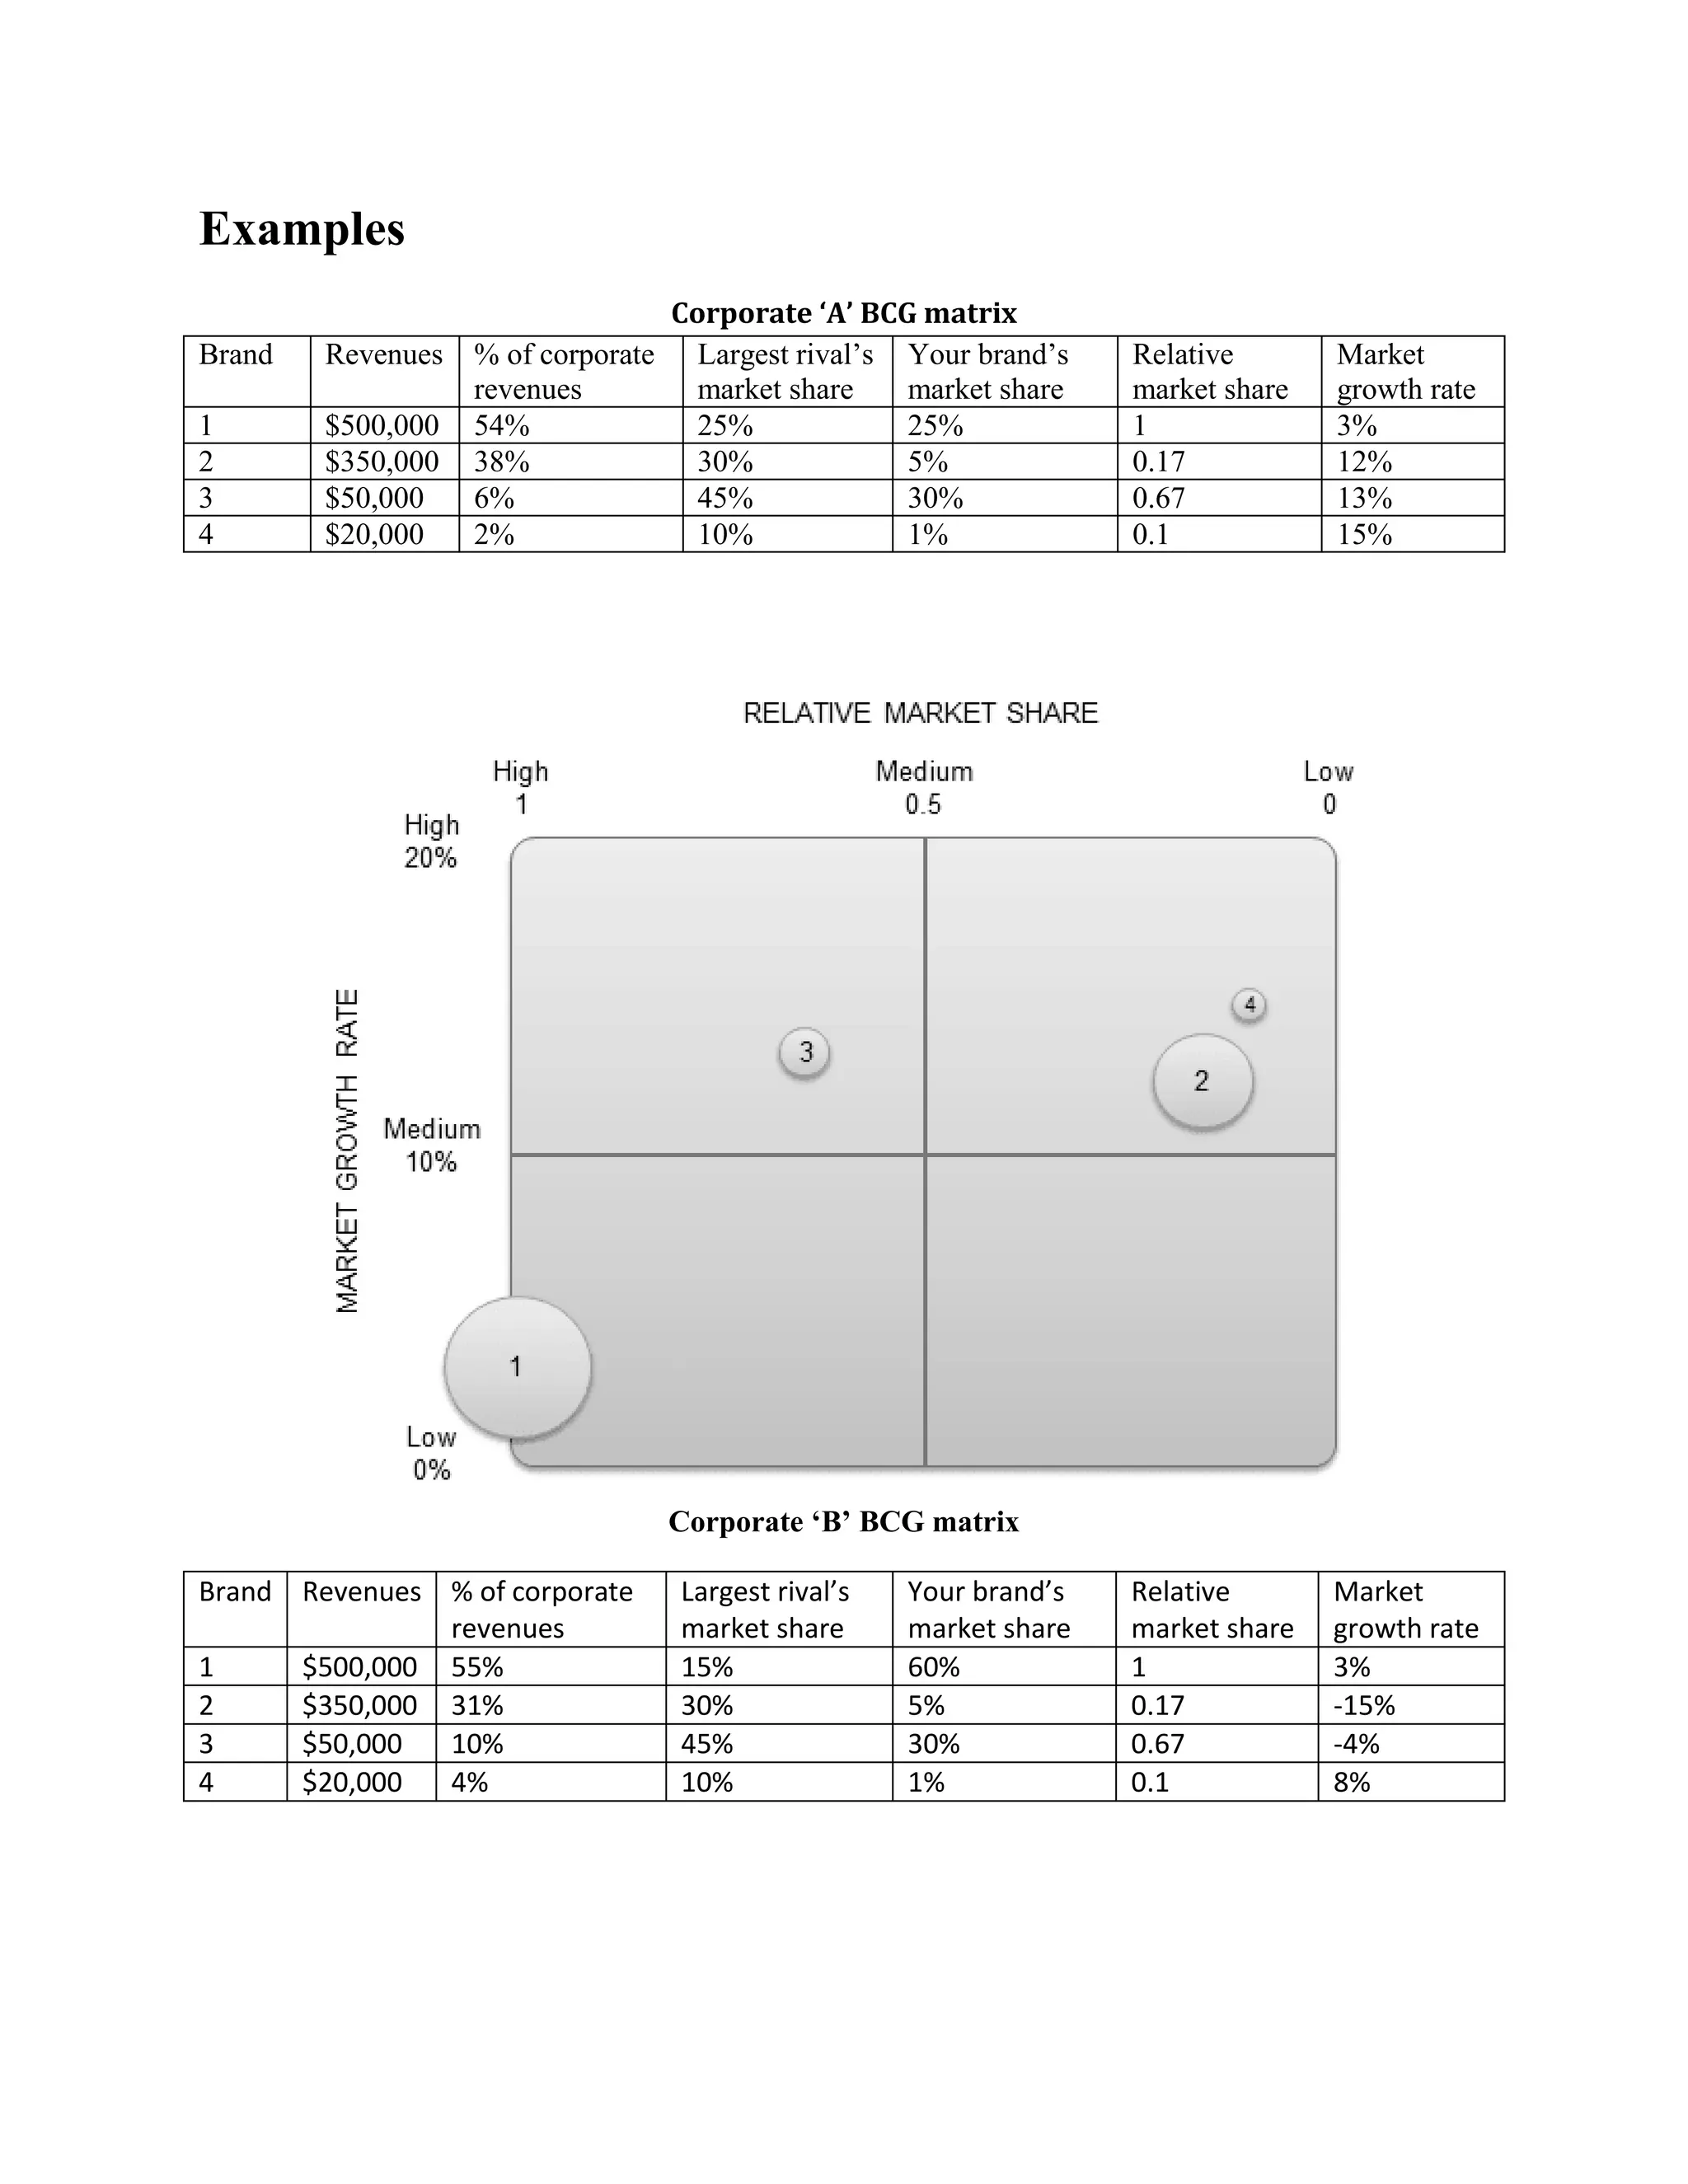
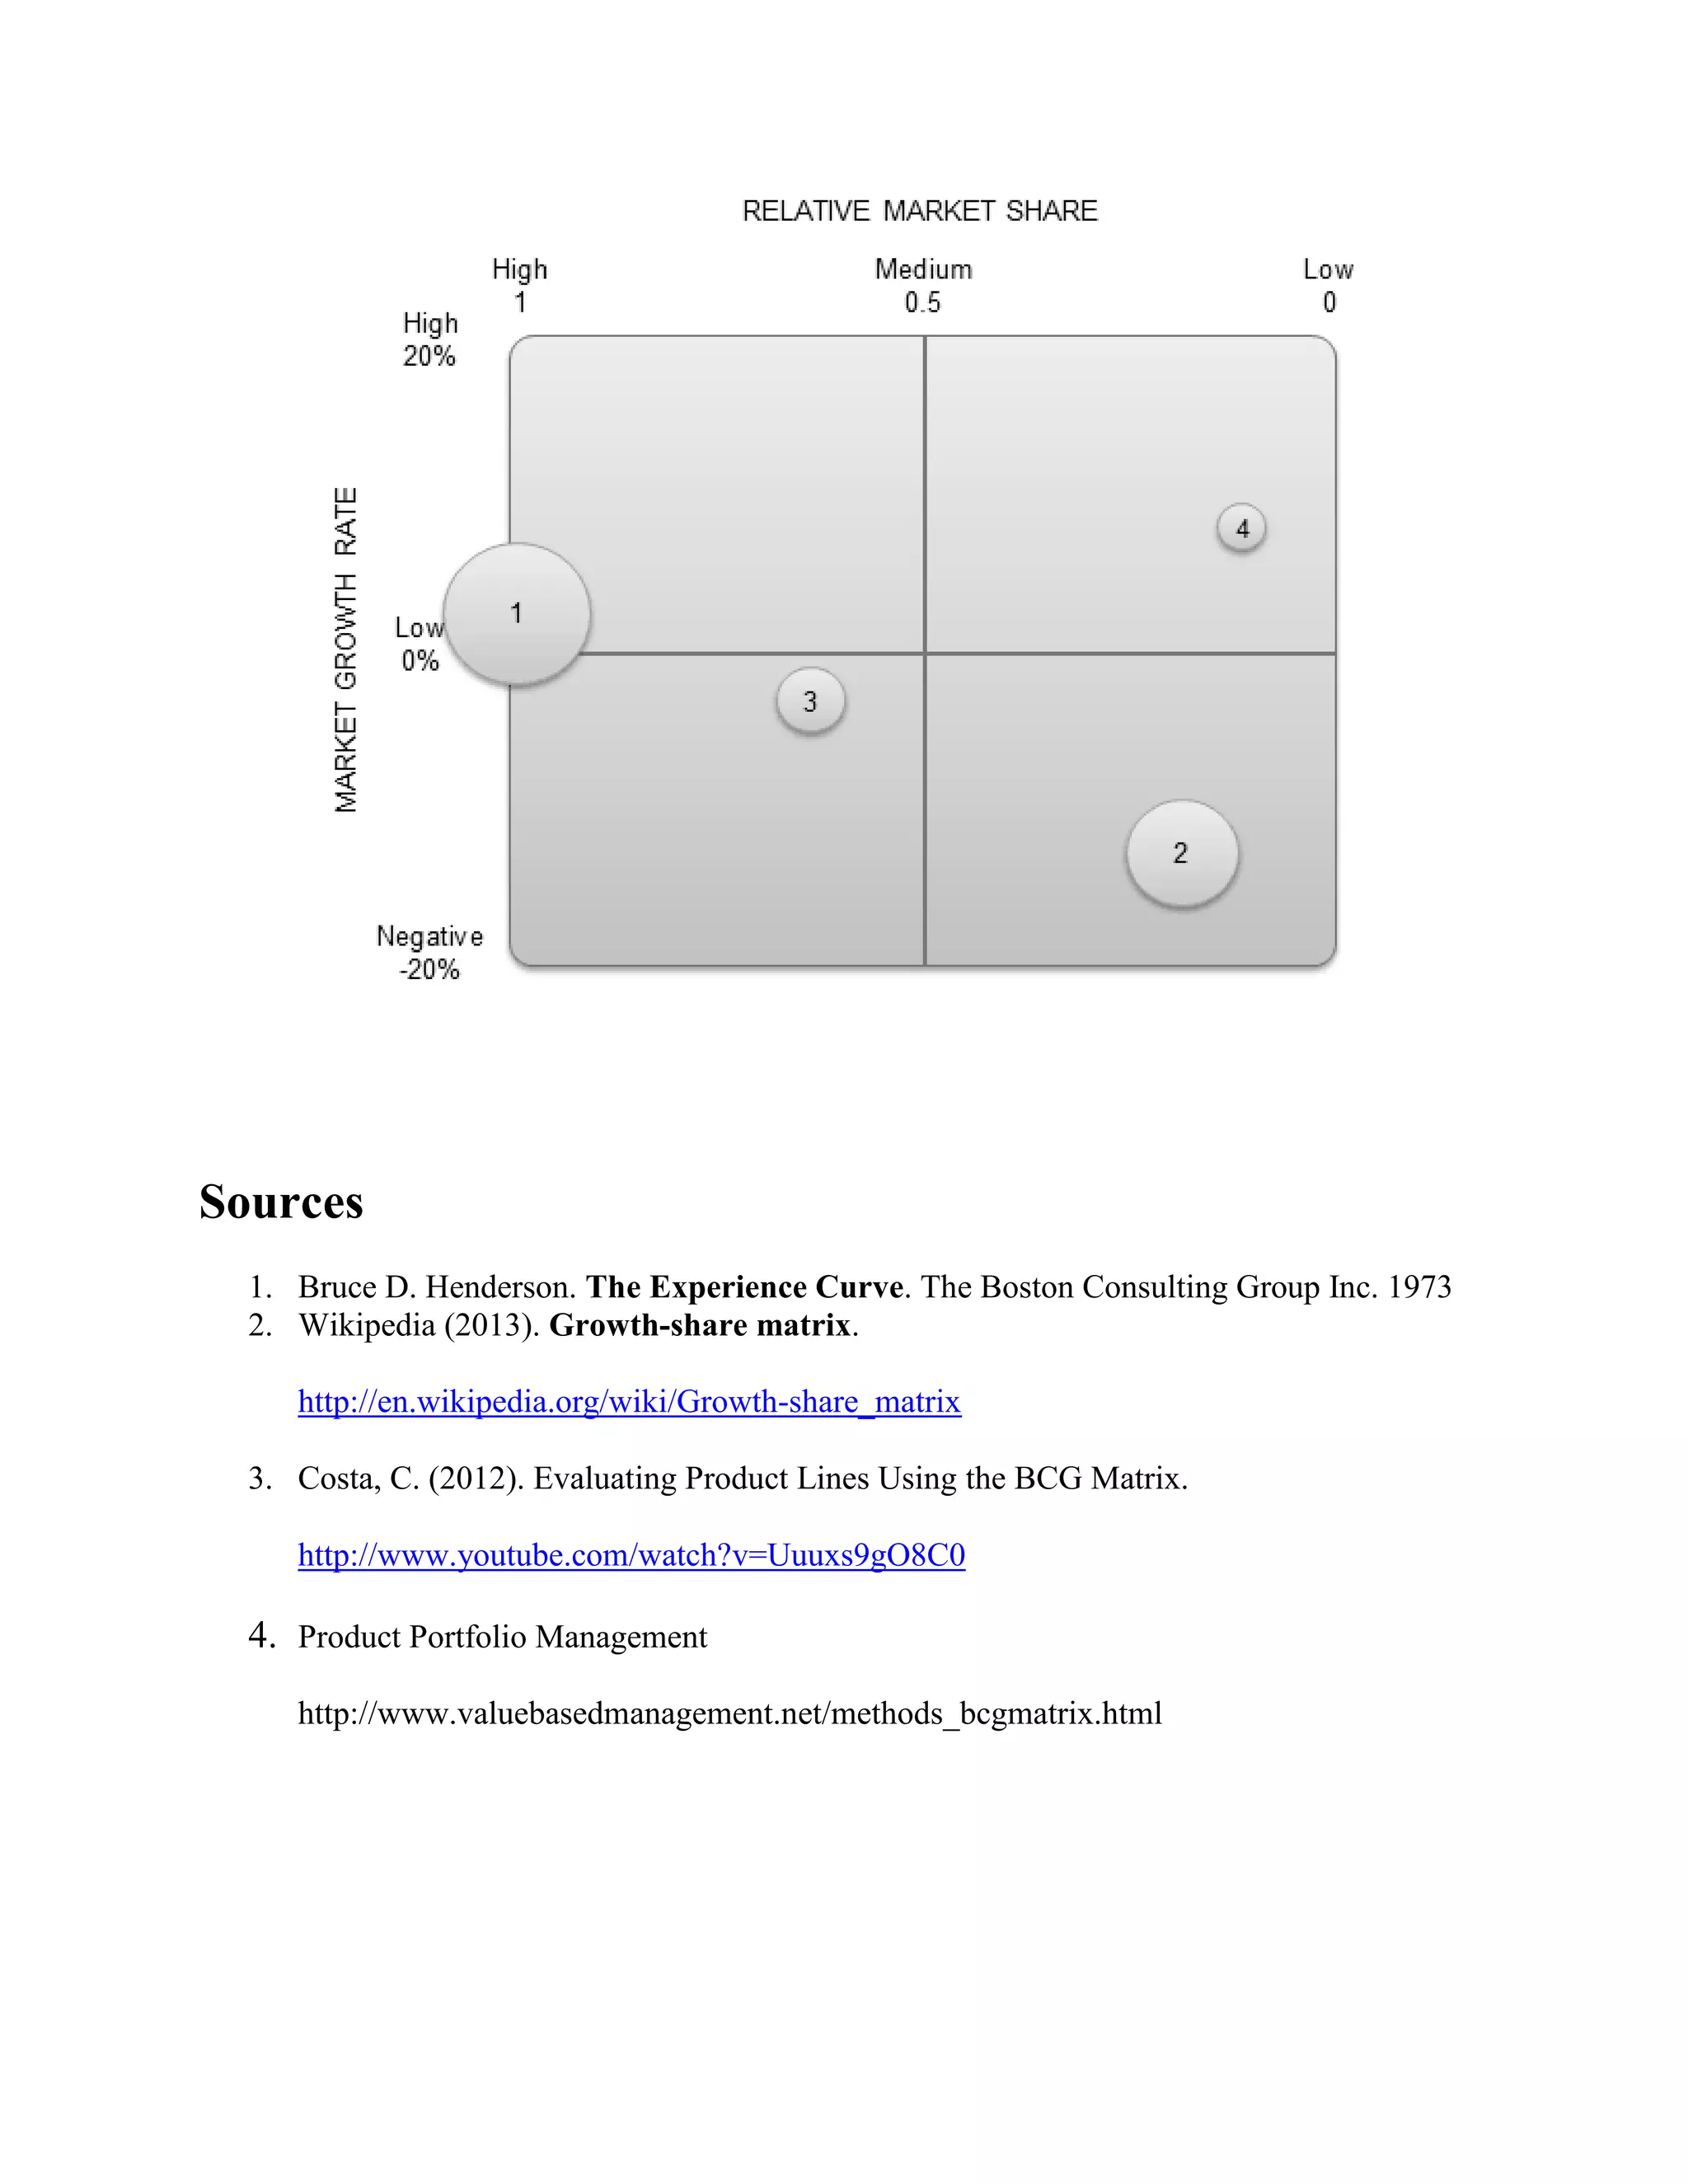
BCG MATRIX
BUSINESS PORTFOLIO DIAGRAM ANALYSIS BY BOSTON CONSULTING GROUP
Submitted By
Qaom, Kismat
ID: 14-97440-1
Section: C
Strategic Management
Master of Business Administration
American International University Bangladesh
Submitted To
Nadeem Ahmed Chaudhury
Submitted on
March 30, 2015
Definition
BCG (Boston Consulting Group) matrix (or growth-share matrix) is a corporate planning tool,
which is used to portray firm’s brand portfolio on a quadrant along relative market share market
growth.
BCG matrix is a framework created by Boston Consulting Group to evaluate the strategic
position of the business brand portfolio and its potential. It classifies business portfolio into four
categories based on industry attractiveness (growth rate of that industry) and competitive
position (relative market share). These two dimensions reveal profitability of the business
portfolio in terms of cash needed to support that unit and cash generated by it.
The general purpose of the analysis is to help understand, which brands the firm should invest in
and which ones should be divested.
Relative market share:
One of the dimensions used to evaluate business portfolio is relative market share. Higher
corporate market share results in higher cash returns. This is because a firm that produces more,
benefits from higher economies of scale and experience curve, which results in higher profits.
Nonetheless, it is worth to note that some firms may experience the same benefits with lower
production outputs and lower market share.
Market growth rate:
High market growth rate means higher earnings and sometimes profits but it also consumes lots
of cash, which is used as investment to stimulate further growth. Therefore, business units that
operate in rapid growth industries are cash users and are worth investing in only when they are
expected to grow or maintain market share in the future.
There are four quadrants into which firms brands are classified:
Dogs: Dogs hold low market share compared to competitors and operate in a slowly growing
market. In general, they are not worth investing in because they generate low or negative cash
returns. But this is not always the truth. Some dogs may be profitable for long period of time.
Strategy: Retrenchment, divestiture, liquidation
Cash cows: Cash cows are the most profitable brands and should be “milked” to provide as
much cash as possible. The cash gained from “cows” should be invested into stars to support
their further growth. According to growth-share matrix, corporate should not invest into cash
cows to induce growth but only to support them so they can maintain their current market share.
Strategy: Product development, diversification, divestiture, retrenchment.
Stars: Stars operate in high growth industries and maintain high market share. Stars are both
cash generators and cash users. They are the primary units in which the company should invest
its money, because stars are expected to become cash cows and generate positive cash flows.
Strategy: Vertical or horizontal integration, market penetration, market or product development
Question marks: Question marks are the brands that require much closer consideration. They
hold low market share in fast growing markets consuming large amount of cash and incur losses.
It has potential to gain market share and become a star, which would later become cash cow.
Strategy: Market penetration, market development, product development, divestiture
Advantages and disadvantages
Benefits of the matrix:
 Easy to perform
 Helps to understand the strategic positions of business portfolio
 It’s a good starting point for further SWOT analysis
Growth-share analysis has been heavily criticized for its oversimplification and lack of useful
application. Following are the main limitations of the analysis:
 High market share is not the only success factor
 Market growth is not the only indicator for attractiveness of a market
 Sometimes dogs can earn more cash as cash cow
Using the tool
Although BCG analysis has lost its importance due to many limitations, it can still be a useful
tool if performed by following these steps:
Step 1. Choose the unit. BCG matrix can be used to analyze SBUs, separate brands, products or
a firm as a unit itself. Which unit will be chosen will have an impact on the whole analysis.
Therefore, it is essential to define the unit for which you’ll do the analysis.
Step 2. Define the market. Defining the market is one of the most important things to do in this
analysis. This is because incorrectly defined market may lead to poor classification.
Step 3. Calculate relative market share. Relative market share can be calculated in terms of
revenues or market share. It is calculated by dividing your own brand’s market share (revenues)
by the market share (or revenues) of your largest competitor in that industry.
Step 4. Find out market growth rate. The industry growth rate can be found in industry
reports, which are usually available online. It can also be calculated from average revenue
growth of the leading industry firms. Therefore, you need to find the growth rate that is
significant (midpoint) to separate cash cows from stars and question marks from dogs.
Step 5. Draw the circles on a matrix. After calculating all the measures, you should be able to
plot your brands on the matrix. You should do this by drawing a circle for each brand. The size
of the circle should correspond to the proportion of business revenue generated by that brand.
Examples
Corporate ‘A’ BCG matrix
Brand Revenues % of corporate
revenues
Largest rival’s
market share
Your brand’s
market share
Relative
market share
Market
growth rate
1 $500,000 54% 25% 25% 1 3%
2 $350,000 38% 30% 5% 0.17 12%
3 $50,000 6% 45% 30% 0.67 13%
4 $20,000 2% 10% 1% 0.1 15%
Corporate ‘B’ BCG matrix
Brand Revenues % of corporate
revenues
Largest rival’s
market share
Your brand’s
market share
Relative
market share
Market
growth rate
1 $500,000 55% 15% 60% 1 3%
2 $350,000 31% 30% 5% 0.17 -15%
3 $50,000 10% 45% 30% 0.67 -4%
4 $20,000 4% 10% 1% 0.1 8%
Sources
1. Bruce D. Henderson. The Experience Curve. The Boston Consulting Group Inc. 1973
2. Wikipedia (2013). Growth-share matrix.
http://en.wikipedia.org/wiki/Growth-share_matrix
3. Costa, C. (2012). Evaluating Product Lines Using the BCG Matrix.
http://www.youtube.com/watch?v=Uuuxs9gO8C0
4. Product Portfolio Management
http://www.valuebasedmanagement.net/methods_bcgmatrix.html

BCG Matrix

  • 1.
    BCG MATRIX BUSINESS PORTFOLIODIAGRAM ANALYSIS BY BOSTON CONSULTING GROUP Submitted By Qaom, Kismat ID: 14-97440-1 Section: C Strategic Management Master of Business Administration American International University Bangladesh Submitted To Nadeem Ahmed Chaudhury Submitted on March 30, 2015
  • 2.
    Definition BCG (Boston ConsultingGroup) matrix (or growth-share matrix) is a corporate planning tool, which is used to portray firm’s brand portfolio on a quadrant along relative market share market growth. BCG matrix is a framework created by Boston Consulting Group to evaluate the strategic position of the business brand portfolio and its potential. It classifies business portfolio into four categories based on industry attractiveness (growth rate of that industry) and competitive position (relative market share). These two dimensions reveal profitability of the business portfolio in terms of cash needed to support that unit and cash generated by it. The general purpose of the analysis is to help understand, which brands the firm should invest in and which ones should be divested. Relative market share: One of the dimensions used to evaluate business portfolio is relative market share. Higher corporate market share results in higher cash returns. This is because a firm that produces more, benefits from higher economies of scale and experience curve, which results in higher profits. Nonetheless, it is worth to note that some firms may experience the same benefits with lower production outputs and lower market share.
  • 3.
    Market growth rate: Highmarket growth rate means higher earnings and sometimes profits but it also consumes lots of cash, which is used as investment to stimulate further growth. Therefore, business units that operate in rapid growth industries are cash users and are worth investing in only when they are expected to grow or maintain market share in the future. There are four quadrants into which firms brands are classified: Dogs: Dogs hold low market share compared to competitors and operate in a slowly growing market. In general, they are not worth investing in because they generate low or negative cash returns. But this is not always the truth. Some dogs may be profitable for long period of time. Strategy: Retrenchment, divestiture, liquidation Cash cows: Cash cows are the most profitable brands and should be “milked” to provide as much cash as possible. The cash gained from “cows” should be invested into stars to support their further growth. According to growth-share matrix, corporate should not invest into cash cows to induce growth but only to support them so they can maintain their current market share. Strategy: Product development, diversification, divestiture, retrenchment. Stars: Stars operate in high growth industries and maintain high market share. Stars are both cash generators and cash users. They are the primary units in which the company should invest its money, because stars are expected to become cash cows and generate positive cash flows. Strategy: Vertical or horizontal integration, market penetration, market or product development Question marks: Question marks are the brands that require much closer consideration. They hold low market share in fast growing markets consuming large amount of cash and incur losses. It has potential to gain market share and become a star, which would later become cash cow. Strategy: Market penetration, market development, product development, divestiture Advantages and disadvantages Benefits of the matrix:  Easy to perform  Helps to understand the strategic positions of business portfolio  It’s a good starting point for further SWOT analysis
  • 4.
    Growth-share analysis hasbeen heavily criticized for its oversimplification and lack of useful application. Following are the main limitations of the analysis:  High market share is not the only success factor  Market growth is not the only indicator for attractiveness of a market  Sometimes dogs can earn more cash as cash cow Using the tool Although BCG analysis has lost its importance due to many limitations, it can still be a useful tool if performed by following these steps: Step 1. Choose the unit. BCG matrix can be used to analyze SBUs, separate brands, products or a firm as a unit itself. Which unit will be chosen will have an impact on the whole analysis. Therefore, it is essential to define the unit for which you’ll do the analysis. Step 2. Define the market. Defining the market is one of the most important things to do in this analysis. This is because incorrectly defined market may lead to poor classification. Step 3. Calculate relative market share. Relative market share can be calculated in terms of revenues or market share. It is calculated by dividing your own brand’s market share (revenues) by the market share (or revenues) of your largest competitor in that industry. Step 4. Find out market growth rate. The industry growth rate can be found in industry reports, which are usually available online. It can also be calculated from average revenue growth of the leading industry firms. Therefore, you need to find the growth rate that is significant (midpoint) to separate cash cows from stars and question marks from dogs. Step 5. Draw the circles on a matrix. After calculating all the measures, you should be able to plot your brands on the matrix. You should do this by drawing a circle for each brand. The size of the circle should correspond to the proportion of business revenue generated by that brand.
  • 5.
    Examples Corporate ‘A’ BCGmatrix Brand Revenues % of corporate revenues Largest rival’s market share Your brand’s market share Relative market share Market growth rate 1 $500,000 54% 25% 25% 1 3% 2 $350,000 38% 30% 5% 0.17 12% 3 $50,000 6% 45% 30% 0.67 13% 4 $20,000 2% 10% 1% 0.1 15% Corporate ‘B’ BCG matrix Brand Revenues % of corporate revenues Largest rival’s market share Your brand’s market share Relative market share Market growth rate 1 $500,000 55% 15% 60% 1 3% 2 $350,000 31% 30% 5% 0.17 -15% 3 $50,000 10% 45% 30% 0.67 -4% 4 $20,000 4% 10% 1% 0.1 8%
  • 6.
    Sources 1. Bruce D.Henderson. The Experience Curve. The Boston Consulting Group Inc. 1973 2. Wikipedia (2013). Growth-share matrix. http://en.wikipedia.org/wiki/Growth-share_matrix 3. Costa, C. (2012). Evaluating Product Lines Using the BCG Matrix. http://www.youtube.com/watch?v=Uuuxs9gO8C0 4. Product Portfolio Management http://www.valuebasedmanagement.net/methods_bcgmatrix.html