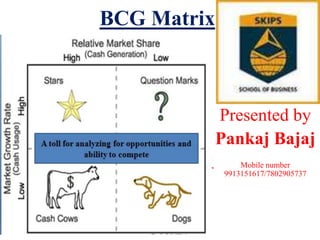
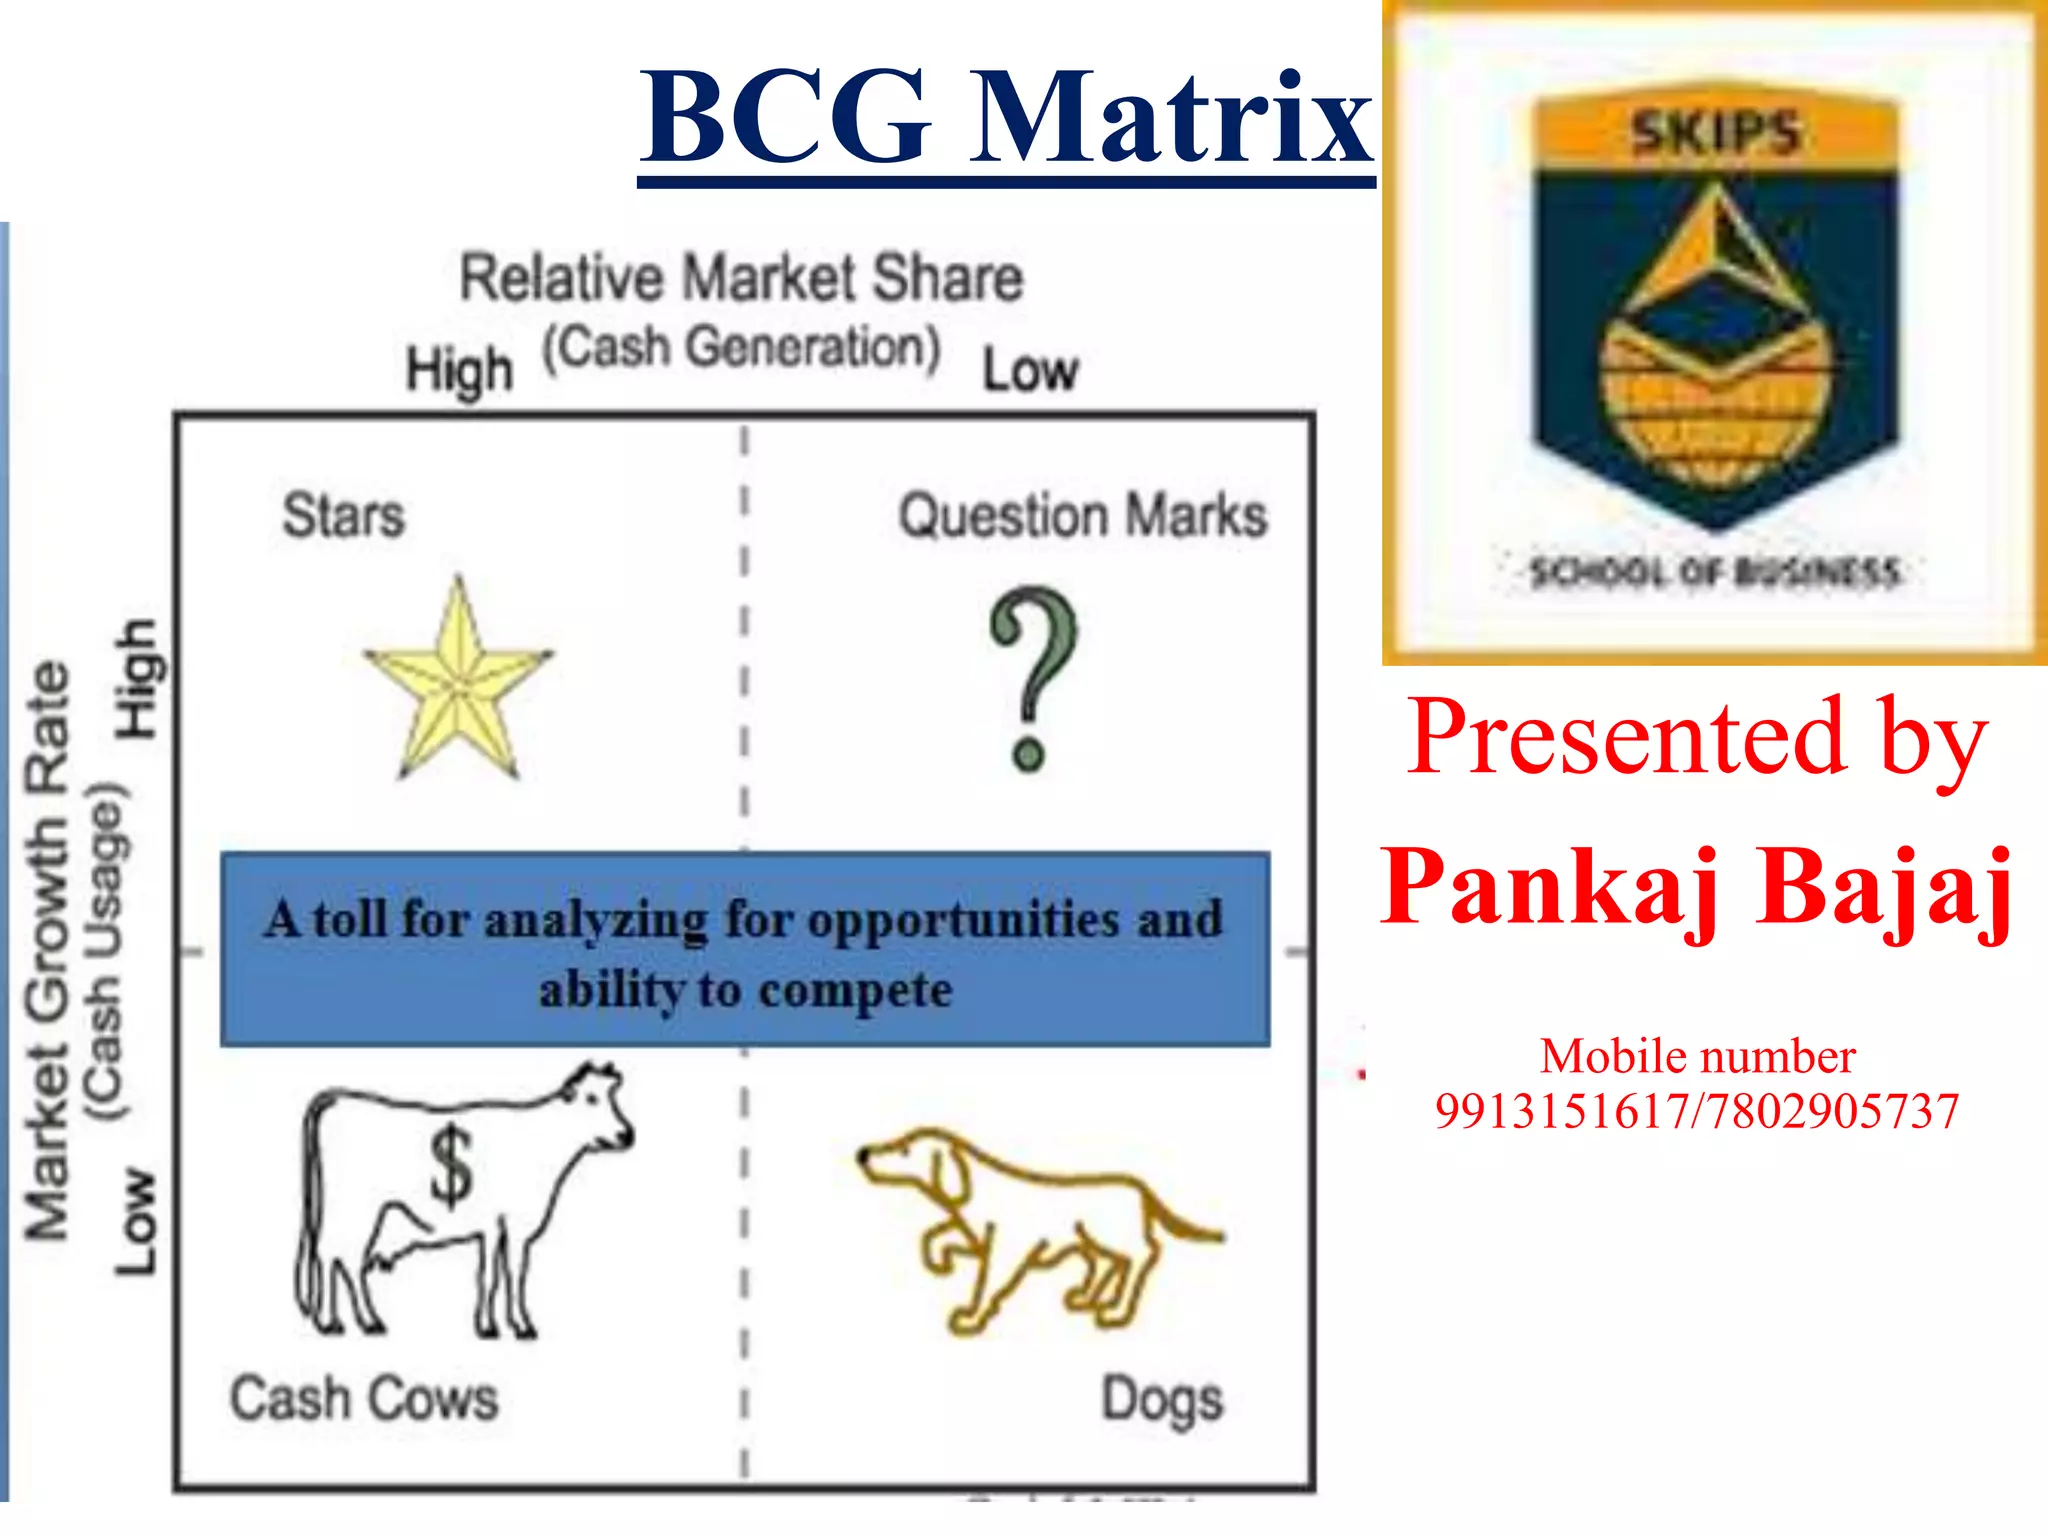
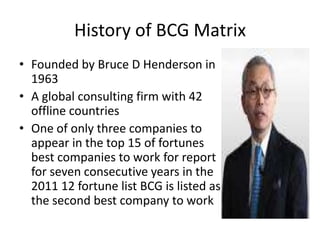
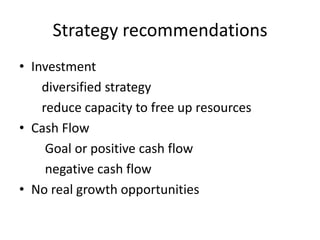
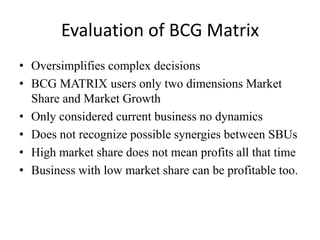
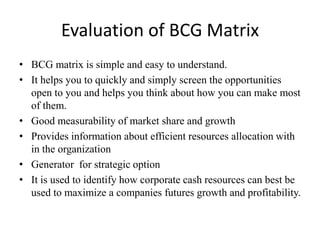
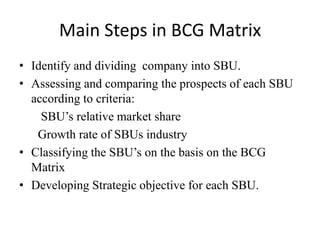
BCG Matrix

Presented by
Pankaj Bajaj
Mobile number
9913151617/7802905737
Outlines of the PPT
•
•
•
•
•
•

History of BCG
Market Share and Market Growth
Portfolio Analysis
Product Lifecycle
The BCG Matrix
Conclusion
History of BCG Matrix
• Founded by Bruce D Henderson in
1963
• A global consulting firm with 42
offline countries
• One of only three companies to
appear in the top 15 of fortunes
best companies to work for report
for seven consecutive years in the
2011 12 fortune list BCG is listed as
the second best company to work
BCG Matrix
• BOSTON CONSULTING GROUP MATRIX is
developed by BRUCE Henderson of the
BOSTON CONSULTING GROUP in the early
1970
• According to this technique business or
product are classified as low or high
performers depending upon their market
growth rate and relative market share
Relative market share and market
growth
• To understand
the Boston Matrix
we need to
understand
market share and
market growth
interrelate
Market share
• Market Share is the percentage of the business
unit sales to the total market that is being
services by your company measured either in
revenue terms or unit volume terms. In indicate
the business unit strength

MS= Business Unit Sales This Year
Total Market Size

MS= Market Share
Relative market share
• Is the percentage of the business unit
sales to the highest competitors sales
measured either in revenue terms or
unit volume terms it indicate the
business unit strength
• RMS= (business unit sale this year)
leading competitor sales this year
RMS= Relative Market Share
Market Growth Rate
• Market growth is used as a measure
of a market’s attractiveness
• Market experiencing high growth
are ones where the total market
share available is expanding and
threes plenty of opportunity for
everyone to make money.

MGR= (total market sales this year) – (total market sales this year)
total market sales last year
Portfolio Analysis
• Product portfolio:- the range of product a
company has in development or
available for consumer at any time
• Managing product portfolio is important
for cash portfolio

• Strategic business unit definition :single independent operation of a
company
has its own competitors
one manager responsible for the
performance
Product life cycle
• Show the stages that product go
through from development to
withdrawal from the market
• Each product may have a
different life cycle
• Contributes
to
strategic
marketing planning
• Helps to identify when a
product needs support redesign
withdrawal
• Helps in forecasting and
managing cash flow
Stages in Product life cycle

•
•
•
•
•
•

Development
Introduction/launch
Growth
Maturity
Decline
Withdrawal
Product life cycle and BCG matrix
Why BCG Matrix?
To access
 Profiles of product and business
 The cash demand of product
 The development cycle of products
 Resource allocation and divestment
decisions
The BCG Matrix
Stares
• High Growth, High Market Share
stares are leaders in business by
having heavy high market share
in a growing market share
they
also
require
heavy
investment to maintain its large
market share
its leads to large amount of cash
consumption and cash generations
Strategy recommendations
• Investment
Further Growth
maintain market position
• Cash flow
Self sustaining : fund there own
growth
require funds from other SBU
(Cash Cows)
• Assure the future of the company
• Grow into the cash cows
Question Marks
• High Growth, Low Market Share
• Question marks are essentially new products
where buyers have yet to discover them. Most
businesses start of as question marks in growing
markets but have low market share
• Question marks have high demand and low
returns due to low market share. Investment
should be high for question marks
• They will absorb great amounts of cash if the
market share remains unchanged
• Question marks have potential to become stares
and eventually cash cow but can become also a
dog
Strategy recommendations
• Investment
increase market share
selectively develop into Stares
• Cash Flow
Require Funds From Other SBUs ( cash cows)
• Unrealized future opportunities
• The marketing strategy is to get markets to adopt this
products
• These product need to increase their market share
quickly or they becomes a dog.
• The best way to handle question marks is to either
invest heavily in them to gain market share or to sell
them
Cash Cow
• Low growth, High Market Share
• They are foundations of the company
and often the stares of yesterday.
• They generate more cash then required.
• They extract the profit by investing as
littlie cash as possible
• They are located in an industry that is
mature, not growing or declining
Strategy recommendations
• Investment
maintain market share
maintain capacity
• Cash Flow
positive cash flow
provides funding to support Stares
and ?.
• No potential for profit growth
Dogs
• Low Growth, Low Market Share
• Dogs are the cash trap
• Dogs do not have potential to bring
in much cash
• Number of dogs in the company
should be minimized
• Business is situated at declining
stage
Strategy recommendations
• Investment
diversified strategy
reduce capacity to free up resources
• Cash Flow
Goal or positive cash flow
negative cash flow
• No real growth opportunities
Evaluation of BCG Matrix
• Oversimplifies complex decisions
• BCG MATRIX users only two dimensions Market
Share and Market Growth
• Only considered current business no dynamics
• Does not recognize possible synergies between SBUs
• High market share does not mean profits all that time
• Business with low market share can be profitable too.
Evaluation of BCG Matrix
• BCG matrix is simple and easy to understand.
• It helps you to quickly and simply screen the opportunities
open to you and helps you think about how you can make most
of them.
• Good measurability of market share and growth
• Provides information about efficient resources allocation with
in the organization
• Generator for strategic option
• It is used to identify how corporate cash resources can best be
used to maximize a companies futures growth and profitability.
Main Steps in BCG Matrix
• Identify and dividing company into SBU.
• Assessing and comparing the prospects of each SBU
according to criteria:
SBU’s relative market share
Growth rate of SBUs industry
• Classifying the SBU’s on the basis on the BCG
Matrix
• Developing Strategic objective for each SBU.
Conclusion
• Though BCG Matrix has its limitations it is one of the
most famous and simple portfolio planning matrix,
used by large companies having multi-products.
• As long as management understands that the BCG
growth/Share Matrix generates option which is
require further analysis and validation, this tool can
greatly enhance strategic decision making.
Information about BCG Matrix

Information about BCG Matrix

  • 1.
    BCG Matrix Presented by PankajBajaj Mobile number 9913151617/7802905737
  • 2.
    Outlines of thePPT • • • • • • History of BCG Market Share and Market Growth Portfolio Analysis Product Lifecycle The BCG Matrix Conclusion
  • 3.
    History of BCGMatrix • Founded by Bruce D Henderson in 1963 • A global consulting firm with 42 offline countries • One of only three companies to appear in the top 15 of fortunes best companies to work for report for seven consecutive years in the 2011 12 fortune list BCG is listed as the second best company to work
  • 4.
    BCG Matrix • BOSTONCONSULTING GROUP MATRIX is developed by BRUCE Henderson of the BOSTON CONSULTING GROUP in the early 1970 • According to this technique business or product are classified as low or high performers depending upon their market growth rate and relative market share
  • 5.
    Relative market shareand market growth • To understand the Boston Matrix we need to understand market share and market growth interrelate
  • 6.
    Market share • MarketShare is the percentage of the business unit sales to the total market that is being services by your company measured either in revenue terms or unit volume terms. In indicate the business unit strength MS= Business Unit Sales This Year Total Market Size MS= Market Share
  • 7.
    Relative market share •Is the percentage of the business unit sales to the highest competitors sales measured either in revenue terms or unit volume terms it indicate the business unit strength • RMS= (business unit sale this year) leading competitor sales this year RMS= Relative Market Share
  • 8.
    Market Growth Rate •Market growth is used as a measure of a market’s attractiveness • Market experiencing high growth are ones where the total market share available is expanding and threes plenty of opportunity for everyone to make money. MGR= (total market sales this year) – (total market sales this year) total market sales last year
  • 9.
    Portfolio Analysis • Productportfolio:- the range of product a company has in development or available for consumer at any time • Managing product portfolio is important for cash portfolio • Strategic business unit definition :single independent operation of a company has its own competitors one manager responsible for the performance
  • 10.
    Product life cycle •Show the stages that product go through from development to withdrawal from the market • Each product may have a different life cycle • Contributes to strategic marketing planning • Helps to identify when a product needs support redesign withdrawal • Helps in forecasting and managing cash flow
  • 11.
    Stages in Productlife cycle • • • • • • Development Introduction/launch Growth Maturity Decline Withdrawal
  • 12.
    Product life cycleand BCG matrix
  • 13.
    Why BCG Matrix? Toaccess  Profiles of product and business  The cash demand of product  The development cycle of products  Resource allocation and divestment decisions
  • 14.
  • 15.
    Stares • High Growth,High Market Share stares are leaders in business by having heavy high market share in a growing market share they also require heavy investment to maintain its large market share its leads to large amount of cash consumption and cash generations
  • 16.
    Strategy recommendations • Investment FurtherGrowth maintain market position • Cash flow Self sustaining : fund there own growth require funds from other SBU (Cash Cows) • Assure the future of the company • Grow into the cash cows
  • 17.
    Question Marks • HighGrowth, Low Market Share • Question marks are essentially new products where buyers have yet to discover them. Most businesses start of as question marks in growing markets but have low market share • Question marks have high demand and low returns due to low market share. Investment should be high for question marks • They will absorb great amounts of cash if the market share remains unchanged • Question marks have potential to become stares and eventually cash cow but can become also a dog
  • 18.
    Strategy recommendations • Investment increasemarket share selectively develop into Stares • Cash Flow Require Funds From Other SBUs ( cash cows) • Unrealized future opportunities • The marketing strategy is to get markets to adopt this products • These product need to increase their market share quickly or they becomes a dog. • The best way to handle question marks is to either invest heavily in them to gain market share or to sell them
  • 19.
    Cash Cow • Lowgrowth, High Market Share • They are foundations of the company and often the stares of yesterday. • They generate more cash then required. • They extract the profit by investing as littlie cash as possible • They are located in an industry that is mature, not growing or declining
  • 20.
    Strategy recommendations • Investment maintainmarket share maintain capacity • Cash Flow positive cash flow provides funding to support Stares and ?. • No potential for profit growth
  • 21.
    Dogs • Low Growth,Low Market Share • Dogs are the cash trap • Dogs do not have potential to bring in much cash • Number of dogs in the company should be minimized • Business is situated at declining stage
  • 22.
    Strategy recommendations • Investment diversifiedstrategy reduce capacity to free up resources • Cash Flow Goal or positive cash flow negative cash flow • No real growth opportunities
  • 23.
    Evaluation of BCGMatrix • Oversimplifies complex decisions • BCG MATRIX users only two dimensions Market Share and Market Growth • Only considered current business no dynamics • Does not recognize possible synergies between SBUs • High market share does not mean profits all that time • Business with low market share can be profitable too.
  • 24.
    Evaluation of BCGMatrix • BCG matrix is simple and easy to understand. • It helps you to quickly and simply screen the opportunities open to you and helps you think about how you can make most of them. • Good measurability of market share and growth • Provides information about efficient resources allocation with in the organization • Generator for strategic option • It is used to identify how corporate cash resources can best be used to maximize a companies futures growth and profitability.
  • 25.
    Main Steps inBCG Matrix • Identify and dividing company into SBU. • Assessing and comparing the prospects of each SBU according to criteria: SBU’s relative market share Growth rate of SBUs industry • Classifying the SBU’s on the basis on the BCG Matrix • Developing Strategic objective for each SBU.
  • 26.
    Conclusion • Though BCGMatrix has its limitations it is one of the most famous and simple portfolio planning matrix, used by large companies having multi-products. • As long as management understands that the BCG growth/Share Matrix generates option which is require further analysis and validation, this tool can greatly enhance strategic decision making.