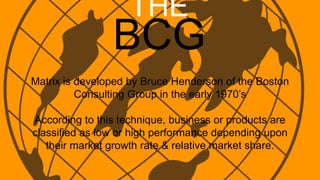
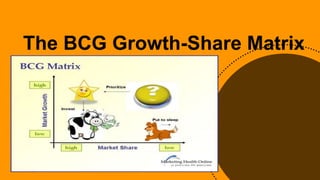
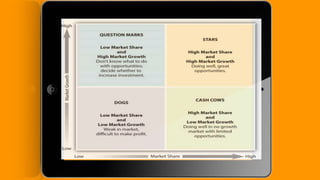
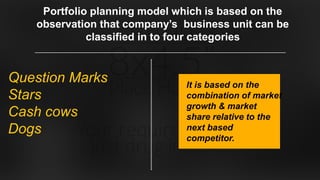
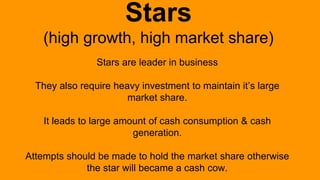
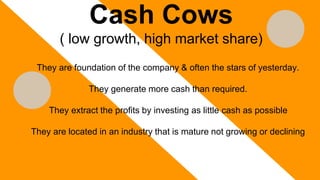
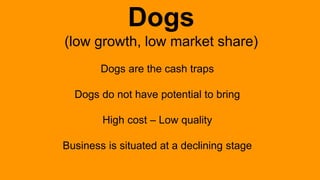
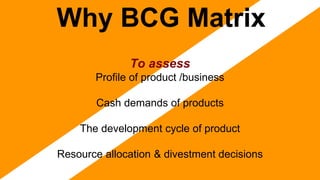
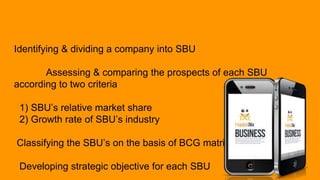
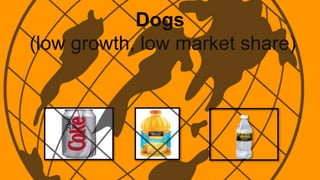
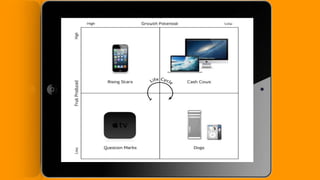
Management
& BUSINESS
POLICY
BCG Matrix
Presented By : Teodoro N. Ramirez VIII
MBA
THE
BCG
Matrix is developed by Bruce Henderson of the Boston
Consulting Group in the early 1970’s
According to this technique, business or products are
classified as low or high performance depending upon
their market growth rate & relative market share.
MARKET
SHAREMarket share is the percentage of the total market that is being serviced by your company
measured either in the revenue terms or unit volume terms.
Business Unit Sales this year
Leading rival sales this yearRMS =
Relative Market Share
The higher your market share, the
higher proportion of the market you
Relative Market Share & Market
Growth
To understand the Boston Matrix you need to understand
how market share & market growth interrelated.
61%
14%
5%
20%
Market Growth
Rate
Market Growth is used as a measure of a market’s attractiveness.
Business Unit Sales this year
Leading rival sales this yearRMS =
Relative Market Share
The higher your market share, the
higher proportion of the market you
33
%
42
%30
%
13
%
Markets experiencing high growth are ones where the total
market share available is expanding & there is plenty of
opportunity for everyone to make money
The BCG Growth-Share Matrix
Portfolio planning model which is based on the
observation that company’s business unit can be
classified in to four categories
Question Marks
Stars
Cash cows
Dogs
It is based on the
combination of market
growth & market
share relative to the
next based
competitor.
Question marks/Problem Children (
high growth, low market share)
Most business start of as question marks
They will absorb great amount of cash if the market share
remains unchanged (low)
Question marks have potential to become star & evenly cash
cow but can also become dog.
Investment should be high for question marks.
Stars
(high growth, high market share)
Stars are leader in business
They also require heavy investment to maintain it’s large
market share.
It leads to large amount of cash consumption & cash
generation.
Attempts should be made to hold the market share otherwise
the star will became a cash cow.
Cash Cows
( low growth, high market share)
They are foundation of the company & often the stars of yesterday.
They generate more cash than required.
They extract the profits by investing as little cash as possible
They are located in an industry that is mature not growing or declining
Dogs
(low growth, low market share)
Dogs are the cash traps
Dogs do not have potential to bring
High cost – Low quality
Business is situated at a declining stage
Why BCG Matrix
To assess
Profile of product /business
Cash demands of products
The development cycle of product
Resource allocation & divestment decisions
Identifying & dividing a company into SBU
Assessing & comparing the prospects of each SBU
according to two criteria
1) SBU’s relative market share
2) Growth rate of SBU’s industry
Classifying the SBU’s on the basis of BCG matrix
Developing strategic objective for each SBU
Benefits
BCG matrix is simple & easy to understand
It helps to quickly & simply screen the opportunity open to
you, & help you think about how you can make the most of
them.
It is used to identify how corporate cash resources can best
be used to maximize company’s future growth & profitability.
BCG matrix uses only two dimensions relative
market share & market growth rate.
Problem of getting data on market share &
market growth
High market share does not mean profits all
time.
Business with market share can be profitable
too.
Limitation
BCG-Matrix for the product
line of
Question Marks
(high growth, low market share)
Stars
(high growth, high market share)
Cash Cows
(low growth, high market share)
Dogs
(low growth, low market share)
Conclusion
Though BCG matrix has its limitation it is one of the most famous & simple
portfolio planning matrix, used by large companies having multi-products.
Bcg powerpoint mba

Bcg powerpoint mba

  • 1.
    Management & BUSINESS POLICY BCG Matrix PresentedBy : Teodoro N. Ramirez VIII MBA
  • 2.
    THE BCG Matrix is developedby Bruce Henderson of the Boston Consulting Group in the early 1970’s According to this technique, business or products are classified as low or high performance depending upon their market growth rate & relative market share.
  • 3.
    MARKET SHAREMarket share isthe percentage of the total market that is being serviced by your company measured either in the revenue terms or unit volume terms. Business Unit Sales this year Leading rival sales this yearRMS = Relative Market Share The higher your market share, the higher proportion of the market you
  • 4.
    Relative Market Share& Market Growth To understand the Boston Matrix you need to understand how market share & market growth interrelated. 61% 14% 5% 20%
  • 5.
    Market Growth Rate Market Growthis used as a measure of a market’s attractiveness. Business Unit Sales this year Leading rival sales this yearRMS = Relative Market Share The higher your market share, the higher proportion of the market you
  • 6.
    33 % 42 %30 % 13 % Markets experiencing highgrowth are ones where the total market share available is expanding & there is plenty of opportunity for everyone to make money
  • 7.
  • 9.
    Portfolio planning modelwhich is based on the observation that company’s business unit can be classified in to four categories Question Marks Stars Cash cows Dogs It is based on the combination of market growth & market share relative to the next based competitor.
  • 11.
    Question marks/Problem Children( high growth, low market share) Most business start of as question marks They will absorb great amount of cash if the market share remains unchanged (low) Question marks have potential to become star & evenly cash cow but can also become dog. Investment should be high for question marks.
  • 12.
    Stars (high growth, highmarket share) Stars are leader in business They also require heavy investment to maintain it’s large market share. It leads to large amount of cash consumption & cash generation. Attempts should be made to hold the market share otherwise the star will became a cash cow.
  • 13.
    Cash Cows ( lowgrowth, high market share) They are foundation of the company & often the stars of yesterday. They generate more cash than required. They extract the profits by investing as little cash as possible They are located in an industry that is mature not growing or declining
  • 14.
    Dogs (low growth, lowmarket share) Dogs are the cash traps Dogs do not have potential to bring High cost – Low quality Business is situated at a declining stage
  • 15.
    Why BCG Matrix Toassess Profile of product /business Cash demands of products The development cycle of product Resource allocation & divestment decisions
  • 16.
    Identifying & dividinga company into SBU Assessing & comparing the prospects of each SBU according to two criteria 1) SBU’s relative market share 2) Growth rate of SBU’s industry Classifying the SBU’s on the basis of BCG matrix Developing strategic objective for each SBU
  • 17.
    Benefits BCG matrix issimple & easy to understand It helps to quickly & simply screen the opportunity open to you, & help you think about how you can make the most of them. It is used to identify how corporate cash resources can best be used to maximize company’s future growth & profitability.
  • 18.
    BCG matrix usesonly two dimensions relative market share & market growth rate. Problem of getting data on market share & market growth High market share does not mean profits all time. Business with market share can be profitable too. Limitation
  • 19.
    BCG-Matrix for theproduct line of
  • 20.
  • 21.
  • 22.
    Cash Cows (low growth,high market share)
  • 23.
    Dogs (low growth, lowmarket share)
  • 25.
    Conclusion Though BCG matrixhas its limitation it is one of the most famous & simple portfolio planning matrix, used by large companies having multi-products.