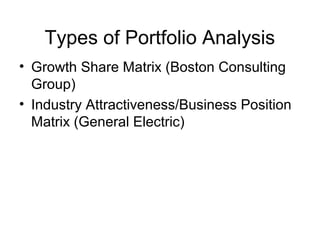
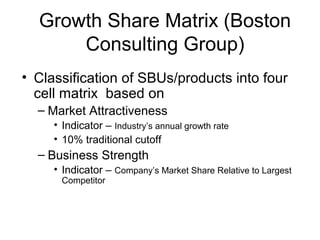
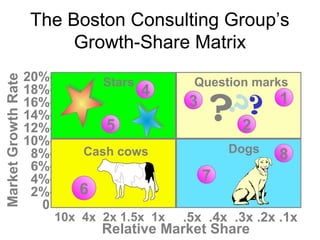
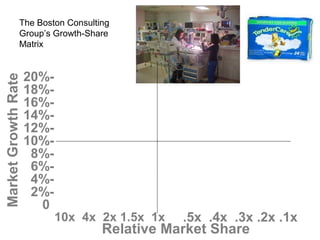
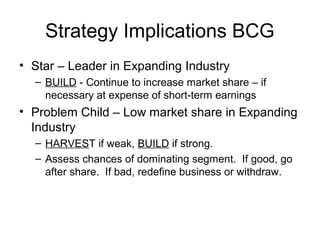
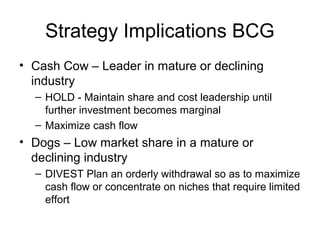
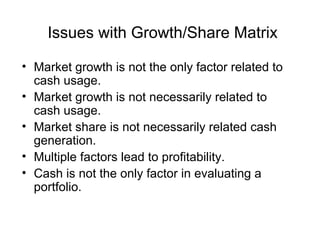
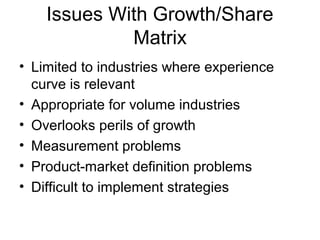
Portfolio Analysis
BCG Tool for Analyzing
Opportunities & Ability to
Compete
Types of Portfolio Analysis
• Growth Share Matrix (Boston Consulting
Group)
• Industry Attractiveness/Business Position
Matrix (General Electric)
Growth Share Matrix (Boston
Consulting Group)
• Classification of SBUs/products into four
cell matrix based on
– Market Attractiveness
• Indicator – Industry’s annual growth rate
• 10% traditional cutoff

– Business Strength
• Indicator – Company’s Market Share Relative to Largest
Competitor
Market Growth Rate

The Boston Consulting Group’s
Growth-Share Matrix
20%18%16%14%12%10%8%6%4%2%0

Stars

4

5

Question marks

3

??
?

1

2

Dogs

Cash cows

8

7

6
10x 4x 2x 1.5x 1x

.5x .4x .3x .2x .1x

Relative Market Share
Star Strategies
• Leader expanding
industry
• Generates large profits
• Requires substantial
investments to sustain
growth
• Farthest down on
experience curve relative
to competition
• Increase sales – e.g. new
markets, new channels of
distribution
• Increase market share
Problem Child or ?
• Low market share in
expanding industry
• Needs substantial cash to
improve its position
• Slow progress on
experience curve
• Increase sales (limit to
niche or increase market
share (limit to niche)
• Leave market
Cash Cow
•
•
•

•

Leader in mature or declining
industry
Can generate funds for other
SBUs
Maintain market share e.g.
ensure quality, build customer
loyalty, develop substitute
brands
Maximize Cash Flow e.g.
increase usage rate, rate of
replacement, modify expense
structure, raise prices
Dogs
• Low market share in a
mature or declining
industry
• Slow progress on
experience curve
• Cost disadvantages and
few growth opportunities
• Harvest or Divest
• Concentrate on niches
requiring limited effort
Market Growth Rate

The Boston Consulting
Group’s Growth-Share
Matrix

20%18%16%14%12%10%8%6%4%2%0

10x 4x 2x 1.5x 1x

.5x .4x .3x .2x .1x

Relative Market Share
Strategy Implications BCG
• Star – Leader in Expanding Industry
– BUILD - Continue to increase market share – if
necessary at expense of short-term earnings

• Problem Child – Low market share in Expanding
Industry
– HARVEST if weak, BUILD if strong.
– Assess chances of dominating segment. If good, go
after share. If bad, redefine business or withdraw.
Strategy Implications BCG
• Cash Cow – Leader in mature or declining
industry
– HOLD - Maintain share and cost leadership until
further investment becomes marginal
– Maximize cash flow

• Dogs – Low market share in a mature or
declining industry
– DIVEST Plan an orderly withdrawal so as to maximize
cash flow or concentrate on niches that require limited
effort
Assumptions of Growth /Share
Matrix
• High market share generates cash
revenues ?
• High Market growth uses more cash
resources ?
Issues with Growth/Share Matrix
• Market growth is not the only factor related to
cash usage.
• Market growth is not necessarily related to
cash usage.
• Market share is not necessarily related cash
generation.
• Multiple factors lead to profitability.
• Cash is not the only factor in evaluating a
portfolio.
Issues With Growth/Share
Matrix
• Limited to industries where experience
curve is relevant
• Appropriate for volume industries
• Overlooks perils of growth
• Measurement problems
• Product-market definition problems
• Difficult to implement strategies

Bcg portfolio analysis

  • 1.
    Portfolio Analysis BCG Toolfor Analyzing Opportunities & Ability to Compete
  • 2.
    Types of PortfolioAnalysis • Growth Share Matrix (Boston Consulting Group) • Industry Attractiveness/Business Position Matrix (General Electric)
  • 3.
    Growth Share Matrix(Boston Consulting Group) • Classification of SBUs/products into four cell matrix based on – Market Attractiveness • Indicator – Industry’s annual growth rate • 10% traditional cutoff – Business Strength • Indicator – Company’s Market Share Relative to Largest Competitor
  • 4.
    Market Growth Rate TheBoston Consulting Group’s Growth-Share Matrix 20%18%16%14%12%10%8%6%4%2%0 Stars 4 5 Question marks 3 ?? ? 1 2 Dogs Cash cows 8 7 6 10x 4x 2x 1.5x 1x .5x .4x .3x .2x .1x Relative Market Share
  • 5.
    Star Strategies • Leaderexpanding industry • Generates large profits • Requires substantial investments to sustain growth • Farthest down on experience curve relative to competition • Increase sales – e.g. new markets, new channels of distribution • Increase market share
  • 6.
    Problem Child or? • Low market share in expanding industry • Needs substantial cash to improve its position • Slow progress on experience curve • Increase sales (limit to niche or increase market share (limit to niche) • Leave market
  • 7.
    Cash Cow • • • • Leader inmature or declining industry Can generate funds for other SBUs Maintain market share e.g. ensure quality, build customer loyalty, develop substitute brands Maximize Cash Flow e.g. increase usage rate, rate of replacement, modify expense structure, raise prices
  • 8.
    Dogs • Low marketshare in a mature or declining industry • Slow progress on experience curve • Cost disadvantages and few growth opportunities • Harvest or Divest • Concentrate on niches requiring limited effort
  • 9.
    Market Growth Rate TheBoston Consulting Group’s Growth-Share Matrix 20%18%16%14%12%10%8%6%4%2%0 10x 4x 2x 1.5x 1x .5x .4x .3x .2x .1x Relative Market Share
  • 10.
    Strategy Implications BCG •Star – Leader in Expanding Industry – BUILD - Continue to increase market share – if necessary at expense of short-term earnings • Problem Child – Low market share in Expanding Industry – HARVEST if weak, BUILD if strong. – Assess chances of dominating segment. If good, go after share. If bad, redefine business or withdraw.
  • 11.
    Strategy Implications BCG •Cash Cow – Leader in mature or declining industry – HOLD - Maintain share and cost leadership until further investment becomes marginal – Maximize cash flow • Dogs – Low market share in a mature or declining industry – DIVEST Plan an orderly withdrawal so as to maximize cash flow or concentrate on niches that require limited effort
  • 12.
    Assumptions of Growth/Share Matrix • High market share generates cash revenues ? • High Market growth uses more cash resources ?
  • 13.
    Issues with Growth/ShareMatrix • Market growth is not the only factor related to cash usage. • Market growth is not necessarily related to cash usage. • Market share is not necessarily related cash generation. • Multiple factors lead to profitability. • Cash is not the only factor in evaluating a portfolio.
  • 14.
    Issues With Growth/Share Matrix •Limited to industries where experience curve is relevant • Appropriate for volume industries • Overlooks perils of growth • Measurement problems • Product-market definition problems • Difficult to implement strategies