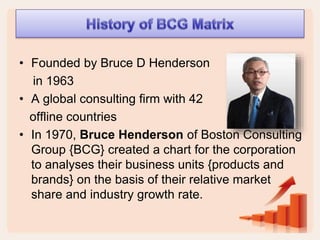
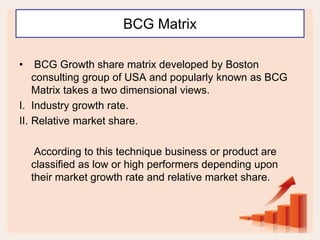
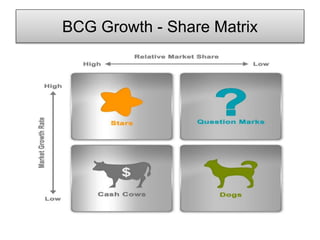
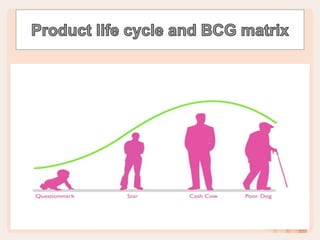
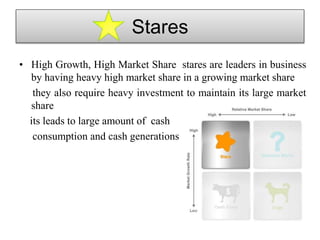
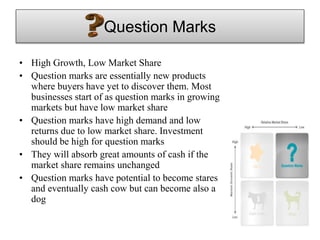
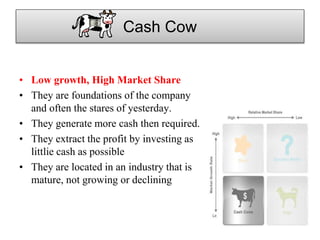
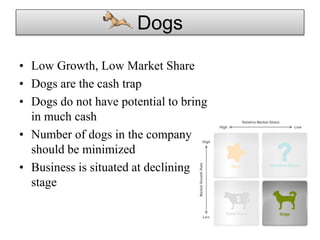
1
To Our Presentation
Boston consulting group
(BCG Matrix )
Daffodil International University
(Uttara Campus)
International HRM
Semester Spring-2015
Presented by-
Name ID No.
Md .Toufique Hasan 141 -14 - 505
Md. Hedayetul Islam 141 - 14 - 512
Mohiuddin Majumder 141 - 14 - 513
Md. Abdul Khaleque 141 -14 - 514
• Founded by Bruce D Henderson
in 1963
• A global consulting firm with 42
offline countries
• In 1970, Bruce Henderson of Boston Consulting
Group {BCG} created a chart for the corporation
to analyses their business units {products and
brands} on the basis of their relative market
share and industry growth rate.
BCG Matrix
• BCG Growth share matrix developed by Boston
consulting group of USA and popularly known as BCG
Matrix takes a two dimensional views.
I. Industry growth rate.
II. Relative market share.
According to this technique business or product are
classified as low or high performers depending upon
their market growth rate and relative market share.
BCG Growth - Share Matrix
Relative market share and market
growth
Market share
• Market Share is the percentage of the business
unit sales to the total market that is being
services by your company measured either in
revenue terms or unit volume terms. In indicate
the business unit strength
MS= Business Unit Sales This Year
Total Market Size
MS= Market Share
Relative market share
• Is the percentage of the business unit
sales to the highest competitors sales
measured either in revenue terms or
unit volume terms it indicate the
business unit strength
• RMS= (business unit sale this year)
leading competitor sales this year
RMS= Relative Market Share
Market Growth Rate
• Market growth is used as a measure
of a market’s attractiveness
• Market experiencing high growth
are ones where the total market
share available is expanding and
threes plenty of opportunity for
everyone to make money.
MGR= (total market sales this year) – (total market sales this year)
total market sales last year
It is portfolio planning model which is based on
the observation that company’s business unit
can be classified in to four categories .
• Question Marks
• Stars
• Cash cows
• Dogs
It is based on the combination of market
growth & market share relative to the next
based competitor.
Stares
• High Growth, High Market Share stares are leaders in business
by having heavy high market share in a growing market share
they also require heavy investment to maintain its large market
share
its leads to large amount of cash
consumption and cash generations
Question Marks
• High Growth, Low Market Share
• Question marks are essentially new products
where buyers have yet to discover them. Most
businesses start of as question marks in growing
markets but have low market share
• Question marks have high demand and low
returns due to low market share. Investment
should be high for question marks
• They will absorb great amounts of cash if the
market share remains unchanged
• Question marks have potential to become stares
and eventually cash cow but can become also a
dog
Cash Cow
• Low growth, High Market Share
• They are foundations of the company
and often the stares of yesterday.
• They generate more cash then required.
• They extract the profit by investing as
littlie cash as possible
• They are located in an industry that is
mature, not growing or declining
Dogs
• Low Growth, Low Market Share
• Dogs are the cash trap
• Dogs do not have potential to bring
in much cash
• Number of dogs in the company
should be minimized
• Business is situated at declining
stage
Why bcg matrix
To asses
• Profile of product /business
• Cash demands of products
• The development cycle of product
• Resource allocation & divestment decisions
Main Steps in BCG Matrix
• Identify and dividing company into SBU.
• Assessing and comparing the prospects of each SBU
according to criteria:
SBU’s relative market share
Growth rate of SBUs industry
• Classifying the SBU’s on the basis on the BCG
Matrix
• Developing Strategic objective for each SBU.
Benefits
• BCG matrix is simple & easy to
understand
• It helps to quickly & simply screen the
opportunity open to you, & help you think
about how you can make the most of
them.
• It is used to identify how corporate cash
resources can best be used to maximize
company’s future growth & profitability.
Limitation
• BCG matrix uses only two dimensions relative
market share & market growth rate.
• Problem of getting data on market share &
market growth
• High market share does not mean profits all
time.
• Business with market share can be profitable
too.
Conclusion
• Though BCG Matrix has its limitations it is one of the
most famous and simple portfolio planning matrix,
used by large companies having multi-products.
• As long as management understands that the BCG
growth/Share Matrix generates option which is
require further analysis and validation, this tool can
greatly enhance strategic decision making.
Bcg matrix - ( international hrm )

Bcg matrix - ( international hrm )

  • 1.
  • 2.
    Boston consulting group (BCGMatrix ) Daffodil International University (Uttara Campus) International HRM Semester Spring-2015
  • 3.
    Presented by- Name IDNo. Md .Toufique Hasan 141 -14 - 505 Md. Hedayetul Islam 141 - 14 - 512 Mohiuddin Majumder 141 - 14 - 513 Md. Abdul Khaleque 141 -14 - 514
  • 5.
    • Founded byBruce D Henderson in 1963 • A global consulting firm with 42 offline countries • In 1970, Bruce Henderson of Boston Consulting Group {BCG} created a chart for the corporation to analyses their business units {products and brands} on the basis of their relative market share and industry growth rate.
  • 6.
    BCG Matrix • BCGGrowth share matrix developed by Boston consulting group of USA and popularly known as BCG Matrix takes a two dimensional views. I. Industry growth rate. II. Relative market share. According to this technique business or product are classified as low or high performers depending upon their market growth rate and relative market share.
  • 7.
    BCG Growth -Share Matrix
  • 8.
    Relative market shareand market growth
  • 9.
    Market share • MarketShare is the percentage of the business unit sales to the total market that is being services by your company measured either in revenue terms or unit volume terms. In indicate the business unit strength MS= Business Unit Sales This Year Total Market Size MS= Market Share
  • 10.
    Relative market share •Is the percentage of the business unit sales to the highest competitors sales measured either in revenue terms or unit volume terms it indicate the business unit strength • RMS= (business unit sale this year) leading competitor sales this year RMS= Relative Market Share
  • 11.
    Market Growth Rate •Market growth is used as a measure of a market’s attractiveness • Market experiencing high growth are ones where the total market share available is expanding and threes plenty of opportunity for everyone to make money. MGR= (total market sales this year) – (total market sales this year) total market sales last year
  • 13.
    It is portfolioplanning model which is based on the observation that company’s business unit can be classified in to four categories . • Question Marks • Stars • Cash cows • Dogs It is based on the combination of market growth & market share relative to the next based competitor.
  • 15.
    Stares • High Growth,High Market Share stares are leaders in business by having heavy high market share in a growing market share they also require heavy investment to maintain its large market share its leads to large amount of cash consumption and cash generations
  • 16.
    Question Marks • HighGrowth, Low Market Share • Question marks are essentially new products where buyers have yet to discover them. Most businesses start of as question marks in growing markets but have low market share • Question marks have high demand and low returns due to low market share. Investment should be high for question marks • They will absorb great amounts of cash if the market share remains unchanged • Question marks have potential to become stares and eventually cash cow but can become also a dog
  • 17.
    Cash Cow • Lowgrowth, High Market Share • They are foundations of the company and often the stares of yesterday. • They generate more cash then required. • They extract the profit by investing as littlie cash as possible • They are located in an industry that is mature, not growing or declining
  • 18.
    Dogs • Low Growth,Low Market Share • Dogs are the cash trap • Dogs do not have potential to bring in much cash • Number of dogs in the company should be minimized • Business is situated at declining stage
  • 19.
    Why bcg matrix Toasses • Profile of product /business • Cash demands of products • The development cycle of product • Resource allocation & divestment decisions
  • 20.
    Main Steps inBCG Matrix • Identify and dividing company into SBU. • Assessing and comparing the prospects of each SBU according to criteria: SBU’s relative market share Growth rate of SBUs industry • Classifying the SBU’s on the basis on the BCG Matrix • Developing Strategic objective for each SBU.
  • 21.
    Benefits • BCG matrixis simple & easy to understand • It helps to quickly & simply screen the opportunity open to you, & help you think about how you can make the most of them. • It is used to identify how corporate cash resources can best be used to maximize company’s future growth & profitability.
  • 22.
    Limitation • BCG matrixuses only two dimensions relative market share & market growth rate. • Problem of getting data on market share & market growth • High market share does not mean profits all time. • Business with market share can be profitable too.
  • 23.
    Conclusion • Though BCGMatrix has its limitations it is one of the most famous and simple portfolio planning matrix, used by large companies having multi-products. • As long as management understands that the BCG growth/Share Matrix generates option which is require further analysis and validation, this tool can greatly enhance strategic decision making.