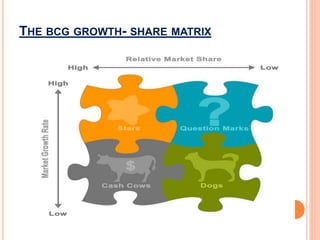
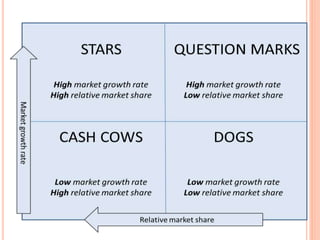
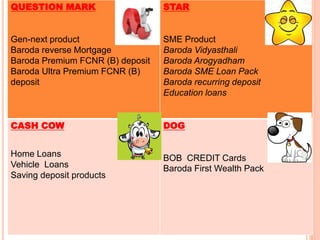
BCG MATRIX
BCG ( BOSTON CONSULTING GROUP)
MATRIX
 Matrix was created by Bruce D. Henderson for the
Boston Consulting Group in 1970 to help analyze
their product line.
 This helps the company allocate resources and is
used as an analytical tool in brand marketing, product
management, strategic management, and portfolio
analysis.
The BCG matrix is based on the product life cycle theory
that can be used to determine what priorities should be
given in the product portfolio of a business. To ensure
long term creation, a company should have a portfolio
that contains both high-growth products in need of cash
inputs and low-growth products that generate a lot of
cash.
It has 2 dimensions : market share and market growth.
The basic idea behind it is that the bigger the market
share a product has or the faster the product market
grows the better it is for the company.
RELATIVE MARKET SHARE
Market share is the percentage of the total market that is
being serviced by our company measured either in the
terms of revenue or in unit terms.
The selection of the relative market share metric was
based upon its relationship to the experience curve.
Another reason for choosing relative market share,
rather than just profits, is that it carries more
information than just cash flow. It shows where the
brand is positioned against its main competitors, and
indicates where it might be likely to go in the future.
MARKET GROWTH RATE
Market growth is used as a measure of a
market’s attractiveness.
Markets experiencing high growth are ones
where the total market share available is
expanding and there is plenty of opportunities
for everyone to make money.
THE BCG GROWTH- SHARE MATRIX
Placing products in BCG matrix results in four
categories in a portfolio of company:
 Stars
 Cash cows
 Dogs
 Question marks
QUESTION MARKS
 Also known as problem children are
businesses operating with a low market share
in a high growth market.
 They are a starting point for most businesses.
 They have a potential to gain market share
and become stars, and eventually cash cows
when market growth slows. If question marks
do not succeed in becoming a market leader,
then after perhaps years of cash
consumption, they will degenerate into dogs
when market growth declines.
 Question marks must be analyzed carefully
in order to determine whether they are worth
the investment required to grow market
share.
STARS
 Stars are units with a high market share in a
fast-growing industry.
 Stars require high funding to fight
competitions and maintain a growth rate.
 It leads to high amount of cash consumption
and cash generation.
 When industry growth slows, if they remain a
niche leader or are amongst market leaders
they have been able to maintain their
category leadership stars become cash cows,
else they become dogs due to low relative
market share.
 Attempts should be made to hold the maket
share otherwise the star will become a cash
cow.
CASH COWS
 Cash cows is where a company has high
market share in a slow-growing industry.
 They are foundation of the company and often
the stars of the yesterday.
 These units typically generate cash in excess
of the amount of cash needed to maintain the
business.
 They are regarded as staid and boring, in a
"mature" market, yet corporations value
owning them due to their cash generating
qualities.
 They are to be "milked" continuously with as
little investment as possible, since such
investment would be wasted in an industry
with low growth.
DOGS
 Dogs, more charitably called pets, are units
with low market share in a mature, slow-
growing industry.
 These units typically "break even", generating
barely enough cash to maintain the business's
market share.
 Though owning a break-even unit provides the
social benefit of providing jobs and possible
synergies that assist other business units,
from an accounting point of view such a unit is
worthless, not generating cash for the
company.
 They depress a profitable company's return on
assets
 ratio, used by many investors to judge how
well a company is being managed. Dogs, it is
thought, should be sold off.
As a particular industry matures and its growth slows, all business
units become either cash cows or dogs. The natural cycle for most
business units is that they start as question marks, then turn
into stars. Eventually the market stops growing thus the business
unit becomes a cash cow. At the end of the cycle the cash cow turns
into a dog.
As BCG stated in 1970:
Only a diversified company with a balanced portfolio can use its
strengths to truly capitalize on its growth opportunities. The
balanced portfolio has:
 stars whose high share and high growth assure the future;
 cash cows that supply funds for that future growth; and
 question marks to be converted into stars with the added funds.
WHY BCG MATRIX ?
To assess
 Profile of product/ business
 Cash demands of products
 The development cycle of product
 Resource allocation and disvestment decision
BENEFITS OF BCG MATRIX
 The BCG-Matrix is helpful for managers to evaluate
balance in the companies' current portfolio of Stars,
Cash Cows, Question Marks and Dogs.
 BCG-Matrix is applicable to large companies that seek
volume and experience effects.
 The model is simple and easy to understand.
 It provides a base for management to decide and prepare
for future actions.
 If a company is able to use the experience curve to its
advantage, it should be able to manufacture and sell
new products at a price that is low enough to get early
market share leadership. Once it becomes a star, it is
destined to be profitable.
LIMITATIONS OF BCG MATRIX
 It neglects the effects of synergies between business units.
 High market share is not the only success factor.
 Market growth is not the only indicator for attractiveness of a
market.
 Sometimes Dogs can earn even more cash as Cash Cows.
 The problems of getting data on the market share and market
growth.
 There is no clear definition of what constitutes a “market”.
 A high market share does not necessarily lead to profitability
all the time.
 The model uses only two dimensions – market share and
growth rate. This may tempt management to emphasize a
particular product, or todivest prematurely.
 A business with a low market share can be profitable too.
 The model neglects small competitors that have fast growing
market shares.
BCG MATRIX OF
BANK OF BARODA
QUESTION MARK
Gen-next product
Baroda reverse Mortgage
Baroda Premium FCNR (B) deposit
Baroda Ultra Premium FCNR (B)
deposit
STAR
SME Product
Baroda Vidyasthali
Baroda Arogyadham
Baroda SME Loan Pack
Baroda recurring deposit
Education loans
CASH COW
Home Loans
Vehicle Loans
Saving deposit products
DOG
BOB CREDIT Cards
Baroda First Wealth Pack
Presented by:
AKANKSHA VERMA
BHAVESH TAMBI

bcg matrix.pptx

  • 1.
  • 2.
    BCG ( BOSTONCONSULTING GROUP) MATRIX  Matrix was created by Bruce D. Henderson for the Boston Consulting Group in 1970 to help analyze their product line.  This helps the company allocate resources and is used as an analytical tool in brand marketing, product management, strategic management, and portfolio analysis.
  • 3.
    The BCG matrixis based on the product life cycle theory that can be used to determine what priorities should be given in the product portfolio of a business. To ensure long term creation, a company should have a portfolio that contains both high-growth products in need of cash inputs and low-growth products that generate a lot of cash. It has 2 dimensions : market share and market growth. The basic idea behind it is that the bigger the market share a product has or the faster the product market grows the better it is for the company.
  • 4.
    RELATIVE MARKET SHARE Marketshare is the percentage of the total market that is being serviced by our company measured either in the terms of revenue or in unit terms. The selection of the relative market share metric was based upon its relationship to the experience curve. Another reason for choosing relative market share, rather than just profits, is that it carries more information than just cash flow. It shows where the brand is positioned against its main competitors, and indicates where it might be likely to go in the future.
  • 5.
    MARKET GROWTH RATE Marketgrowth is used as a measure of a market’s attractiveness. Markets experiencing high growth are ones where the total market share available is expanding and there is plenty of opportunities for everyone to make money.
  • 7.
    THE BCG GROWTH-SHARE MATRIX
  • 9.
    Placing products inBCG matrix results in four categories in a portfolio of company:  Stars  Cash cows  Dogs  Question marks
  • 11.
    QUESTION MARKS  Alsoknown as problem children are businesses operating with a low market share in a high growth market.  They are a starting point for most businesses.  They have a potential to gain market share and become stars, and eventually cash cows when market growth slows. If question marks do not succeed in becoming a market leader, then after perhaps years of cash consumption, they will degenerate into dogs when market growth declines.  Question marks must be analyzed carefully in order to determine whether they are worth the investment required to grow market share.
  • 12.
    STARS  Stars areunits with a high market share in a fast-growing industry.  Stars require high funding to fight competitions and maintain a growth rate.  It leads to high amount of cash consumption and cash generation.  When industry growth slows, if they remain a niche leader or are amongst market leaders they have been able to maintain their category leadership stars become cash cows, else they become dogs due to low relative market share.  Attempts should be made to hold the maket share otherwise the star will become a cash cow.
  • 13.
    CASH COWS  Cashcows is where a company has high market share in a slow-growing industry.  They are foundation of the company and often the stars of the yesterday.  These units typically generate cash in excess of the amount of cash needed to maintain the business.  They are regarded as staid and boring, in a "mature" market, yet corporations value owning them due to their cash generating qualities.  They are to be "milked" continuously with as little investment as possible, since such investment would be wasted in an industry with low growth.
  • 14.
    DOGS  Dogs, morecharitably called pets, are units with low market share in a mature, slow- growing industry.  These units typically "break even", generating barely enough cash to maintain the business's market share.  Though owning a break-even unit provides the social benefit of providing jobs and possible synergies that assist other business units, from an accounting point of view such a unit is worthless, not generating cash for the company.  They depress a profitable company's return on assets  ratio, used by many investors to judge how well a company is being managed. Dogs, it is thought, should be sold off.
  • 15.
    As a particularindustry matures and its growth slows, all business units become either cash cows or dogs. The natural cycle for most business units is that they start as question marks, then turn into stars. Eventually the market stops growing thus the business unit becomes a cash cow. At the end of the cycle the cash cow turns into a dog. As BCG stated in 1970: Only a diversified company with a balanced portfolio can use its strengths to truly capitalize on its growth opportunities. The balanced portfolio has:  stars whose high share and high growth assure the future;  cash cows that supply funds for that future growth; and  question marks to be converted into stars with the added funds.
  • 16.
    WHY BCG MATRIX? To assess  Profile of product/ business  Cash demands of products  The development cycle of product  Resource allocation and disvestment decision
  • 17.
    BENEFITS OF BCGMATRIX  The BCG-Matrix is helpful for managers to evaluate balance in the companies' current portfolio of Stars, Cash Cows, Question Marks and Dogs.  BCG-Matrix is applicable to large companies that seek volume and experience effects.  The model is simple and easy to understand.  It provides a base for management to decide and prepare for future actions.  If a company is able to use the experience curve to its advantage, it should be able to manufacture and sell new products at a price that is low enough to get early market share leadership. Once it becomes a star, it is destined to be profitable.
  • 18.
    LIMITATIONS OF BCGMATRIX  It neglects the effects of synergies between business units.  High market share is not the only success factor.  Market growth is not the only indicator for attractiveness of a market.  Sometimes Dogs can earn even more cash as Cash Cows.  The problems of getting data on the market share and market growth.  There is no clear definition of what constitutes a “market”.  A high market share does not necessarily lead to profitability all the time.  The model uses only two dimensions – market share and growth rate. This may tempt management to emphasize a particular product, or todivest prematurely.  A business with a low market share can be profitable too.  The model neglects small competitors that have fast growing market shares.
  • 19.
  • 20.
    QUESTION MARK Gen-next product Barodareverse Mortgage Baroda Premium FCNR (B) deposit Baroda Ultra Premium FCNR (B) deposit STAR SME Product Baroda Vidyasthali Baroda Arogyadham Baroda SME Loan Pack Baroda recurring deposit Education loans CASH COW Home Loans Vehicle Loans Saving deposit products DOG BOB CREDIT Cards Baroda First Wealth Pack
  • 21.

Editor's Notes