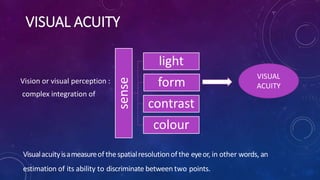
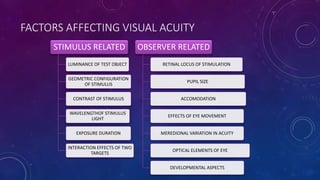
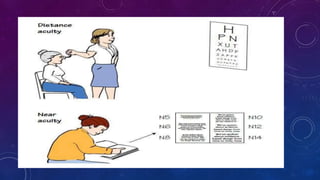
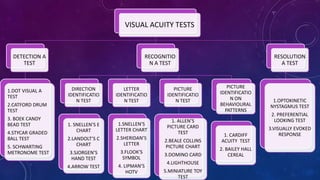
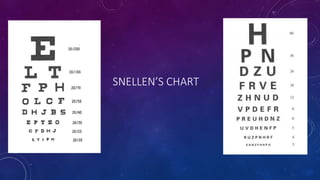
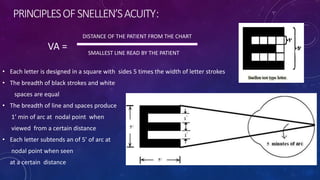
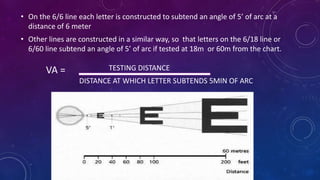
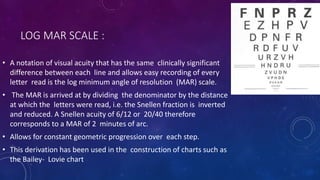
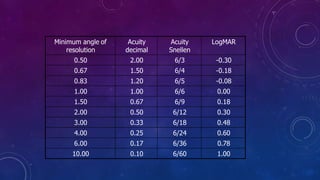
Visual acuity is a measure of the eye's ability to see fine detail and discriminate between objects. It is assessed using charts with letters, symbols, or pictures of decreasing size. The Snellen chart is commonly used, with visual acuity recorded as the distance at which a person can see a symbol subtending an angle of 5 minutes of arc. Other methods include the Landolt C chart and LogMAR chart. Visual acuity depends on factors like stimulus characteristics, retinal location stimulated, and optical elements of the eye. It provides information on visual function, refractive status, and outcomes of treatments.
This presentation gives a brief idea about angle of anterior chamber along with its structures and diagnostic methods to grade and visualize the structures.
Aphakia and its causes. Correction of Aphakia. Advantages and disadvantages of different corrections. Surgeries and related signs and symptoms of aphakia. Complications related to Aphakia.
VISUAL ACUITY , Basics of vision assessmentssuserde6356
Visual acuity (VA) is a measure of the ability of the eye to distinguish shapes and the details of objects at a given distance. It is important to assess VA in a consistent way in order to detect any changes in vision. One eye is tested at a time.
Go to:
Indications
To provide a baseline recording of VA
To aid examination and diagnosis of eye disease or refractive error
To assess any changes in vision
To measure the outcomes of cataract or other surgery.
Go to:
Equipment
Multi-letter Snellen or E chart
Plain occluder, card or tissue
Pinhole occluder
Torch or flashlight
Patient's documentation.
Go to:
Procedure
Ensure good natural light or illumination on the chart. It is important to ensure that the person has the best possible chance of seeing and reading the test chart as treatment decisions are made based on the results of VA testing.
If the test is done outdoors, the chart should be in bright light and the patient in the shade, with enough light to illuminate the patient's face during the test.
Explain the procedure to the patient. Tell patients that it is not a test that they have to pass, but a test to help us know how their eyes are working. Tell them not to guess if they cannot see.
Ensure that any equipment that the patient touches is clean and is cleaned between patients. Infections can be passed between patients if equipment – or the testers' hands – are not clean.
Position the patient, sitting or standing, at a distance of 6 metres from the chart. The patient can hold one end of a cord or rope of 6 metres long to ensure that the distance is maintained
Test the eyes one at a time, at first without any spectacles (if worn).
Note: Some people prefer to always test the right eye first. Others prefer to test the ‘worse’ eye first (ask the patient out of which eye they see best). This ensures that the minimum is read with the ‘worse’ eye, and more will be read with the ‘good’ eye. This means that no letters are remembered, which could make the second visual acuity appear better than it is.
An external file that holds a picture, illustration, etc.
Object name is jceh_27_85_016_f04.jpg
Visual acuity should be measured from a standard distance, using a standard chart with a white background
Ask the patient to cover one eye with a plain occluder, card or tissue. They should not press on the eye; this is not good for an eye that has undergone surgery. It can also make any subsequent intraocular pressure reading inaccurate and it will distort vision when the occluded eye is tested.
Ask the patient to read from the top of the chart and from left to right. If the patient cannot read the letters due to language difficulties, use an E chart. The patient is asked to point in the direction the ‘legs’ of the E are facing.
Note: there is a one in four chance that the patient can guess the direction; therefore it is recommended that the patient should correctly indicate the orientation of most letters of the same size, e.g. four out of five or five out
Title: Sense of Taste
Presenter: Dr. Faiza, Assistant Professor of Physiology
Qualifications:
MBBS (Best Graduate, AIMC Lahore)
FCPS Physiology
ICMT, CHPE, DHPE (STMU)
MPH (GC University, Faisalabad)
MBA (Virtual University of Pakistan)
Learning Objectives:
Describe the structure and function of taste buds.
Describe the relationship between the taste threshold and taste index of common substances.
Explain the chemical basis and signal transduction of taste perception for each type of primary taste sensation.
Recognize different abnormalities of taste perception and their causes.
Key Topics:
Significance of Taste Sensation:
Differentiation between pleasant and harmful food
Influence on behavior
Selection of food based on metabolic needs
Receptors of Taste:
Taste buds on the tongue
Influence of sense of smell, texture of food, and pain stimulation (e.g., by pepper)
Primary and Secondary Taste Sensations:
Primary taste sensations: Sweet, Sour, Salty, Bitter, Umami
Chemical basis and signal transduction mechanisms for each taste
Taste Threshold and Index:
Taste threshold values for Sweet (sucrose), Salty (NaCl), Sour (HCl), and Bitter (Quinine)
Taste index relationship: Inversely proportional to taste threshold
Taste Blindness:
Inability to taste certain substances, particularly thiourea compounds
Example: Phenylthiocarbamide
Structure and Function of Taste Buds:
Composition: Epithelial cells, Sustentacular/Supporting cells, Taste cells, Basal cells
Features: Taste pores, Taste hairs/microvilli, and Taste nerve fibers
Location of Taste Buds:
Found in papillae of the tongue (Fungiform, Circumvallate, Foliate)
Also present on the palate, tonsillar pillars, epiglottis, and proximal esophagus
Mechanism of Taste Stimulation:
Interaction of taste substances with receptors on microvilli
Signal transduction pathways for Umami, Sweet, Bitter, Sour, and Salty tastes
Taste Sensitivity and Adaptation:
Decrease in sensitivity with age
Rapid adaptation of taste sensation
Role of Saliva in Taste:
Dissolution of tastants to reach receptors
Washing away the stimulus
Taste Preferences and Aversions:
Mechanisms behind taste preference and aversion
Influence of receptors and neural pathways
Impact of Sensory Nerve Damage:
Degeneration of taste buds if the sensory nerve fiber is cut
Abnormalities of Taste Detection:
Conditions: Ageusia, Hypogeusia, Dysgeusia (parageusia)
Causes: Nerve damage, neurological disorders, infections, poor oral hygiene, adverse drug effects, deficiencies, aging, tobacco use, altered neurotransmitter levels
Neurotransmitters and Taste Threshold:
Effects of serotonin (5-HT) and norepinephrine (NE) on taste sensitivity
Supertasters:
25% of the population with heightened sensitivity to taste, especially bitterness
Increased number of fungiform papillae
NVBDCP.pptx Nation vector borne disease control programSapna Thakur
NVBDCP was launched in 2003-2004 . Vector-Borne Disease: Disease that results from an infection transmitted to humans and other animals by blood-feeding arthropods, such as mosquitoes, ticks, and fleas. Examples of vector-borne diseases include Dengue fever, West Nile Virus, Lyme disease, and malaria.
Flu Vaccine Alert in Bangalore Karnatakaaddon Scans
As flu season approaches, health officials in Bangalore, Karnataka, are urging residents to get their flu vaccinations. The seasonal flu, while common, can lead to severe health complications, particularly for vulnerable populations such as young children, the elderly, and those with underlying health conditions.
Dr. Vidisha Kumari, a leading epidemiologist in Bangalore, emphasizes the importance of getting vaccinated. "The flu vaccine is our best defense against the influenza virus. It not only protects individuals but also helps prevent the spread of the virus in our communities," he says.
This year, the flu season is expected to coincide with a potential increase in other respiratory illnesses. The Karnataka Health Department has launched an awareness campaign highlighting the significance of flu vaccinations. They have set up multiple vaccination centers across Bangalore, making it convenient for residents to receive their shots.
To encourage widespread vaccination, the government is also collaborating with local schools, workplaces, and community centers to facilitate vaccination drives. Special attention is being given to ensuring that the vaccine is accessible to all, including marginalized communities who may have limited access to healthcare.
Residents are reminded that the flu vaccine is safe and effective. Common side effects are mild and may include soreness at the injection site, mild fever, or muscle aches. These side effects are generally short-lived and far less severe than the flu itself.
Healthcare providers are also stressing the importance of continuing COVID-19 precautions. Wearing masks, practicing good hand hygiene, and maintaining social distancing are still crucial, especially in crowded places.
Protect yourself and your loved ones by getting vaccinated. Together, we can help keep Bangalore healthy and safe this flu season. For more information on vaccination centers and schedules, residents can visit the Karnataka Health Department’s official website or follow their social media pages.
Stay informed, stay safe, and get your flu shot today!
HOT NEW PRODUCT! BIG SALES FAST SHIPPING NOW FROM CHINA!! EU KU DB BK substit...GL Anaacs
Contact us if you are interested:
Email / Skype : kefaya1771@gmail.com
Threema: PXHY5PDH
New BATCH Ku !!! MUCH IN DEMAND FAST SALE EVERY BATCH HAPPY GOOD EFFECT BIG BATCH !
Contact me on Threema or skype to start big business!!
Hot-sale products:
NEW HOT EUTYLONE WHITE CRYSTAL!!
5cl-adba precursor (semi finished )
5cl-adba raw materials
ADBB precursor (semi finished )
ADBB raw materials
APVP powder
5fadb/4f-adb
Jwh018 / Jwh210
Eutylone crystal
Protonitazene (hydrochloride) CAS: 119276-01-6
Flubrotizolam CAS: 57801-95-3
Metonitazene CAS: 14680-51-4
Payment terms: Western Union,MoneyGram,Bitcoin or USDT.
Deliver Time: Usually 7-15days
Shipping method: FedEx, TNT, DHL,UPS etc.Our deliveries are 100% safe, fast, reliable and discreet.
Samples will be sent for your evaluation!If you are interested in, please contact me, let's talk details.
We specializes in exporting high quality Research chemical, medical intermediate, Pharmaceutical chemicals and so on. Products are exported to USA, Canada, France, Korea, Japan,Russia, Southeast Asia and other countries.
ARTIFICIAL INTELLIGENCE IN HEALTHCARE.pdfAnujkumaranit
Artificial intelligence (AI) refers to the simulation of human intelligence processes by machines, especially computer systems. It encompasses tasks such as learning, reasoning, problem-solving, perception, and language understanding. AI technologies are revolutionizing various fields, from healthcare to finance, by enabling machines to perform tasks that typically require human intelligence.
New Drug Discovery and Development .....NEHA GUPTA
The "New Drug Discovery and Development" process involves the identification, design, testing, and manufacturing of novel pharmaceutical compounds with the aim of introducing new and improved treatments for various medical conditions. This comprehensive endeavor encompasses various stages, including target identification, preclinical studies, clinical trials, regulatory approval, and post-market surveillance. It involves multidisciplinary collaboration among scientists, researchers, clinicians, regulatory experts, and pharmaceutical companies to bring innovative therapies to market and address unmet medical needs.
Title: Sense of Smell
Presenter: Dr. Faiza, Assistant Professor of Physiology
Qualifications:
MBBS (Best Graduate, AIMC Lahore)
FCPS Physiology
ICMT, CHPE, DHPE (STMU)
MPH (GC University, Faisalabad)
MBA (Virtual University of Pakistan)
Learning Objectives:
Describe the primary categories of smells and the concept of odor blindness.
Explain the structure and location of the olfactory membrane and mucosa, including the types and roles of cells involved in olfaction.
Describe the pathway and mechanisms of olfactory signal transmission from the olfactory receptors to the brain.
Illustrate the biochemical cascade triggered by odorant binding to olfactory receptors, including the role of G-proteins and second messengers in generating an action potential.
Identify different types of olfactory disorders such as anosmia, hyposmia, hyperosmia, and dysosmia, including their potential causes.
Key Topics:
Olfactory Genes:
3% of the human genome accounts for olfactory genes.
400 genes for odorant receptors.
Olfactory Membrane:
Located in the superior part of the nasal cavity.
Medially: Folds downward along the superior septum.
Laterally: Folds over the superior turbinate and upper surface of the middle turbinate.
Total surface area: 5-10 square centimeters.
Olfactory Mucosa:
Olfactory Cells: Bipolar nerve cells derived from the CNS (100 million), with 4-25 olfactory cilia per cell.
Sustentacular Cells: Produce mucus and maintain ionic and molecular environment.
Basal Cells: Replace worn-out olfactory cells with an average lifespan of 1-2 months.
Bowman’s Gland: Secretes mucus.
Stimulation of Olfactory Cells:
Odorant dissolves in mucus and attaches to receptors on olfactory cilia.
Involves a cascade effect through G-proteins and second messengers, leading to depolarization and action potential generation in the olfactory nerve.
Quality of a Good Odorant:
Small (3-20 Carbon atoms), volatile, water-soluble, and lipid-soluble.
Facilitated by odorant-binding proteins in mucus.
Membrane Potential and Action Potential:
Resting membrane potential: -55mV.
Action potential frequency in the olfactory nerve increases with odorant strength.
Adaptation Towards the Sense of Smell:
Rapid adaptation within the first second, with further slow adaptation.
Psychological adaptation greater than receptor adaptation, involving feedback inhibition from the central nervous system.
Primary Sensations of Smell:
Camphoraceous, Musky, Floral, Pepperminty, Ethereal, Pungent, Putrid.
Odor Detection Threshold:
Examples: Hydrogen sulfide (0.0005 ppm), Methyl-mercaptan (0.002 ppm).
Some toxic substances are odorless at lethal concentrations.
Characteristics of Smell:
Odor blindness for single substances due to lack of appropriate receptor protein.
Behavioral and emotional influences of smell.
Transmission of Olfactory Signals:
From olfactory cells to glomeruli in the olfactory bulb, involving lateral inhibition.
Primitive, less old, and new olfactory systems with different path
Tom Selleck Health: A Comprehensive Look at the Iconic Actor’s Wellness Journeygreendigital
Tom Selleck, an enduring figure in Hollywood. has captivated audiences for decades with his rugged charm, iconic moustache. and memorable roles in television and film. From his breakout role as Thomas Magnum in Magnum P.I. to his current portrayal of Frank Reagan in Blue Bloods. Selleck's career has spanned over 50 years. But beyond his professional achievements. fans have often been curious about Tom Selleck Health. especially as he has aged in the public eye.
Follow us on: Pinterest
Introduction
Many have been interested in Tom Selleck health. not only because of his enduring presence on screen but also because of the challenges. and lifestyle choices he has faced and made over the years. This article delves into the various aspects of Tom Selleck health. exploring his fitness regimen, diet, mental health. and the challenges he has encountered as he ages. We'll look at how he maintains his well-being. the health issues he has faced, and his approach to ageing .
Early Life and Career
Childhood and Athletic Beginnings
Tom Selleck was born on January 29, 1945, in Detroit, Michigan, and grew up in Sherman Oaks, California. From an early age, he was involved in sports, particularly basketball. which played a significant role in his physical development. His athletic pursuits continued into college. where he attended the University of Southern California (USC) on a basketball scholarship. This early involvement in sports laid a strong foundation for his physical health and disciplined lifestyle.
Transition to Acting
Selleck's transition from an athlete to an actor came with its physical demands. His first significant role in "Magnum P.I." required him to perform various stunts and maintain a fit appearance. This role, which he played from 1980 to 1988. necessitated a rigorous fitness routine to meet the show's demands. setting the stage for his long-term commitment to health and wellness.
Fitness Regimen
Workout Routine
Tom Selleck health and fitness regimen has evolved. adapting to his changing roles and age. During his "Magnum, P.I." days. Selleck's workouts were intense and focused on building and maintaining muscle mass. His routine included weightlifting, cardiovascular exercises. and specific training for the stunts he performed on the show.
Selleck adjusted his fitness routine as he aged to suit his body's needs. Today, his workouts focus on maintaining flexibility, strength, and cardiovascular health. He incorporates low-impact exercises such as swimming, walking, and light weightlifting. This balanced approach helps him stay fit without putting undue strain on his joints and muscles.
Importance of Flexibility and Mobility
In recent years, Selleck has emphasized the importance of flexibility and mobility in his fitness regimen. Understanding the natural decline in muscle mass and joint flexibility with age. he includes stretching and yoga in his routine. These practices help prevent injuries, improve posture, and maintain mobilit
2. VISUAL ACUITY
Vision or visual perception :
complex integration of
sense
light
form
contrast
colour
VISUAL
ACUITY
Visualacuityisameasureof thespatialresolutionof the eyeor, in other words, an
estimation of its ability to discriminate between two points.
3. THEORIES OF VISUAL ACUITY
1.RECEPTOR THEORY :
• If the image fell on two cones separated by an
unilluminated cone, then the points of light would be
perceived as two distinct sources.
• In terms of length of the retinal image , two points will be seen
clearly when their image size is more than 4.5 μ . ( diameter of
individual cone – 1.5 μ )
• In terms of Visual angle, two adjacent points seen clearly and
discretely when they produce visual angle more than 1 minute.
• VISUAL ANGLE is the angle subtended at NODAL POINT of eye by an
object in visual field.
4. Dimension of the visual angle depends on size of the object and distance from the eye.
5. RAYLEIGH CRITERION
• Two point sources are resolved from each other when separated by at least
the radius of the AIRY DISC.
6. USES :
• 1. Visual function
• 2. Refractive status
• 3. Outcome measure for a treatment
• 4. medico legal purposes
• 5. Criteria for : a. Person’s fitness to drive
b. Eligibility for entrance into a profession
7. COMPONENTS OF VISUAL ACUITY
MINIMUM
VISIBLE
RESOLUTION RECOGNITION
MINIMUM
DISCRIMINABLE
Ability to detect
whether an object
is present in an
otherwise empty
visual field.
Clinically measure
of Visual acuity.
Discrimination of
two spatially
separated targets.
Discrimination of
spatial characteristics
and identifies the
pattern from memory.
Ex: identification of
faces.
Spatial distinction
by an observer
when threshold
lower than
ordinary acuity.
8. 1.MINIMUM VISIBLE
• Minimum visible spatial threshold level depends upon specification of
stimulus--- a.size b.shape c.illumination
• A. black dot against a white background detected if its diameter is of
the order of 30 seconds of arc or more.
• B. Black square against a white background when length of diagonal is
30 seconds.
• C. Visualization of a thin telegraphic wire against a uniform sky with a
thickness of one half second of arc ----- convergence of subthreshold
signals from a number of individual retinal elements , yields a
suprathreshold level of activity.
• D. Detection of an illuminated object against a dark background
depends on its intensity , not size.
9. 2.RESOLUTION (ORDINARY VISUAL ACUITY )
• Discrimination of two spatially separated targets .
• Minimum separation between two points , which can be discriminated ----
MINIMUM RESOLVABLE
• Measurement of the threshold of discrimination is an assessment of function
of fovea centralis.
• Normal angular threshold of discrimination for resolution ------- 30-60
seconds of an arc. (minimum angle of resolution).
10. 3.MINIMUM DISCRIMINABLE (HYPERACUITY)
• Ability to determine whether or not two parallel and straight lines are aligned
in the frontal plane. ( Vernier acuity )
• Threshold value of Vernier acuity : 2-10 seconds of arc .
11. FACTORS AFFECTING VISUAL ACUITY
STIMULUS RELATED
LUMINANCE OF TEST OBJECT
GEOMETRIC CONFIGURATION
OF STIMULUS
CONTRAST OF STIMULUS
WAVELENGTHOF STIMULUS
LIGHT
EXPOSURE DURATION
INTERACTION EFFECTS OF TWO
TARGETS
OBSERVER RELATED
RETINAL LOCUS OF STIMULATION
PUPIL SIZE
ACCOMODATION
EFFECTS OF EYE MOVEMENT
MEREDIONAL VARIATION IN ACUITY
OPTICAL ELEMENTS OF EYE
DEVELOPMENTAL ASPECTS
12.
13.
14. VISUAL ACUITY TESTS
DETECTION A
TEST
1.DOT VISUAL A
TEST
2.CATFORD DRUM
TEST
3. BOEK CANDY
BEAD TEST
4.STYCAR GRADED
BALL TEST
5. SCHWARTING
METRONOME TEST
RECOGNITIO
N A TEST
DIRECTION
IDENTIFICATIO
N TEST
1. SNELLEN’S E
CHART
2.LANDOLT’S C
CHART
3.SJORGEN’S
HAND TEST
4.ARROW TEST
LETTER
IDENTIFICATIO
N TEST
1.SNELLEN’S
LETTER CHART
2.SHERIDAN’S
LETTER
3.FLOOK’S
SYMBOL
4. LIPMAN’S
HOTV
PICTURE
IDENTIFICATIO
N TEST
1. ALLEN’S
PICTURE CARD
TEST
2.BEALE COLLINS
PICTURE CHART
3.DOMINO CARD
4.LIGHTHOUSE
5.MINIATURE TOY
TEST
PICTURE
IDENTIFICATIO
N ON
BEHAVIOURAL
PATTERNS
1. CARDIFF
ACUITY TEST
2. BAILEY HALL
CEREAL
RESOLUTION
A TEST
1.OPTOKINETIC
NYSTAGMUS TEST
2. PREFERENTIAL
LOOKING TEST
3.VISUALLY EVOKED
RESPONSE
15. Commonly used methods for distant visual acuity,
• Snellen’s chart
• Landolt broken ring (or C chart)
• Tumbling E chart
• Bailey – Lovie chart / LogMAR chart
18. PRINCIPLESOFSNELLEN’SACUITY:
• Each letter is designed in a square with sides 5 times the width of letter strokes
• The breadth of black strokes and white
spaces are equal
• The breadth of line and spaces produce
1’ min of arc at nodal point when
viewed from a certain distance
• Each letter subtends an of 5’ of arc at
nodal point when seen
at a certain distance
VA =
DISTANCE OF THE PATIENT FROM THE CHART
SMALLEST LINE READ BY THE PATIENT
19. • On the 6/6 line each letter is constructed to subtend an angle of 5’ of arc at a
distance of 6 meter
• Other lines are constructed in a similar way, so that letters on the 6/18 line or
6/60 line subtend an angle of 5’ of arc if tested at 18m or 60m from the chart.
VA = TESTING DISTANCE
DISTANCE AT WHICH LETTER SUBTENDS 5MIN OF ARC
23. MINIMUM ANGLE OF RESOLUTION :
• The denominator in Snellen grading is an indirect measure of the size of the
letters read and the angle they subtend.
• The classic Snellen fraction is the reciprocal of the minimum angle of
resolution (MAR)
24. LOG MAR SCALE :
• A notation of visual acuity that has the same clinically significant
difference between each line and allows easy recording of every
letter read is the log minimum angle of resolution (MAR) scale.
• The MAR is arrived at by dividing the denominator by the distance
at which the letters were read, i.e. the Snellen fraction is inverted
and reduced. A Snellen acuity of 6/12 or 20/40 therefore
corresponds to a MAR of 2 minutes of arc.
• Allows for constant geometric progression over each step.
• This derivation has been used in the construction of charts such as
the Bailey- Lovie chart
26. PROCEDURE FOR RECORDING VISUAL ACUITY :
• Patient seated at 6m distant from the chart .So light rays are parallel and pt
exerts minimal accommodation
• Chart should be properly illuminated
• The pt is asked to read the chart with each eye separately and VA is recorded
• Depending upon the smallest line that the pt can read from 6m distance,
his/her VA is as 6/6, 6/9, 6/12, 6/18, 6/24, 6/36 and 6/60
• If one cannot see the top line from 6m, pt is asked to slowly walk towards the
chart till can read the top line
• Depending upon the distance at which one can read the top line, the vision is
recorded as 5/60, 4/60, 3/60, 2/60, 1/60
27.
28. • If the patient is unable to read the top line even from 1m, he/she is asked to
count fingers (CF) of the examiner
• His/her VA is recorded as CF-3’, CF-2’, CF-1’ or CF close to face depending
upon the distance at which the pt is able to count fingers
• When the pt fails to count fingers, the examiner should move his/her hand
close to pt’s face
• If pt can appreciate the hand movements, the VA is recorded as HM+
• If pt cannot distinguish hand movements, the examiner should test whether
the pt can perceive light or not
• If yes, vision is recorded as PL+ and if not it is recorded as PL- .
• PL+ pts must be tested with projection of rays to represent quadrants - nasal,
superior, temporal and inferior
• Then VA is recorded as PL+, PR
29. PIN HOLE VISUAL ACUITY
• If the vision is subnormal, the visual acuity is again determined by asking
the patient to read the letters through a pinhole.
• To determine if a decrease in vision is correctable by lenses
30. BCVA
To determine the function of the macula in the best optical conditions, the
refraction of the eye must be determined and the visual acuity assessed again
in the same way with the correcting glasses in place.
31. DENSE CATARACT
• LASER INTERFEROMETER forms a diffraction pattern of parallel lines on
the retina even through a moderate cataract. The patient is asked to identify
the orientation of progressively finer lines, to establish the visual acuity likely
to be regained after surgery.
• POTENTIAL ACUITY METER
projects a tiny Snellen chart onto the retina around a lens opacity and the
patient is required to read the alphabets
33. YOUNG CHILDREN
• Maturation of infant visual function has been studied by two
techniques, the pattern visual evoked potential and preferential
looking behaviour.
• In children younger than 2 years the VEP test proves more
successful .
34. Preferential Looking (Keeler / Teller Cards)
Given a choice, an infant prefers to look at patterned rather than unpatterned stimuli.
The infant's preference may be quantified by incorporating patterns which vary in
stripe width.
36. NEAR VISUAL ACUITY
PROCEDURE :
• The pt is comfortably seat in a chair and asked to read the near vision chart
kept in a distance of 33 – 40 cm
• Good illumination thrown over from his/her back preferably over left
shoulder
• Each eye should be tested separately
• The near vision is recorded as the smallest type that can be read comfortably
by the patient as N5, N6, N8, N10, N12, N14, N18, N24, N36 and N48
• Notation is made as NV = N5 at 30cm
37. NEAR VISION CHARTS :
• Roman test types
• Snellen’s near vision test type
• Jager’s chart
• The purpose is to detect people with near vision difficulties (e.g., uncorrected
high hyperopia, accommodative dysfunction)
• In patients over 40 years old, the reduced near visual acuity is one of the
symptoms of presbyopia
38. PHOTOSTRESS TEST
• The extent of involvement can be assessed clinically by recording vision before
and after exposure to a bright light or photostress.
• The photostress test is performed by covering one eye and asking the patient to
read the smallest possible line on the near chart. A bright light is shone into the
eye for 15 seconds, following which the patient is asked to read the same line of
print and the recovery time noted. The test is repeated with the other eye.
• In normal people and those with optic nerve disease there is no significant
difference in the time taken for the two eyes to recover from the photo stress.
• In a subject with macular disease the recovery time is prolonged.
• The test is useful in early macular disease, particularly central serous
retinopathy, where there may be minimal deterioration in visual acuity and yet
an easily detectable decrease in photoreceptor reserve capacity.