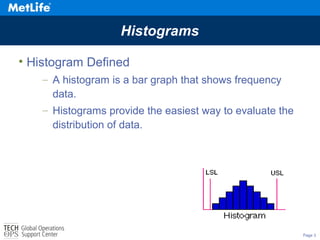
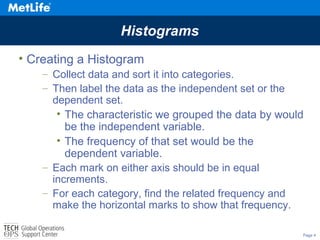
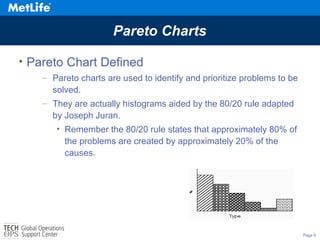
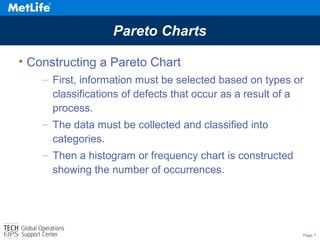
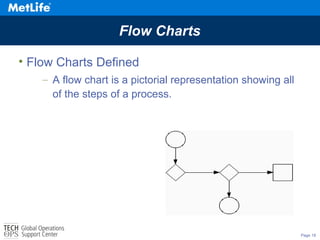
The document describes the seven basic quality tools developed by Kaoru Ishikawa: histograms, Pareto charts, cause-and-effect diagrams, run charts, scatter diagrams, flow charts, and control charts. It provides definitions and examples of how to construct and use each tool to analyze processes, identify problems, determine relationships between variables, and monitor quality. The tools help visualize and interpret data to improve processes and reduce issues.


![7 qc tools[1] to print](https://cdn.slidesharecdn.com/ss_thumbnails/7qctools1toprint-191017092858-thumbnail.jpg?width=640&height=640&fit=bounds)


![7 qc tools training material[1]](https://cdn.slidesharecdn.com/ss_thumbnails/7qctoolstrainingmaterial1-120925054558-phpapp02-thumbnail.jpg?width=640&height=640&fit=bounds)


