Downloaded 149 times


![Stratification
Method
To sum up
Usage Result
Grouping by •Used to observe variations
•Allows observation
day, time, place, wo among strata.
of variations among
rker, or process •Used to identify the
strata.
relationship between cause
•By performing a
Number of Units
and effect.
cause analysis using
X ★★★★★★★ •Used to identify a purpose
the stratified
Y △△△△ and means to serve the
data, the following
purpose
Z ○○○
[Used during phases to monitor
can be accomplished.
the situation, analyze 1.Identification and control of a
causes, review effectiveness of an problem
action, perform 2.“Division of data (obtained by
standardization, and implement a using each QC tool) into several
selected control measure.] groups”
17](https://image.slidesharecdn.com/stratificationanshul-121204063020-phpapp02/85/Stratification-anshul-17-320.jpg)

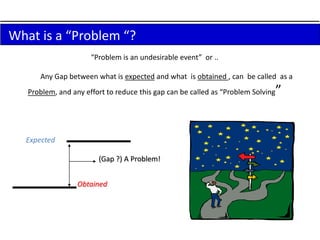
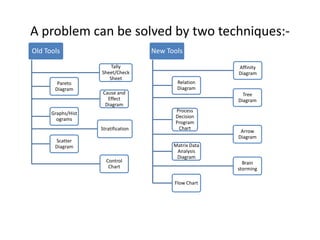
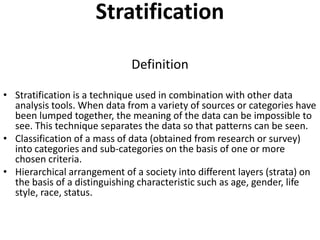
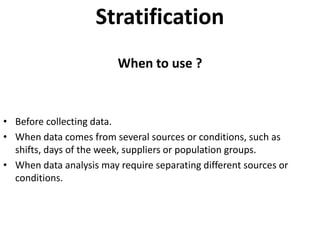
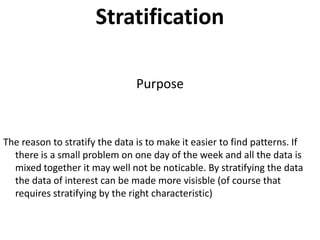
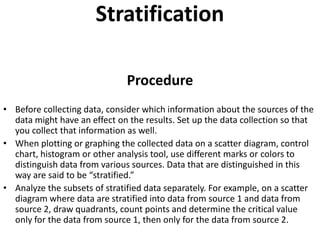
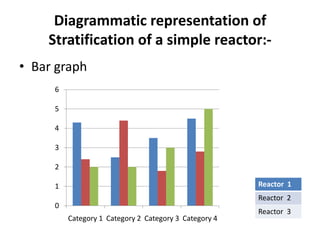
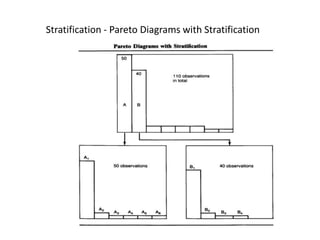
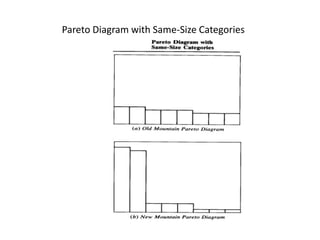
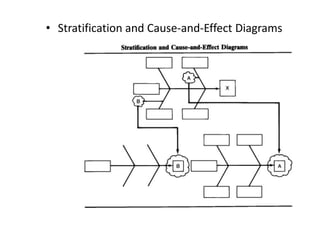
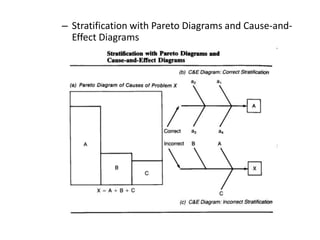
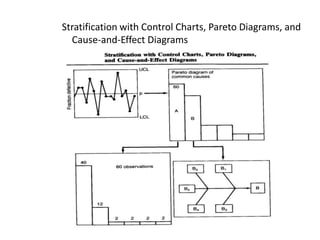
1. The document discusses the problem solving technique of stratification. Stratification involves separating collected data into categories based on characteristics like source, equipment, operator, or time period. 2. Stratifying data makes patterns more visible by distinguishing different data subsets. It allows analyzing the effects of different sources or conditions separately. 3. The document provides examples of how to stratify data on various charts and diagrams to better identify relationships and variations among strata for problem analysis and solution.


![7 qc tools training material[1]](https://cdn.slidesharecdn.com/ss_thumbnails/7qctoolstrainingmaterial1-120925054558-phpapp02-thumbnail.jpg?width=640&height=640&fit=bounds)


