Downloaded 2,313 times
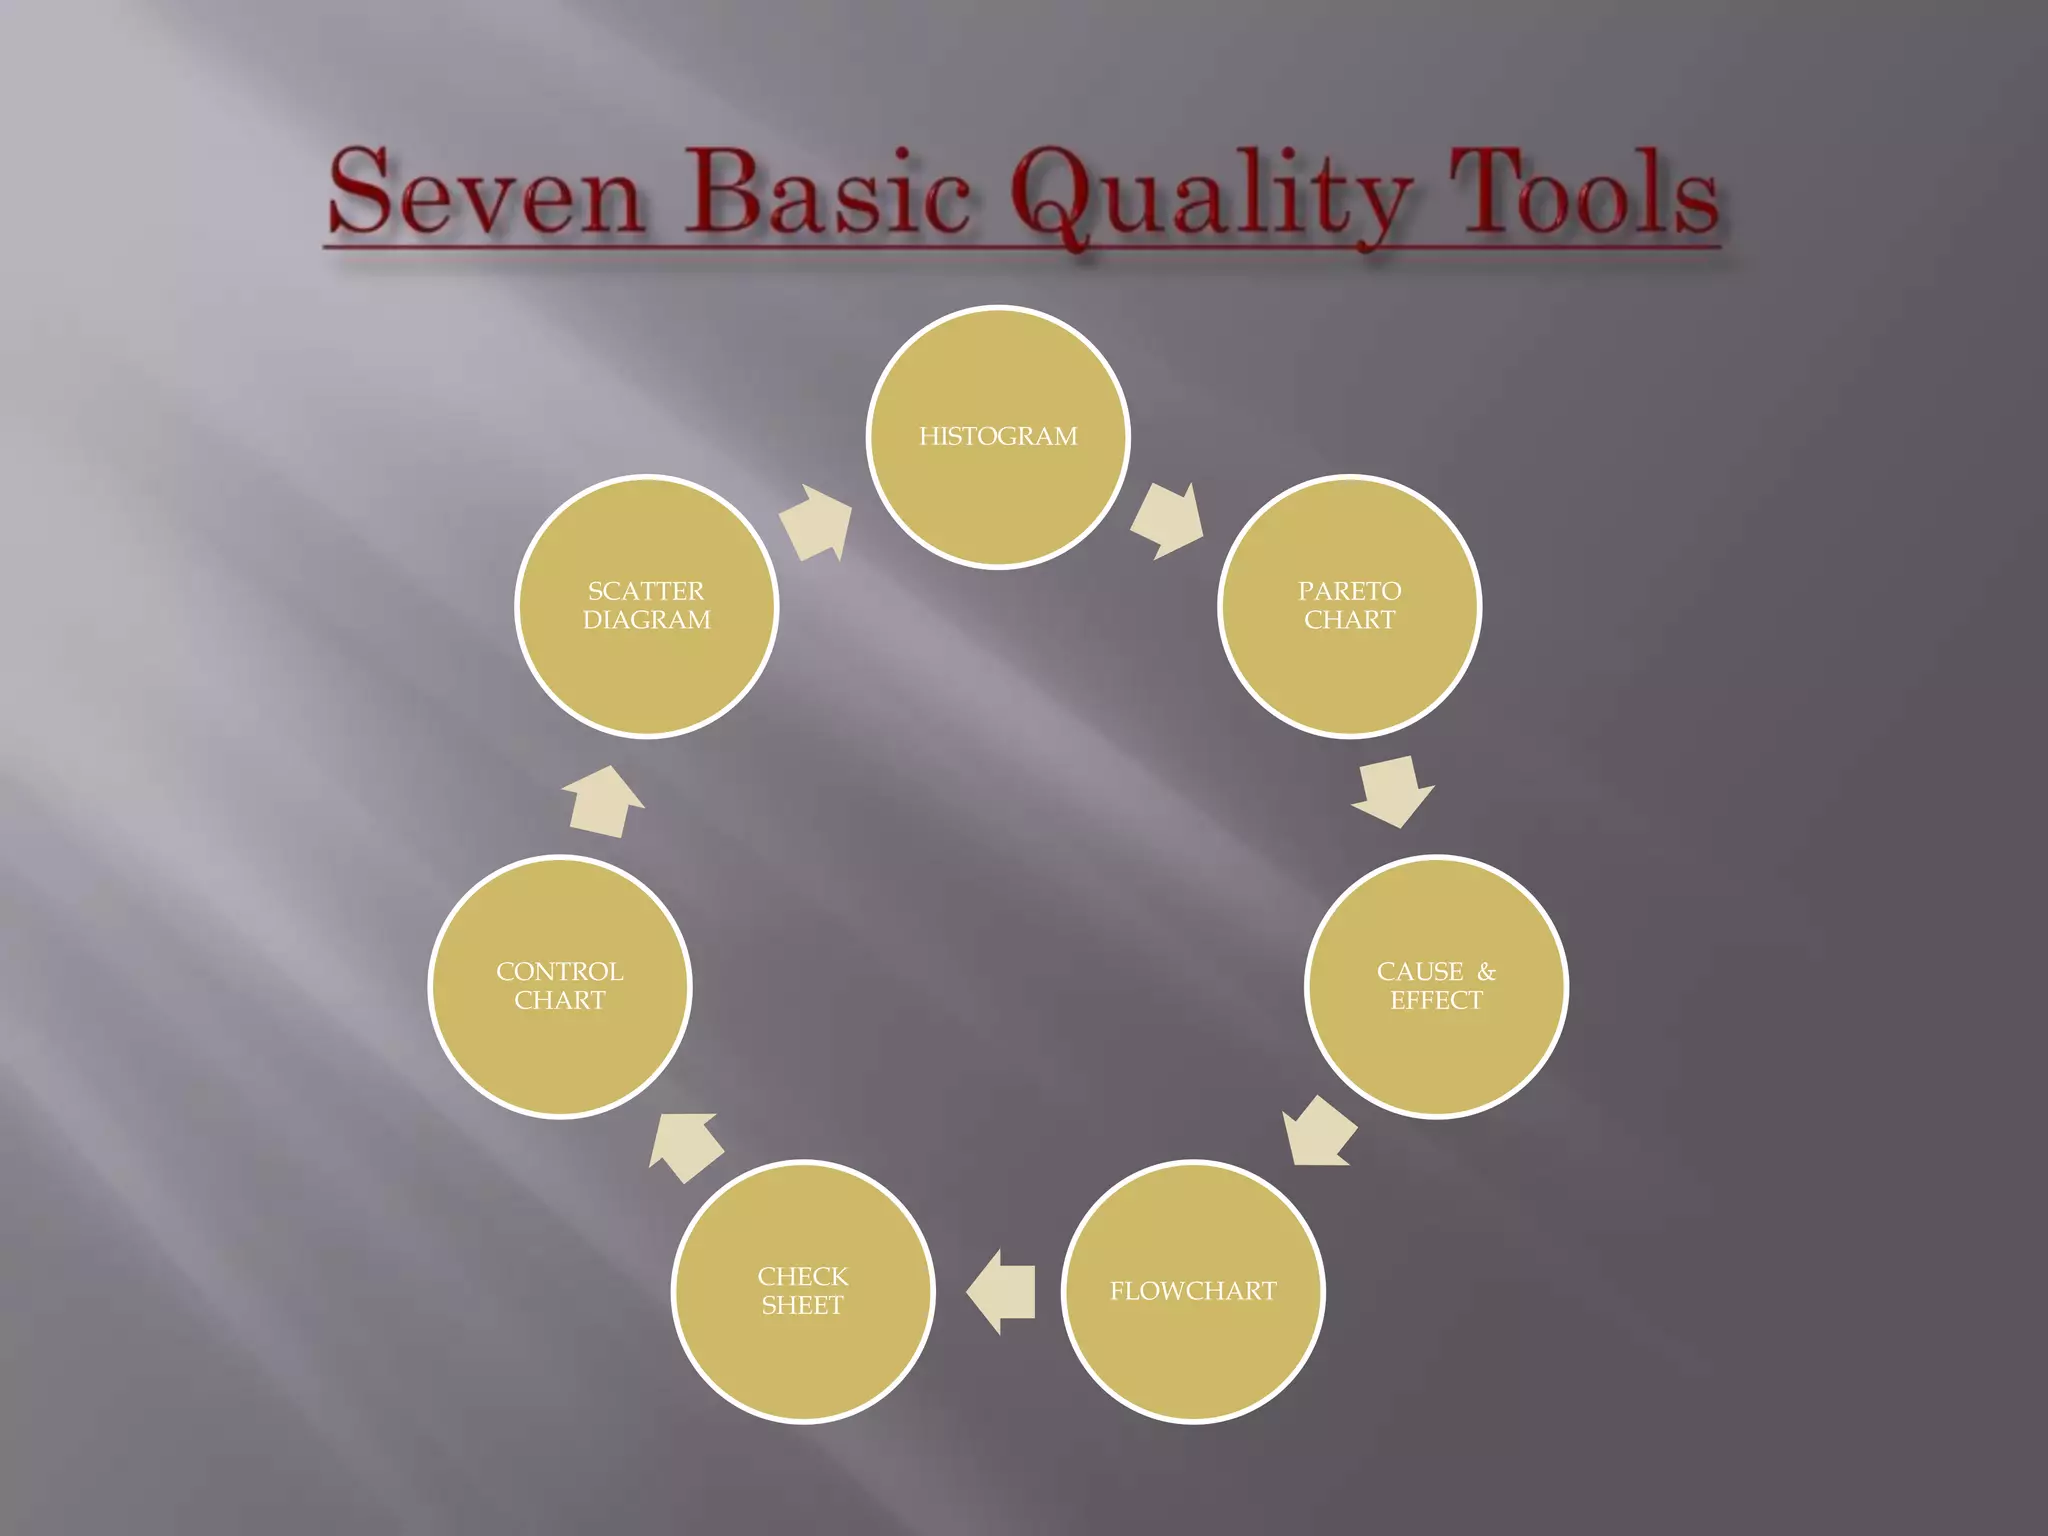
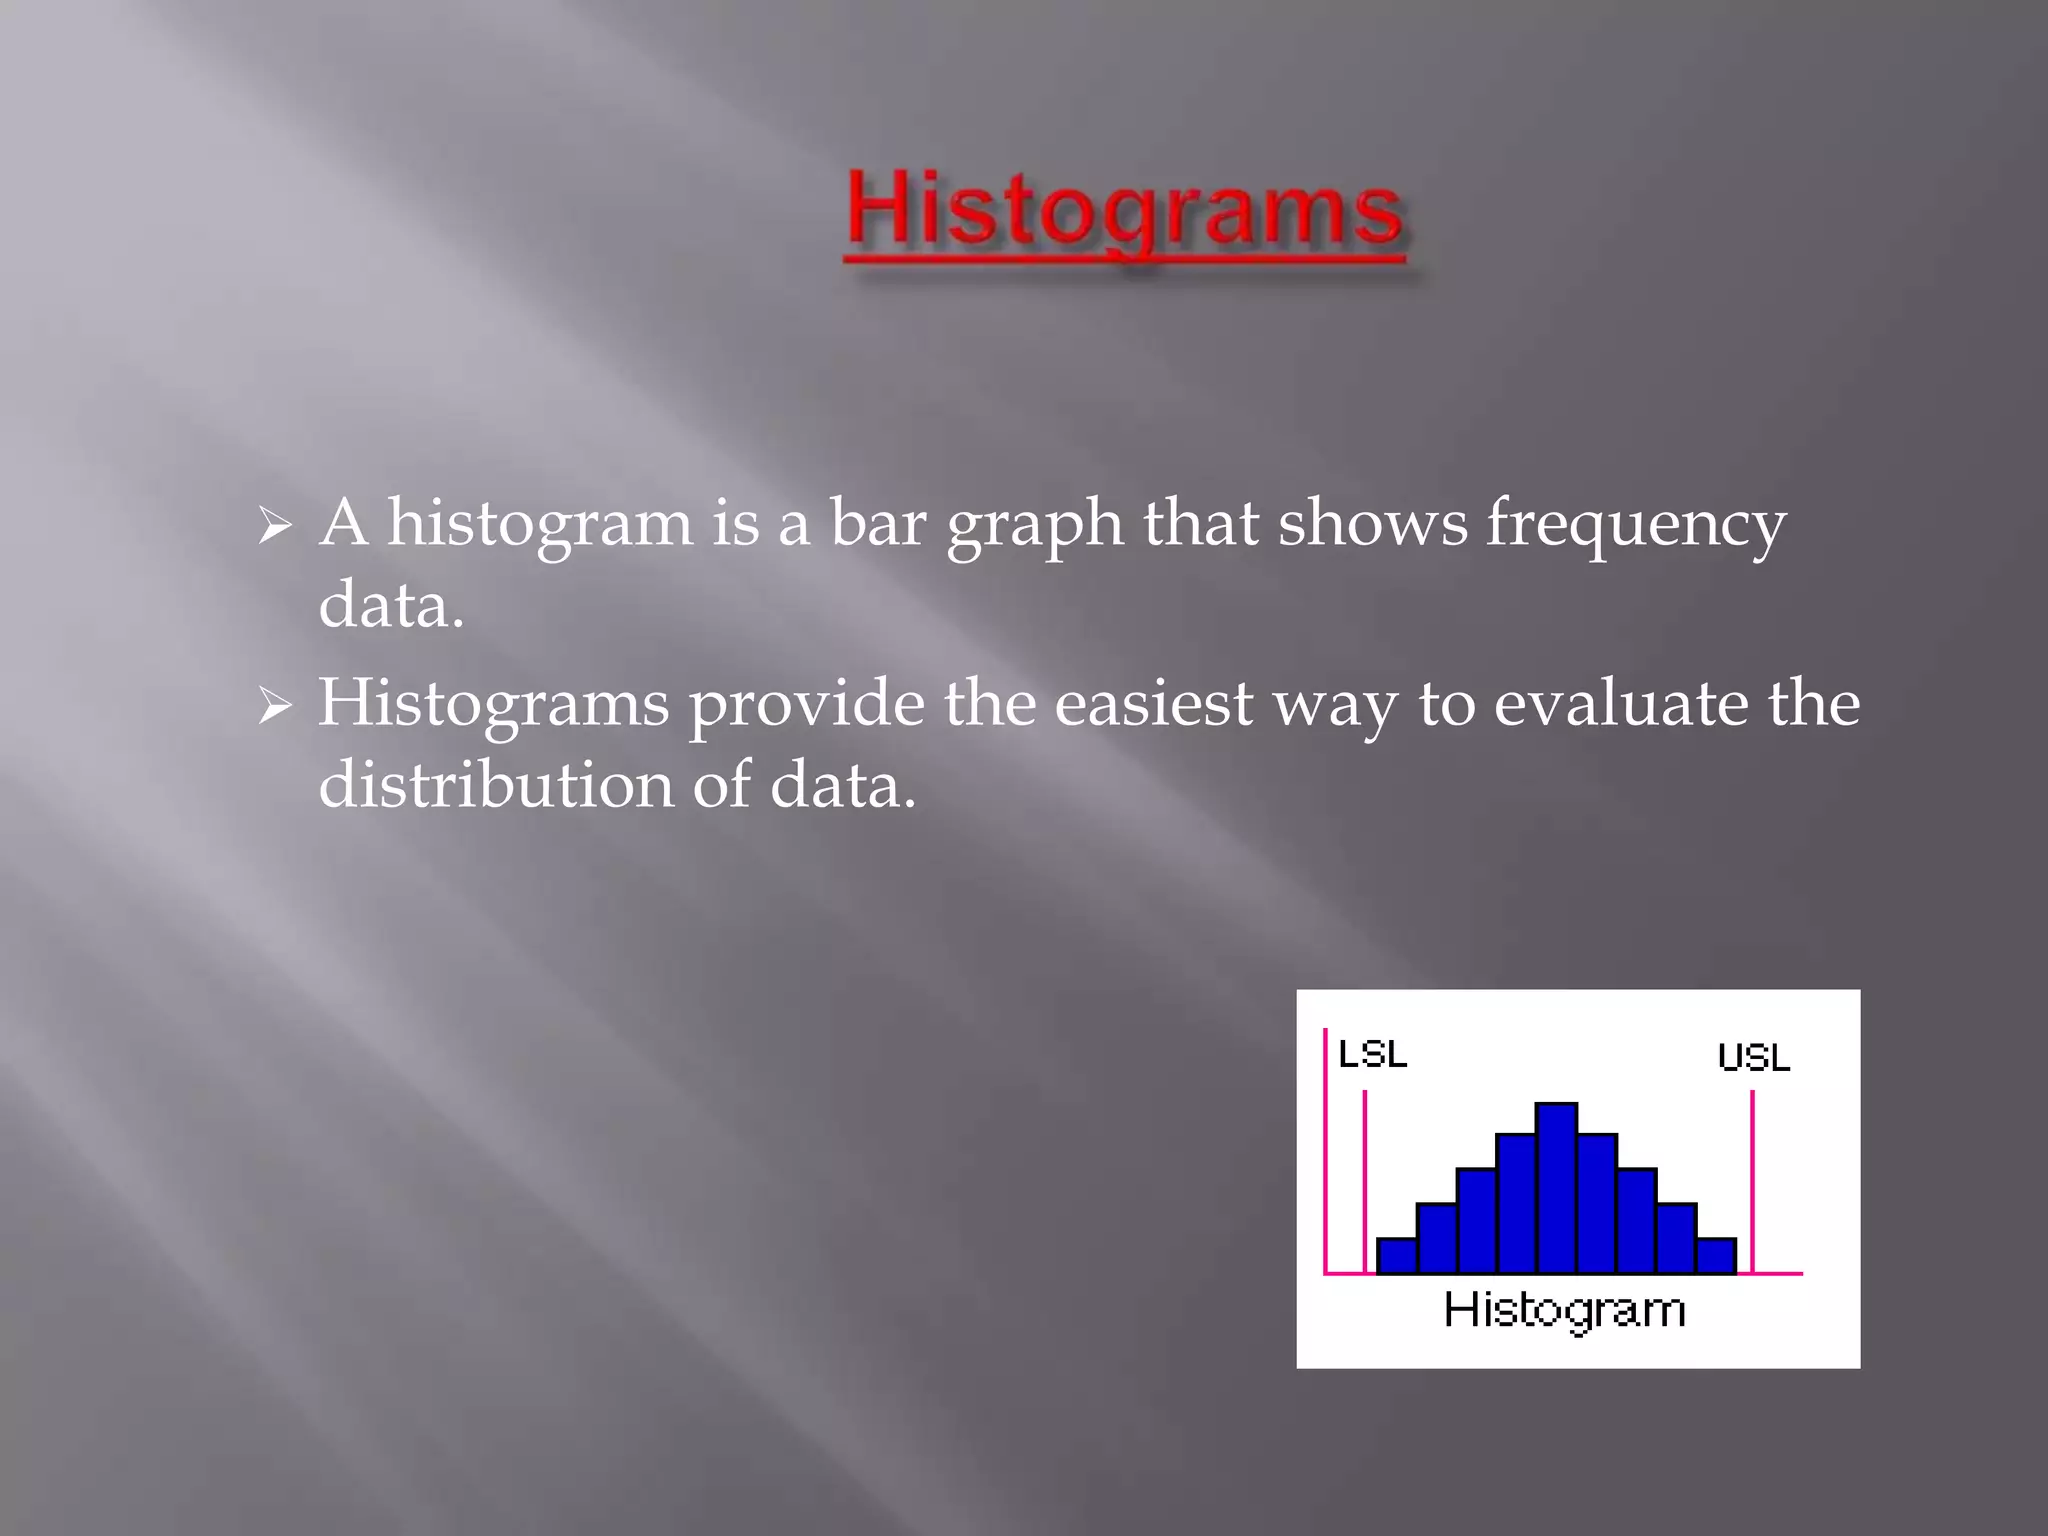
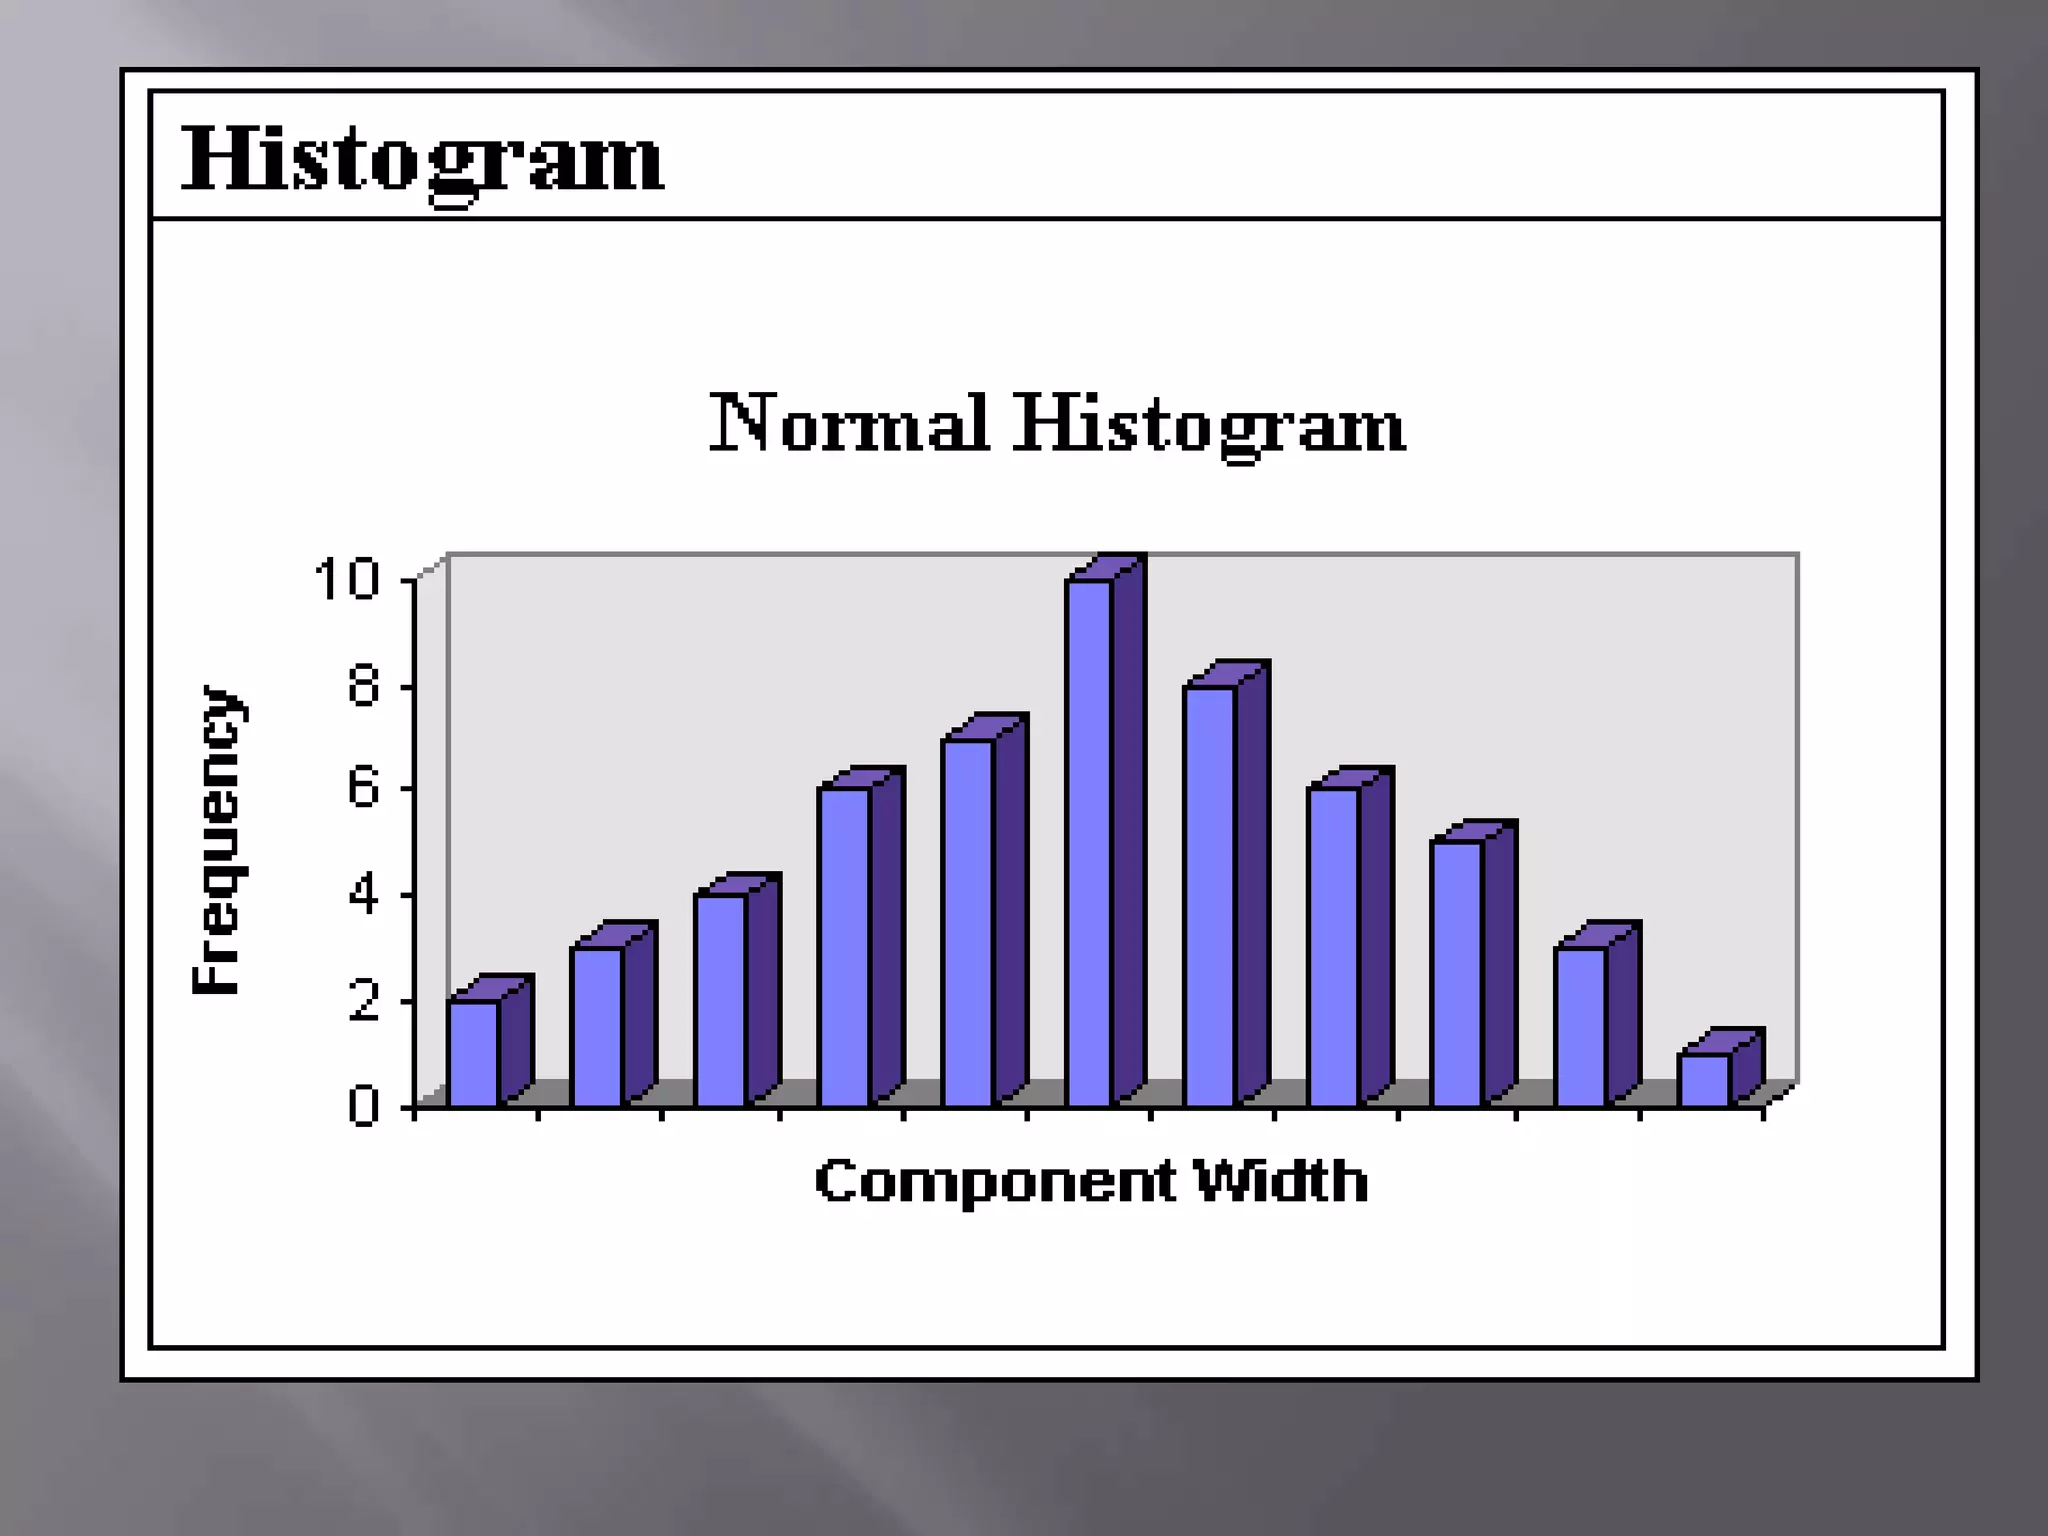
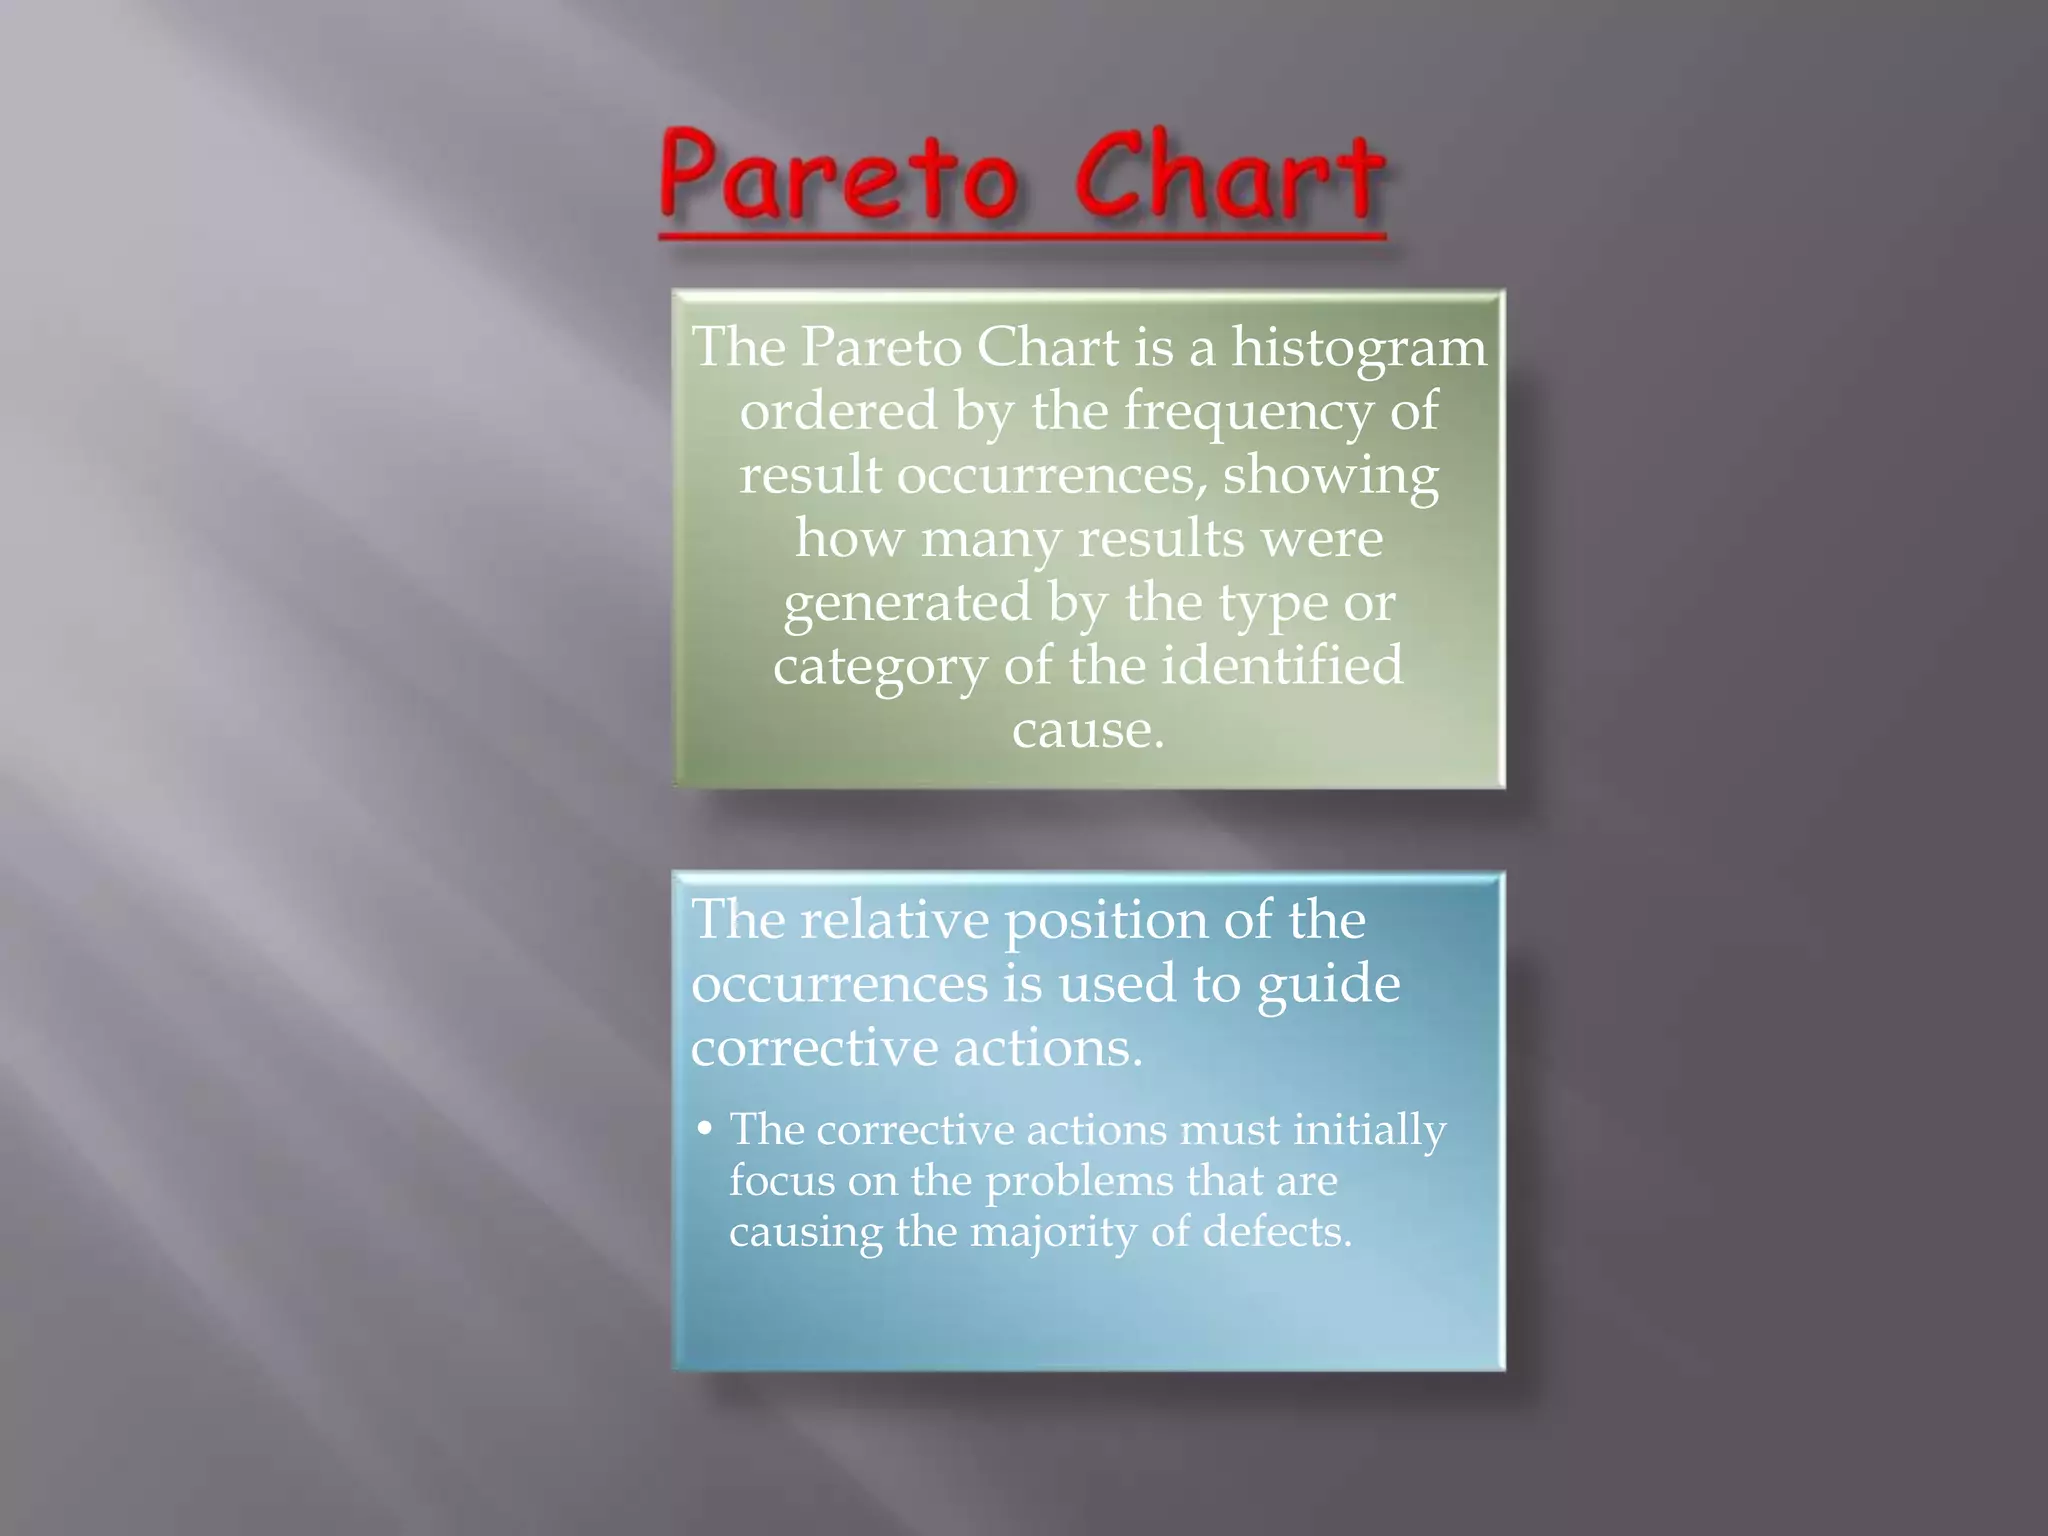
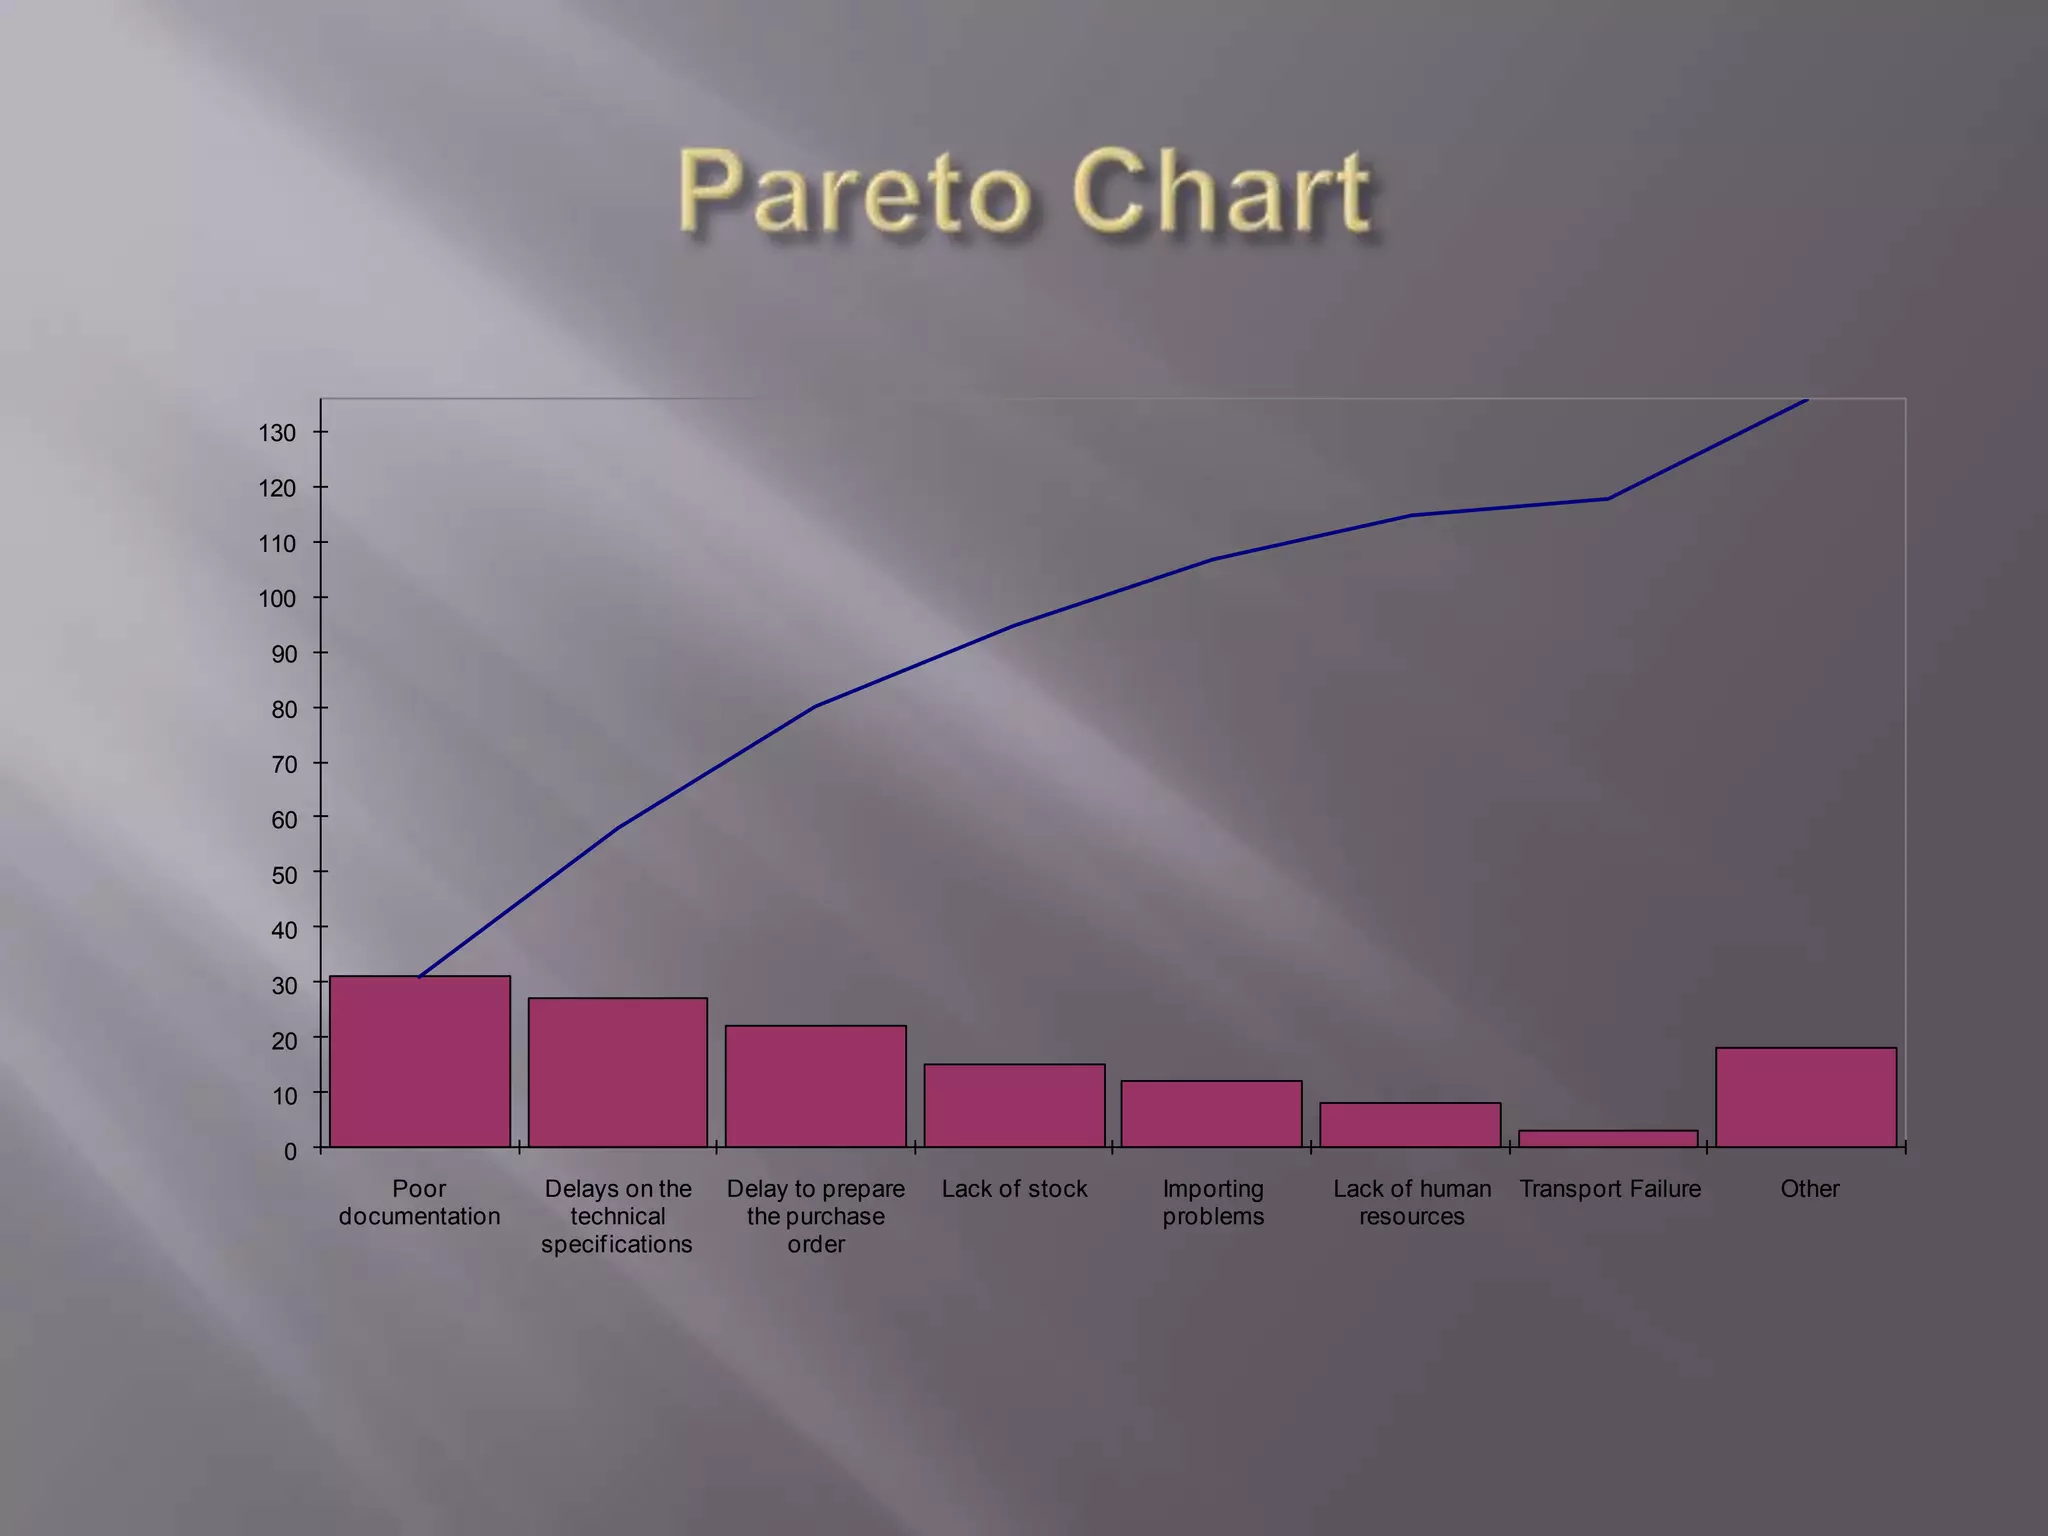
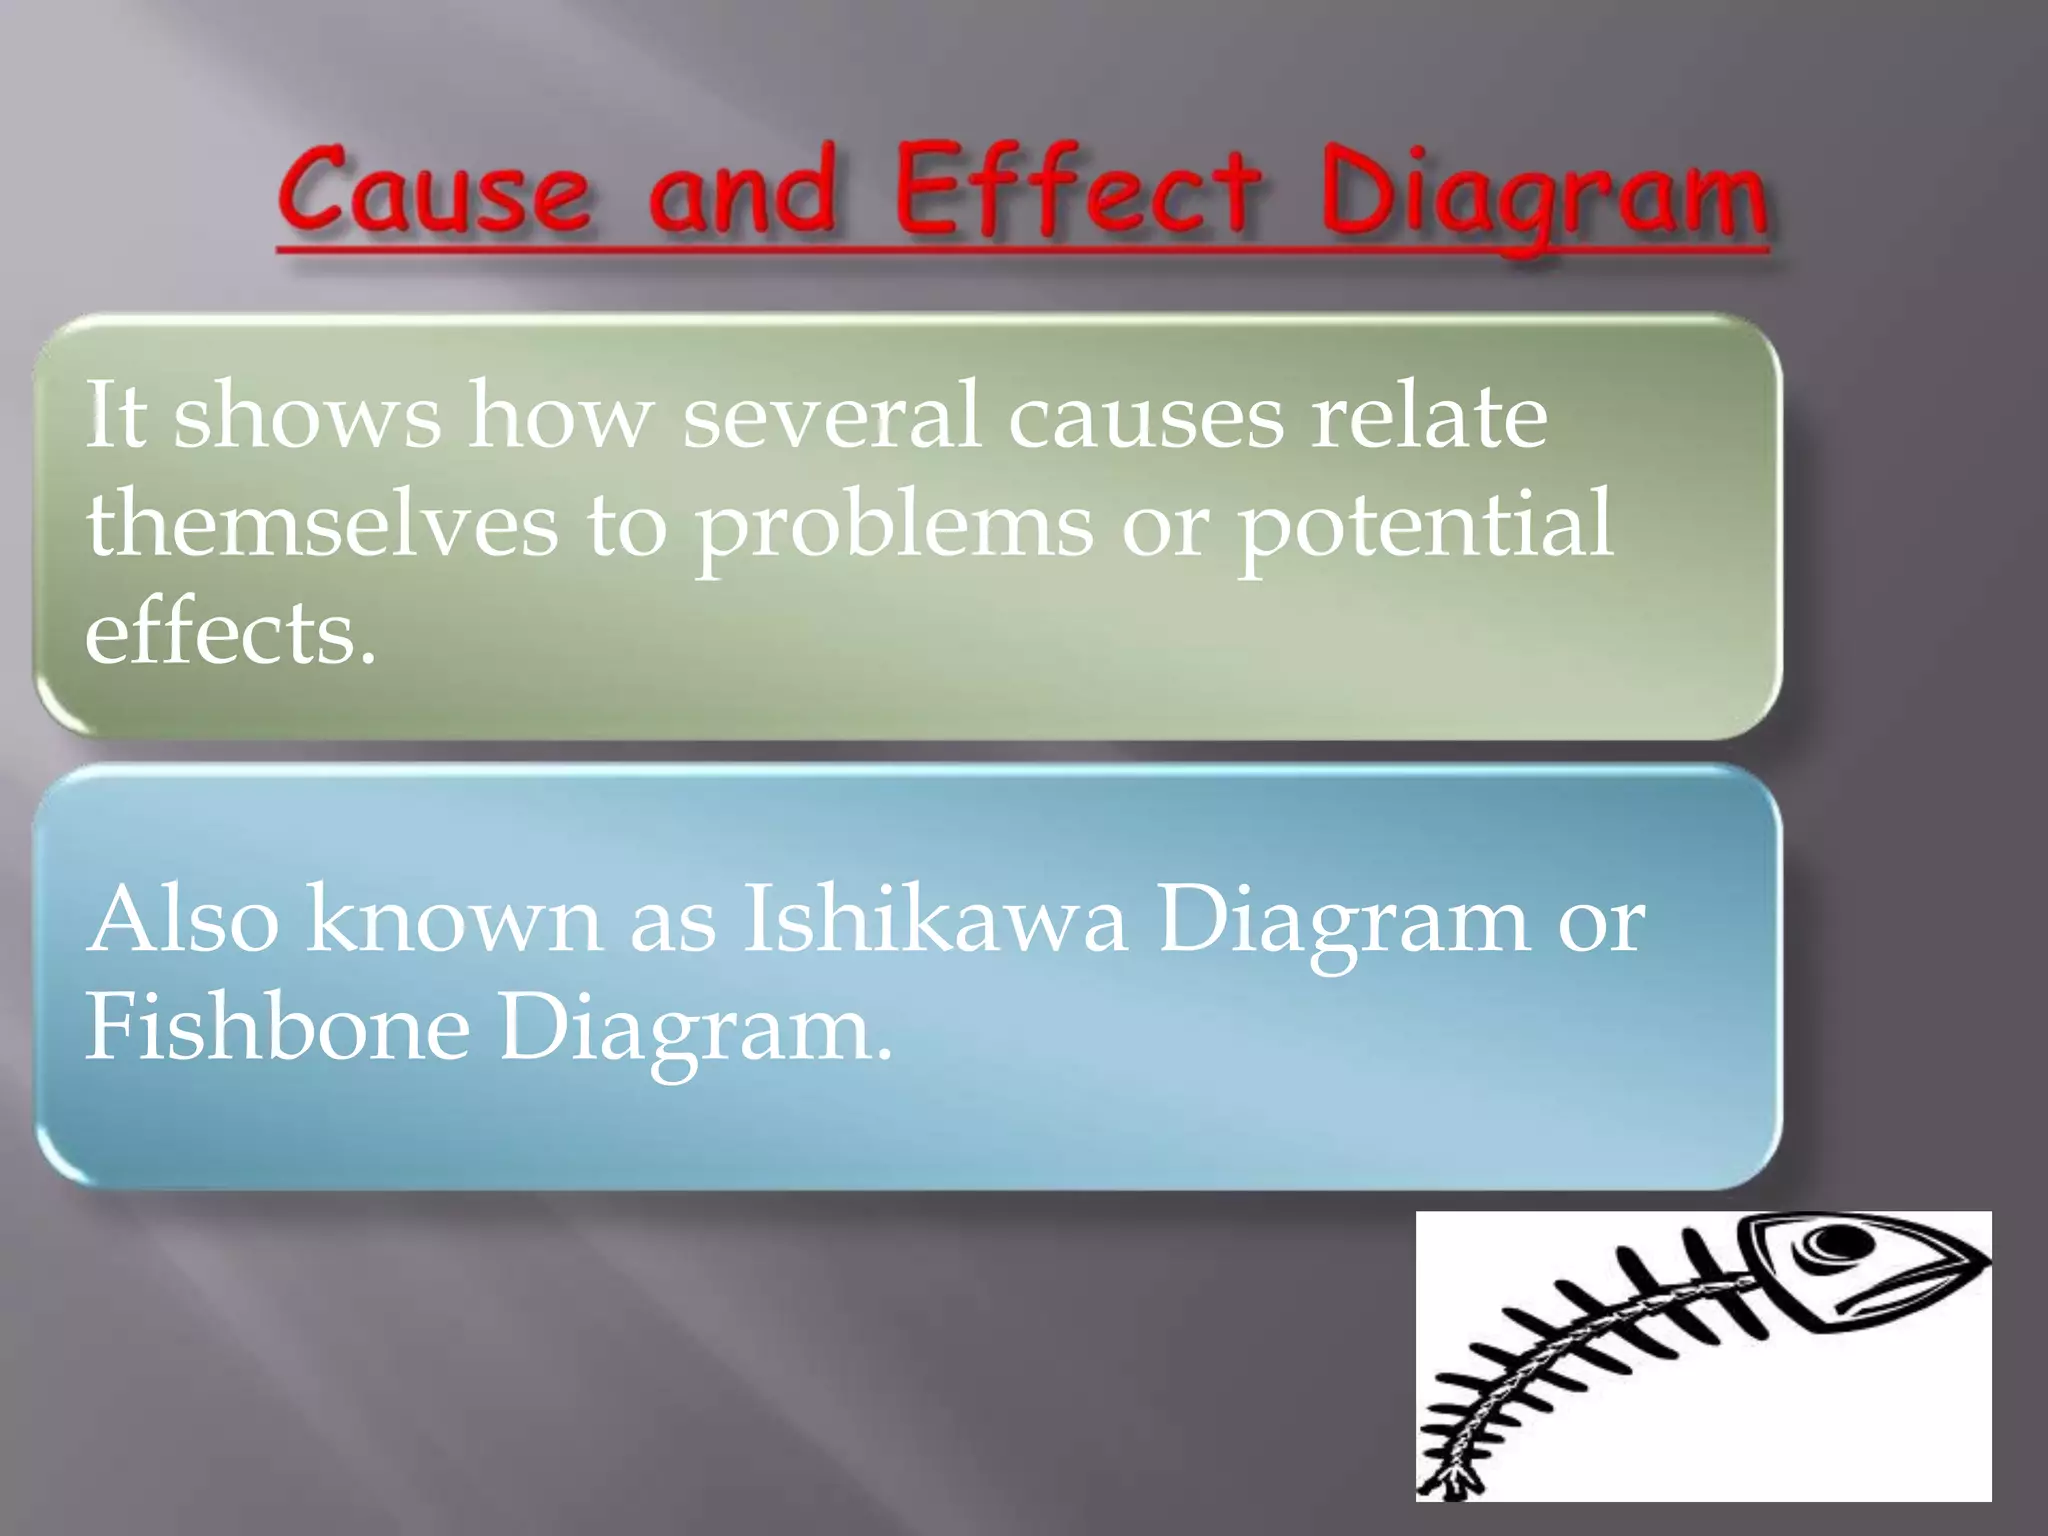
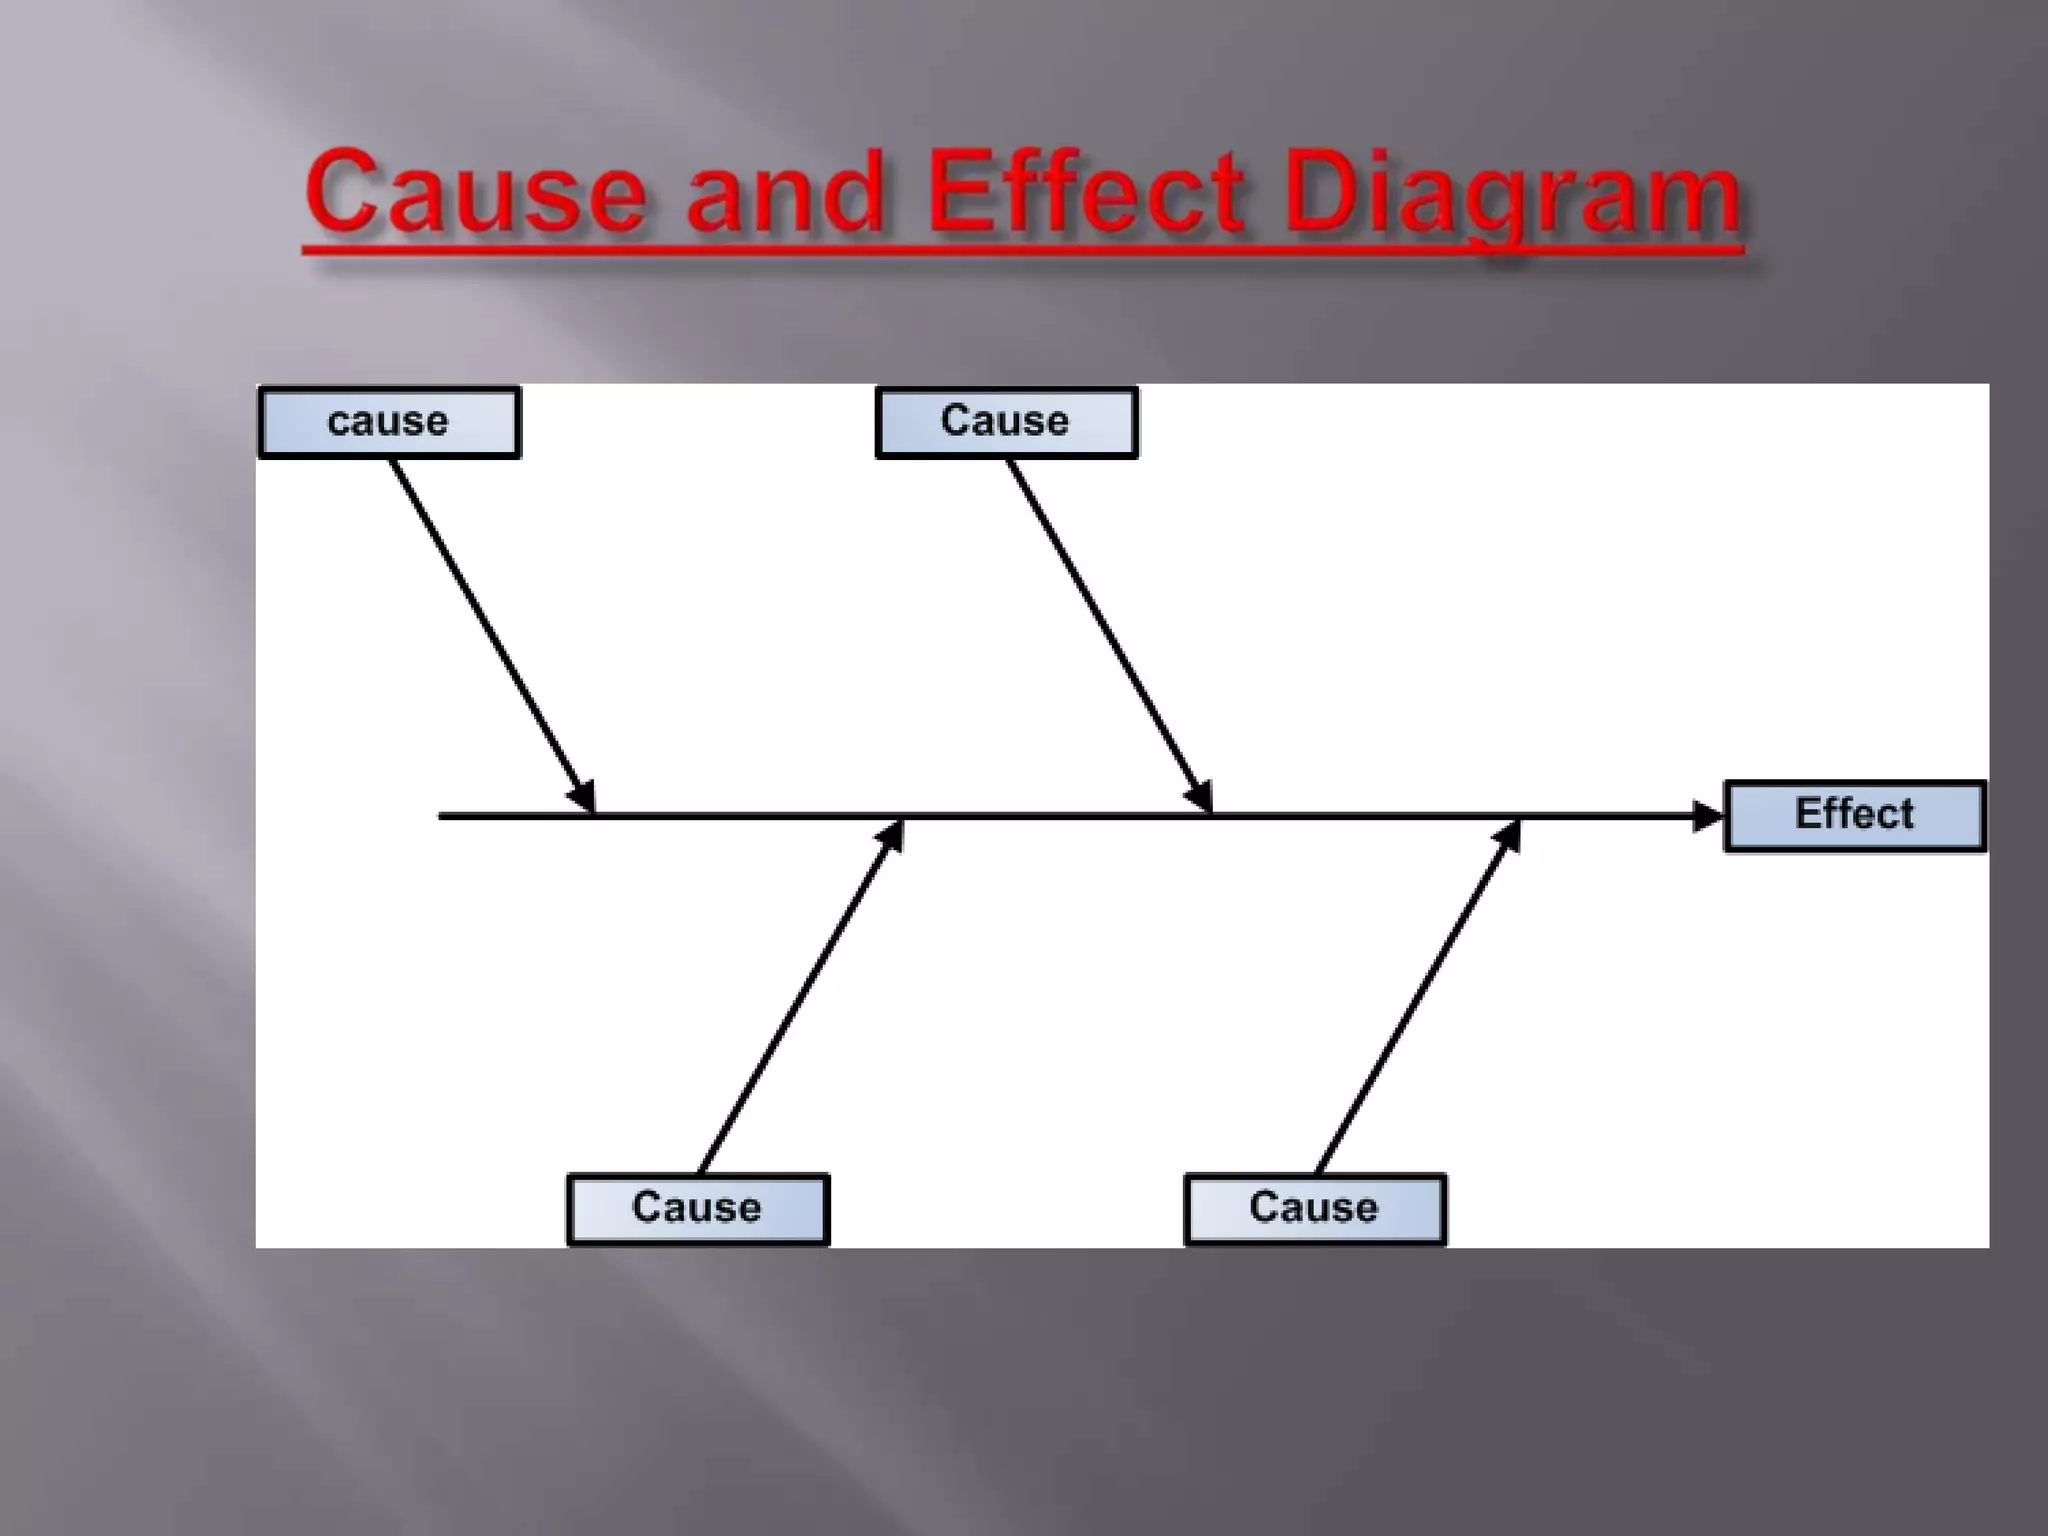
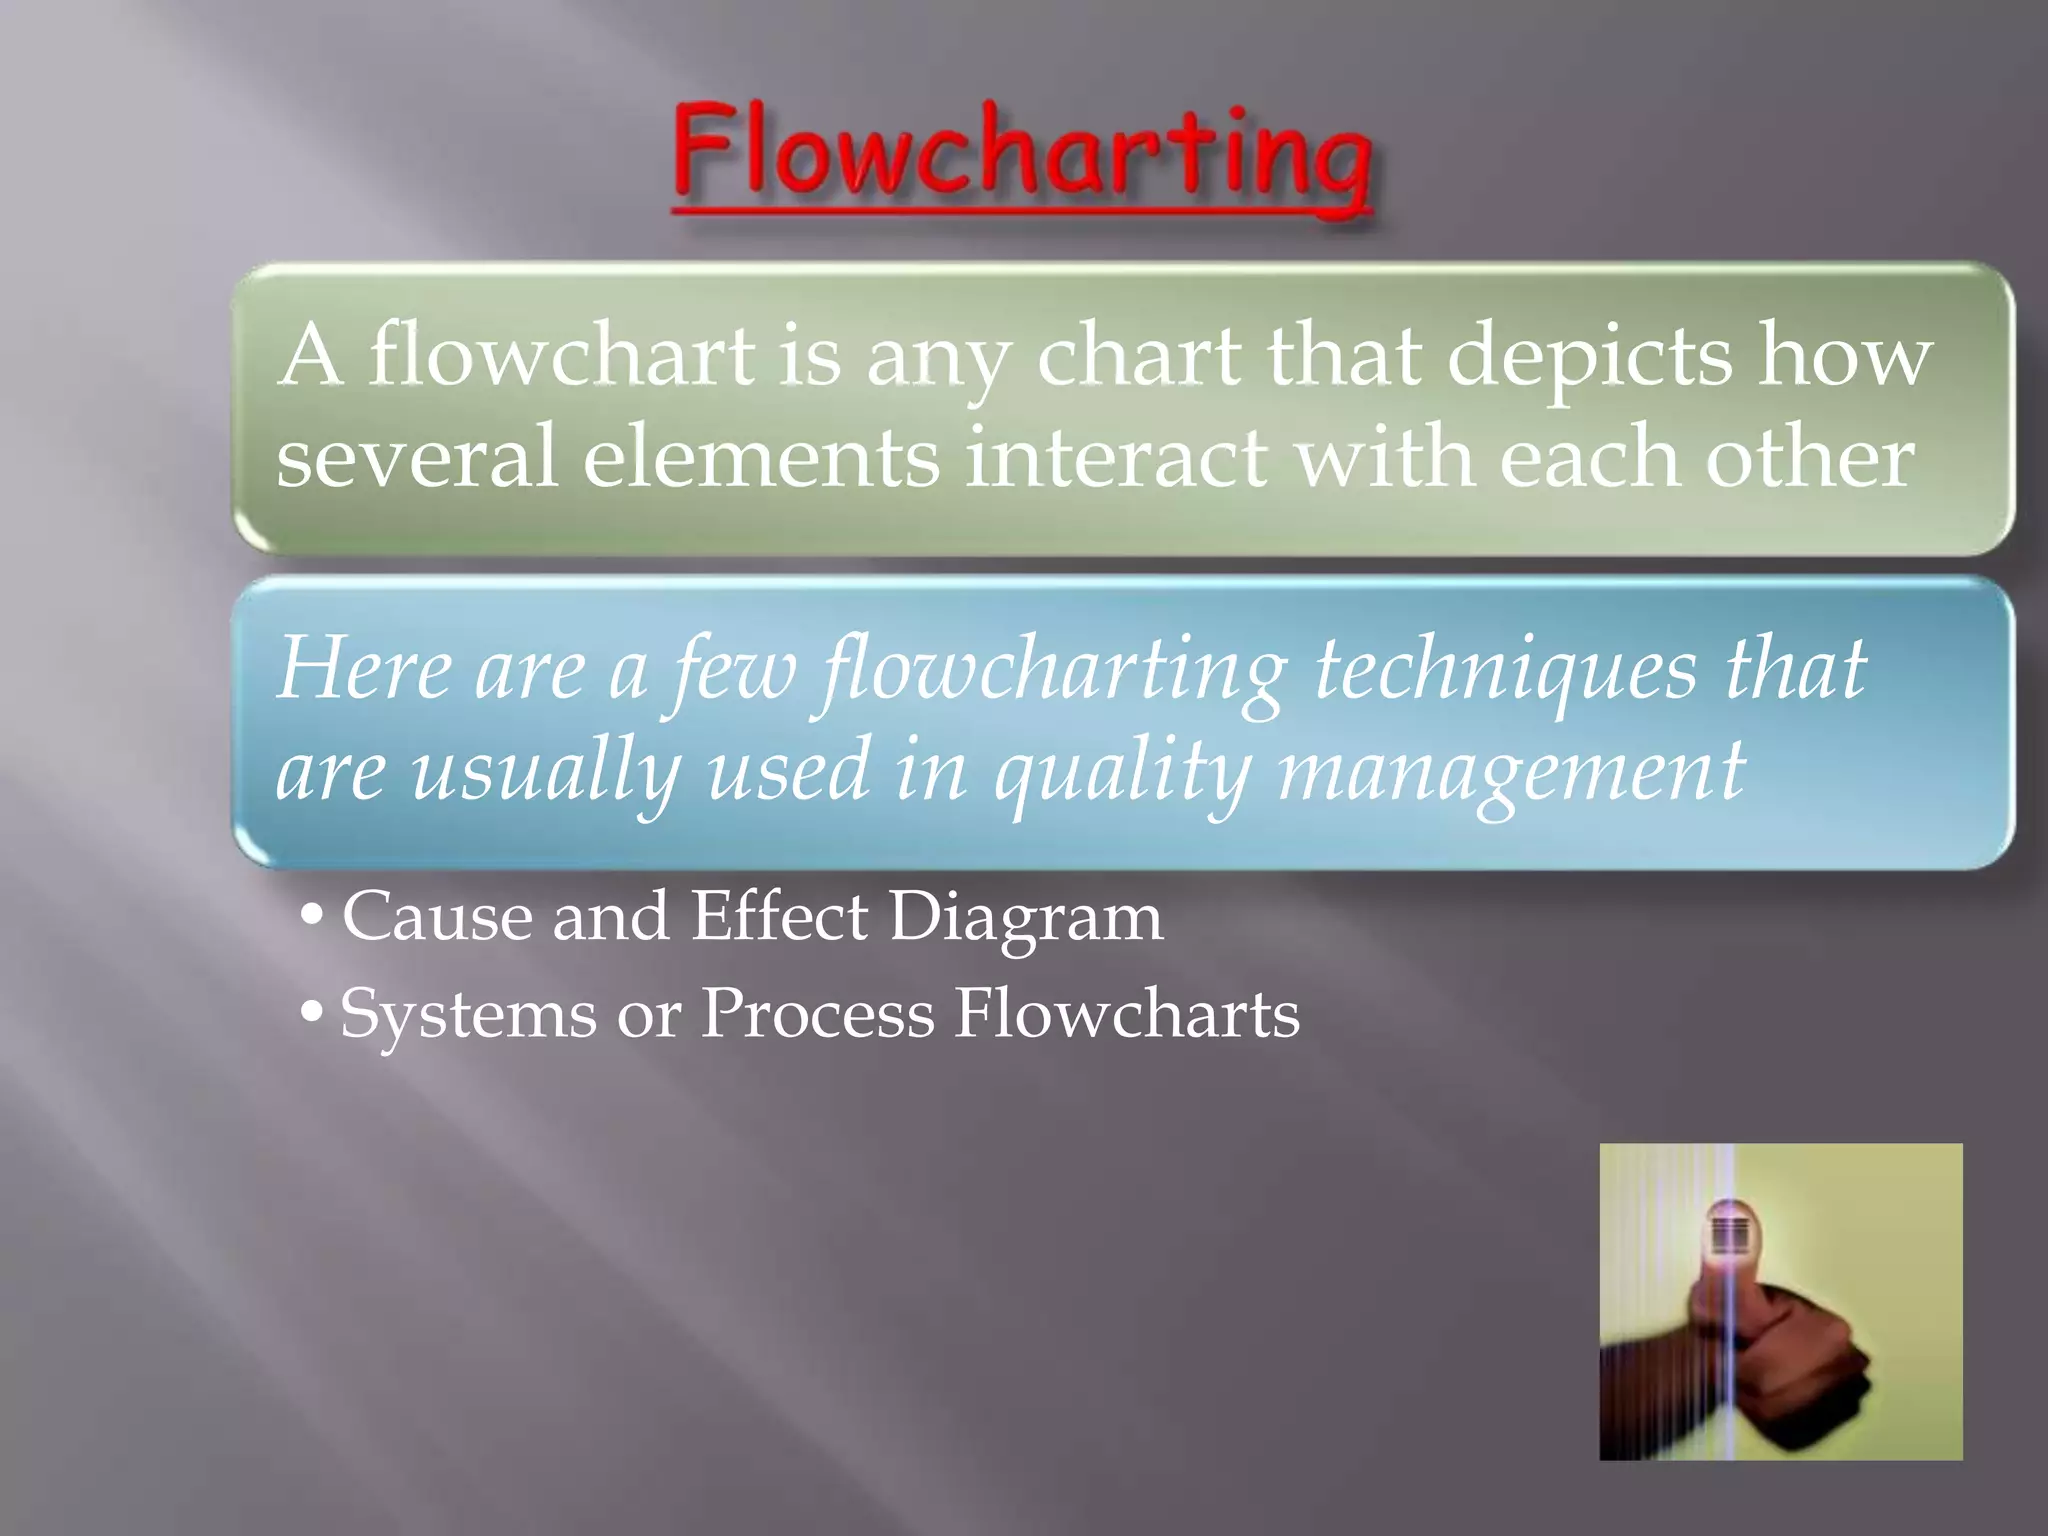
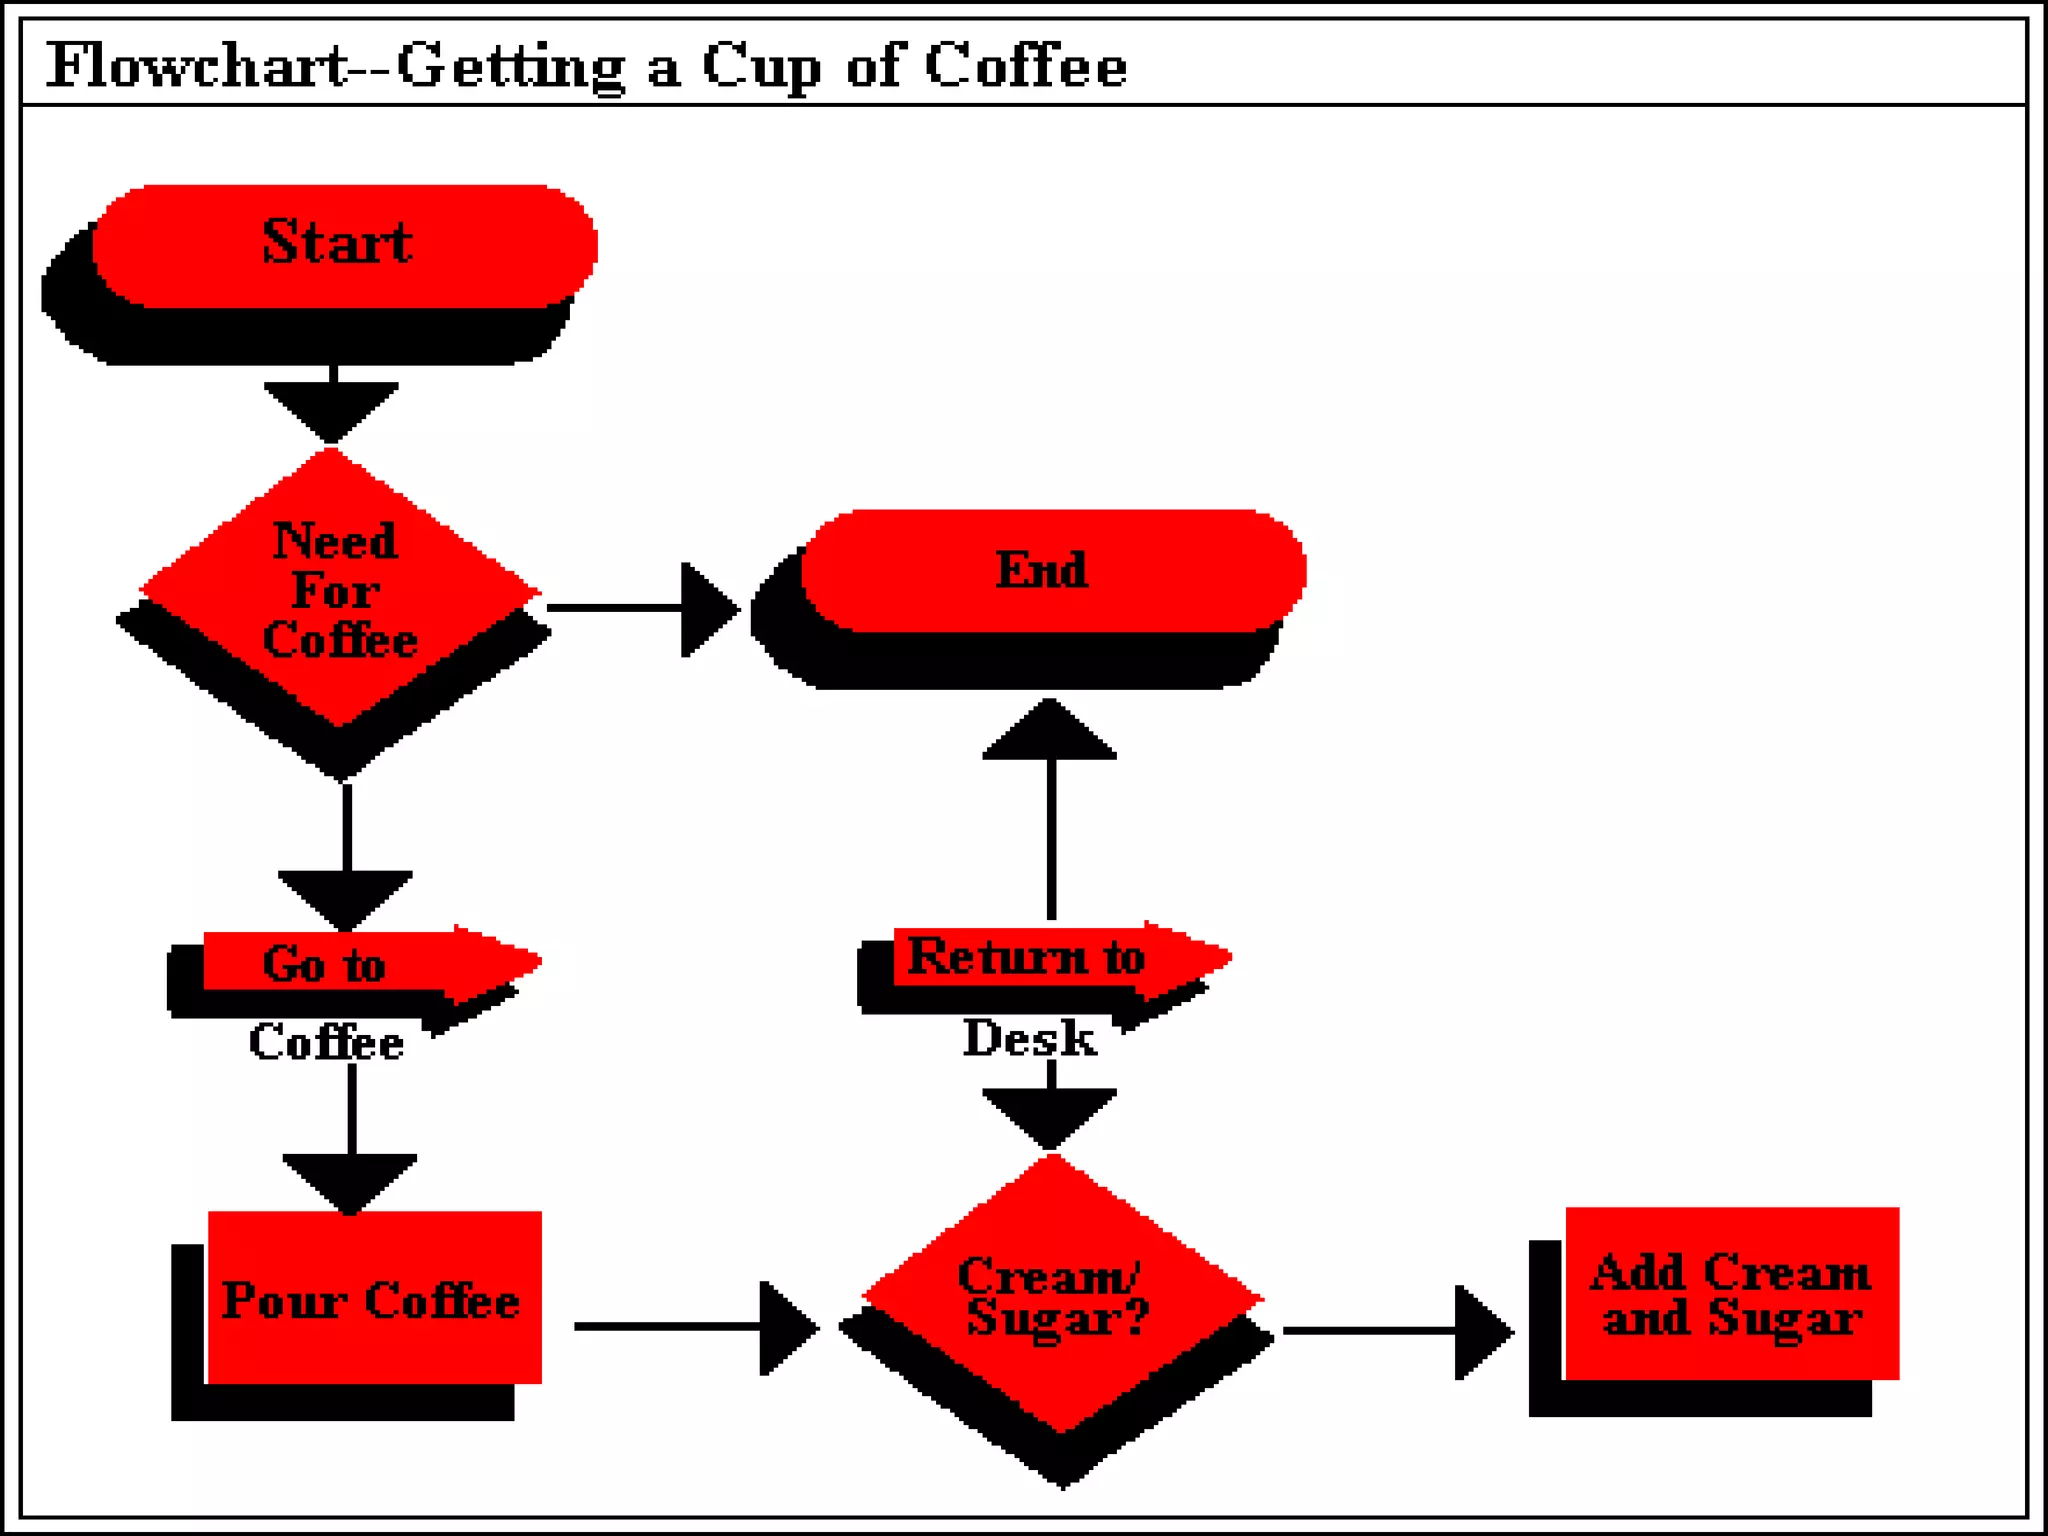
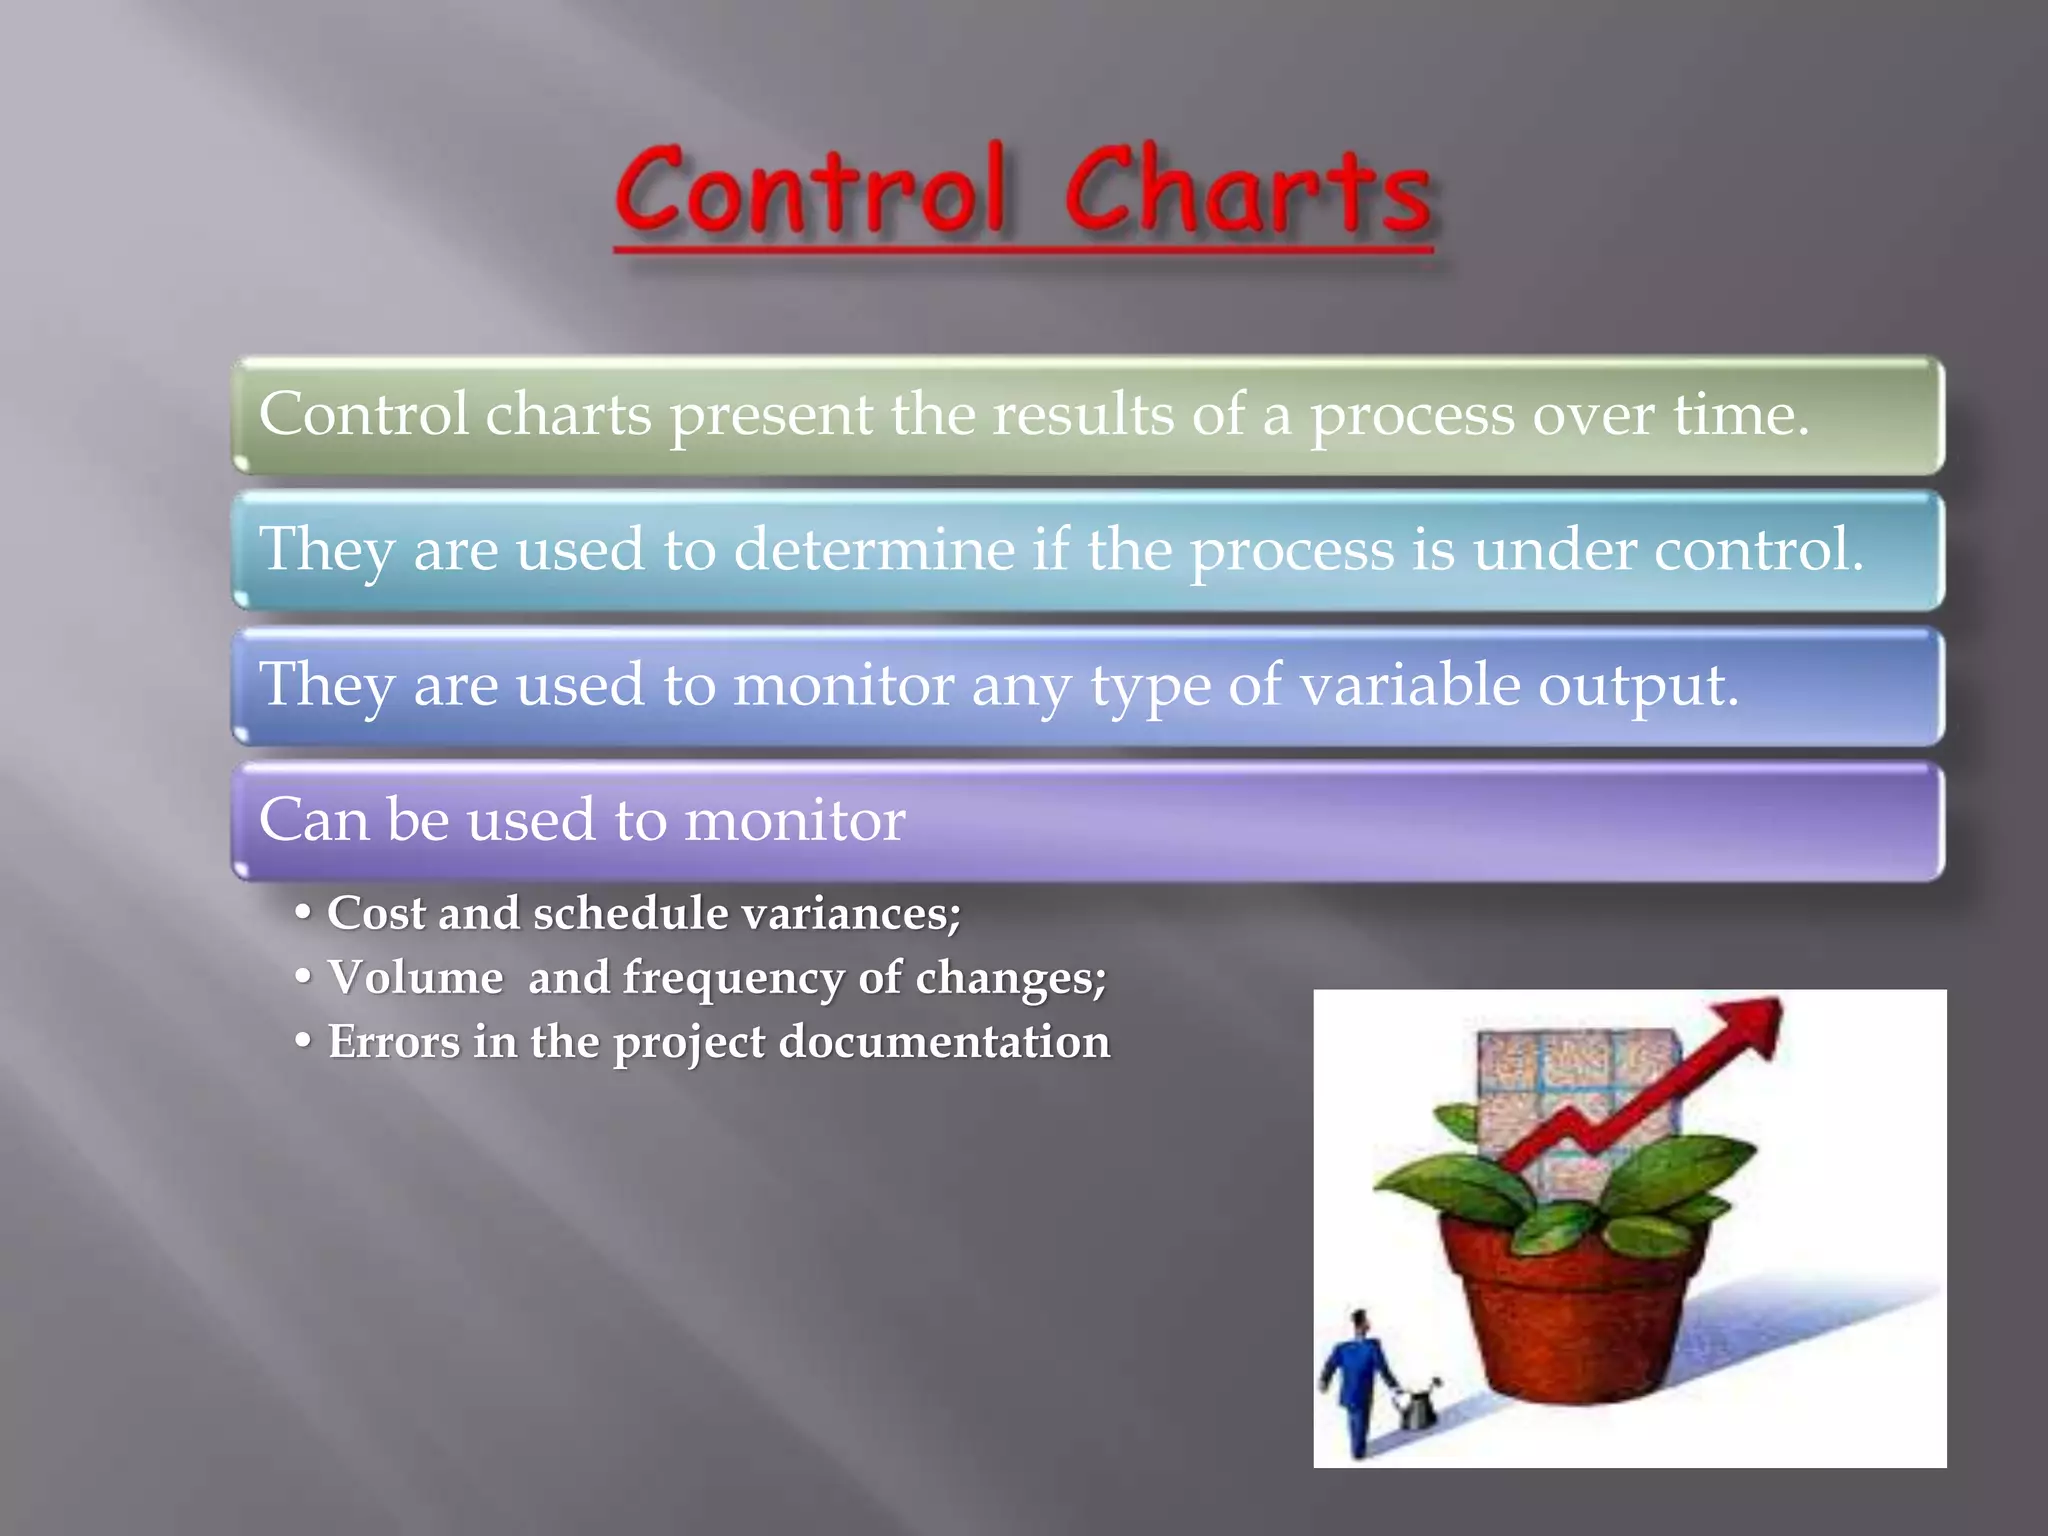
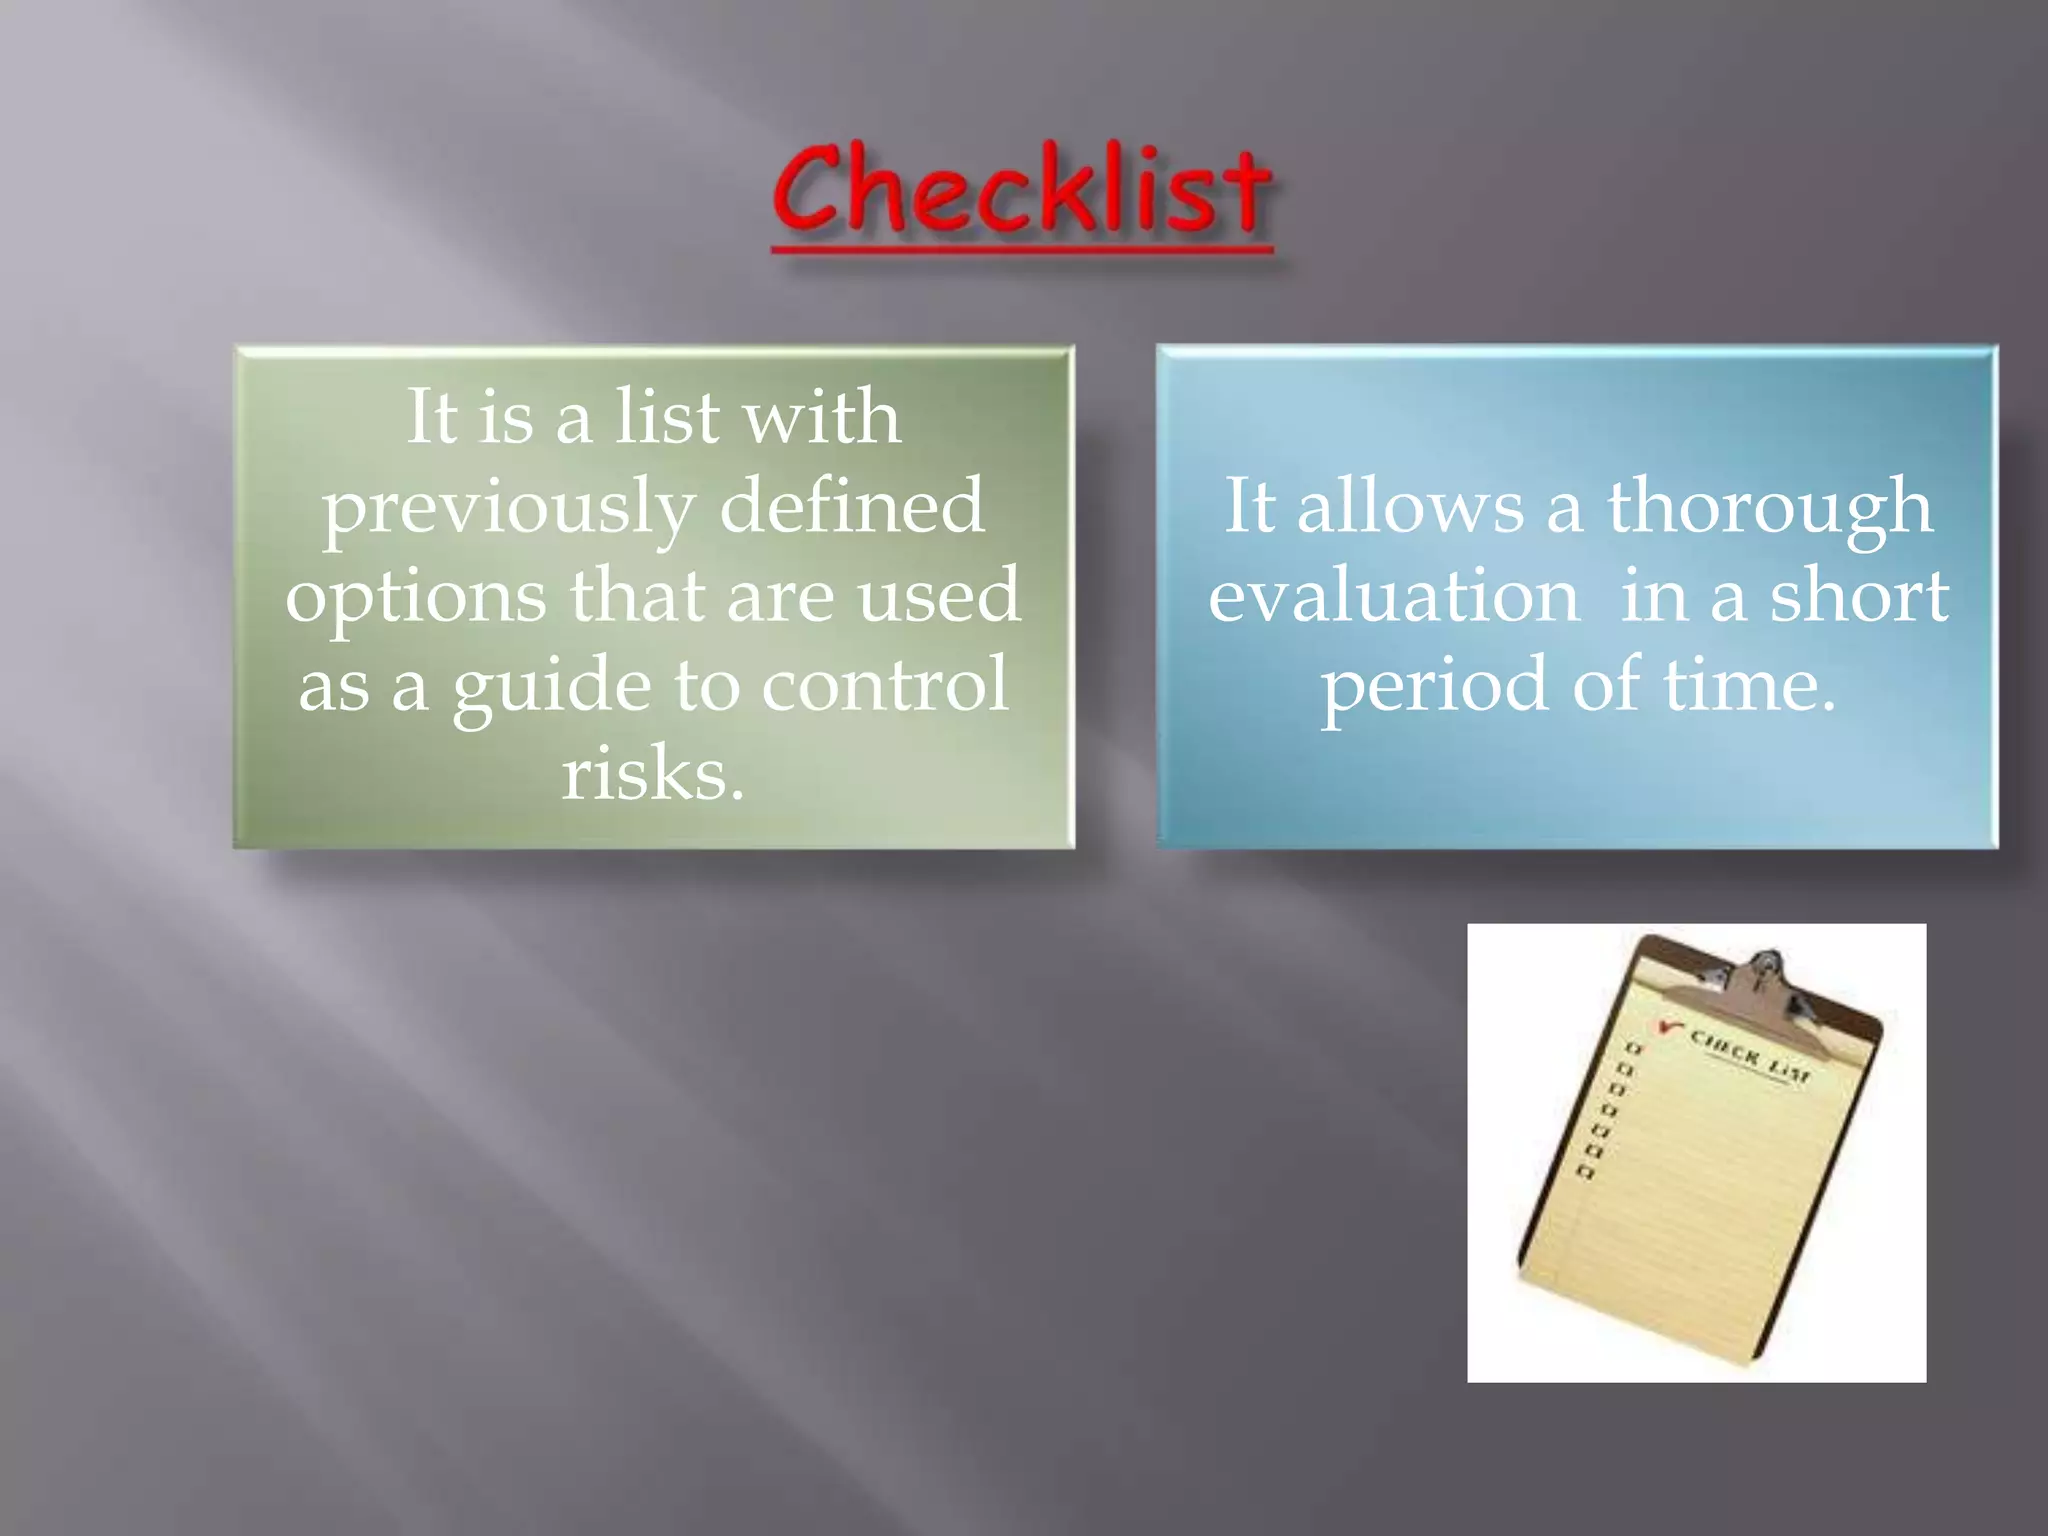
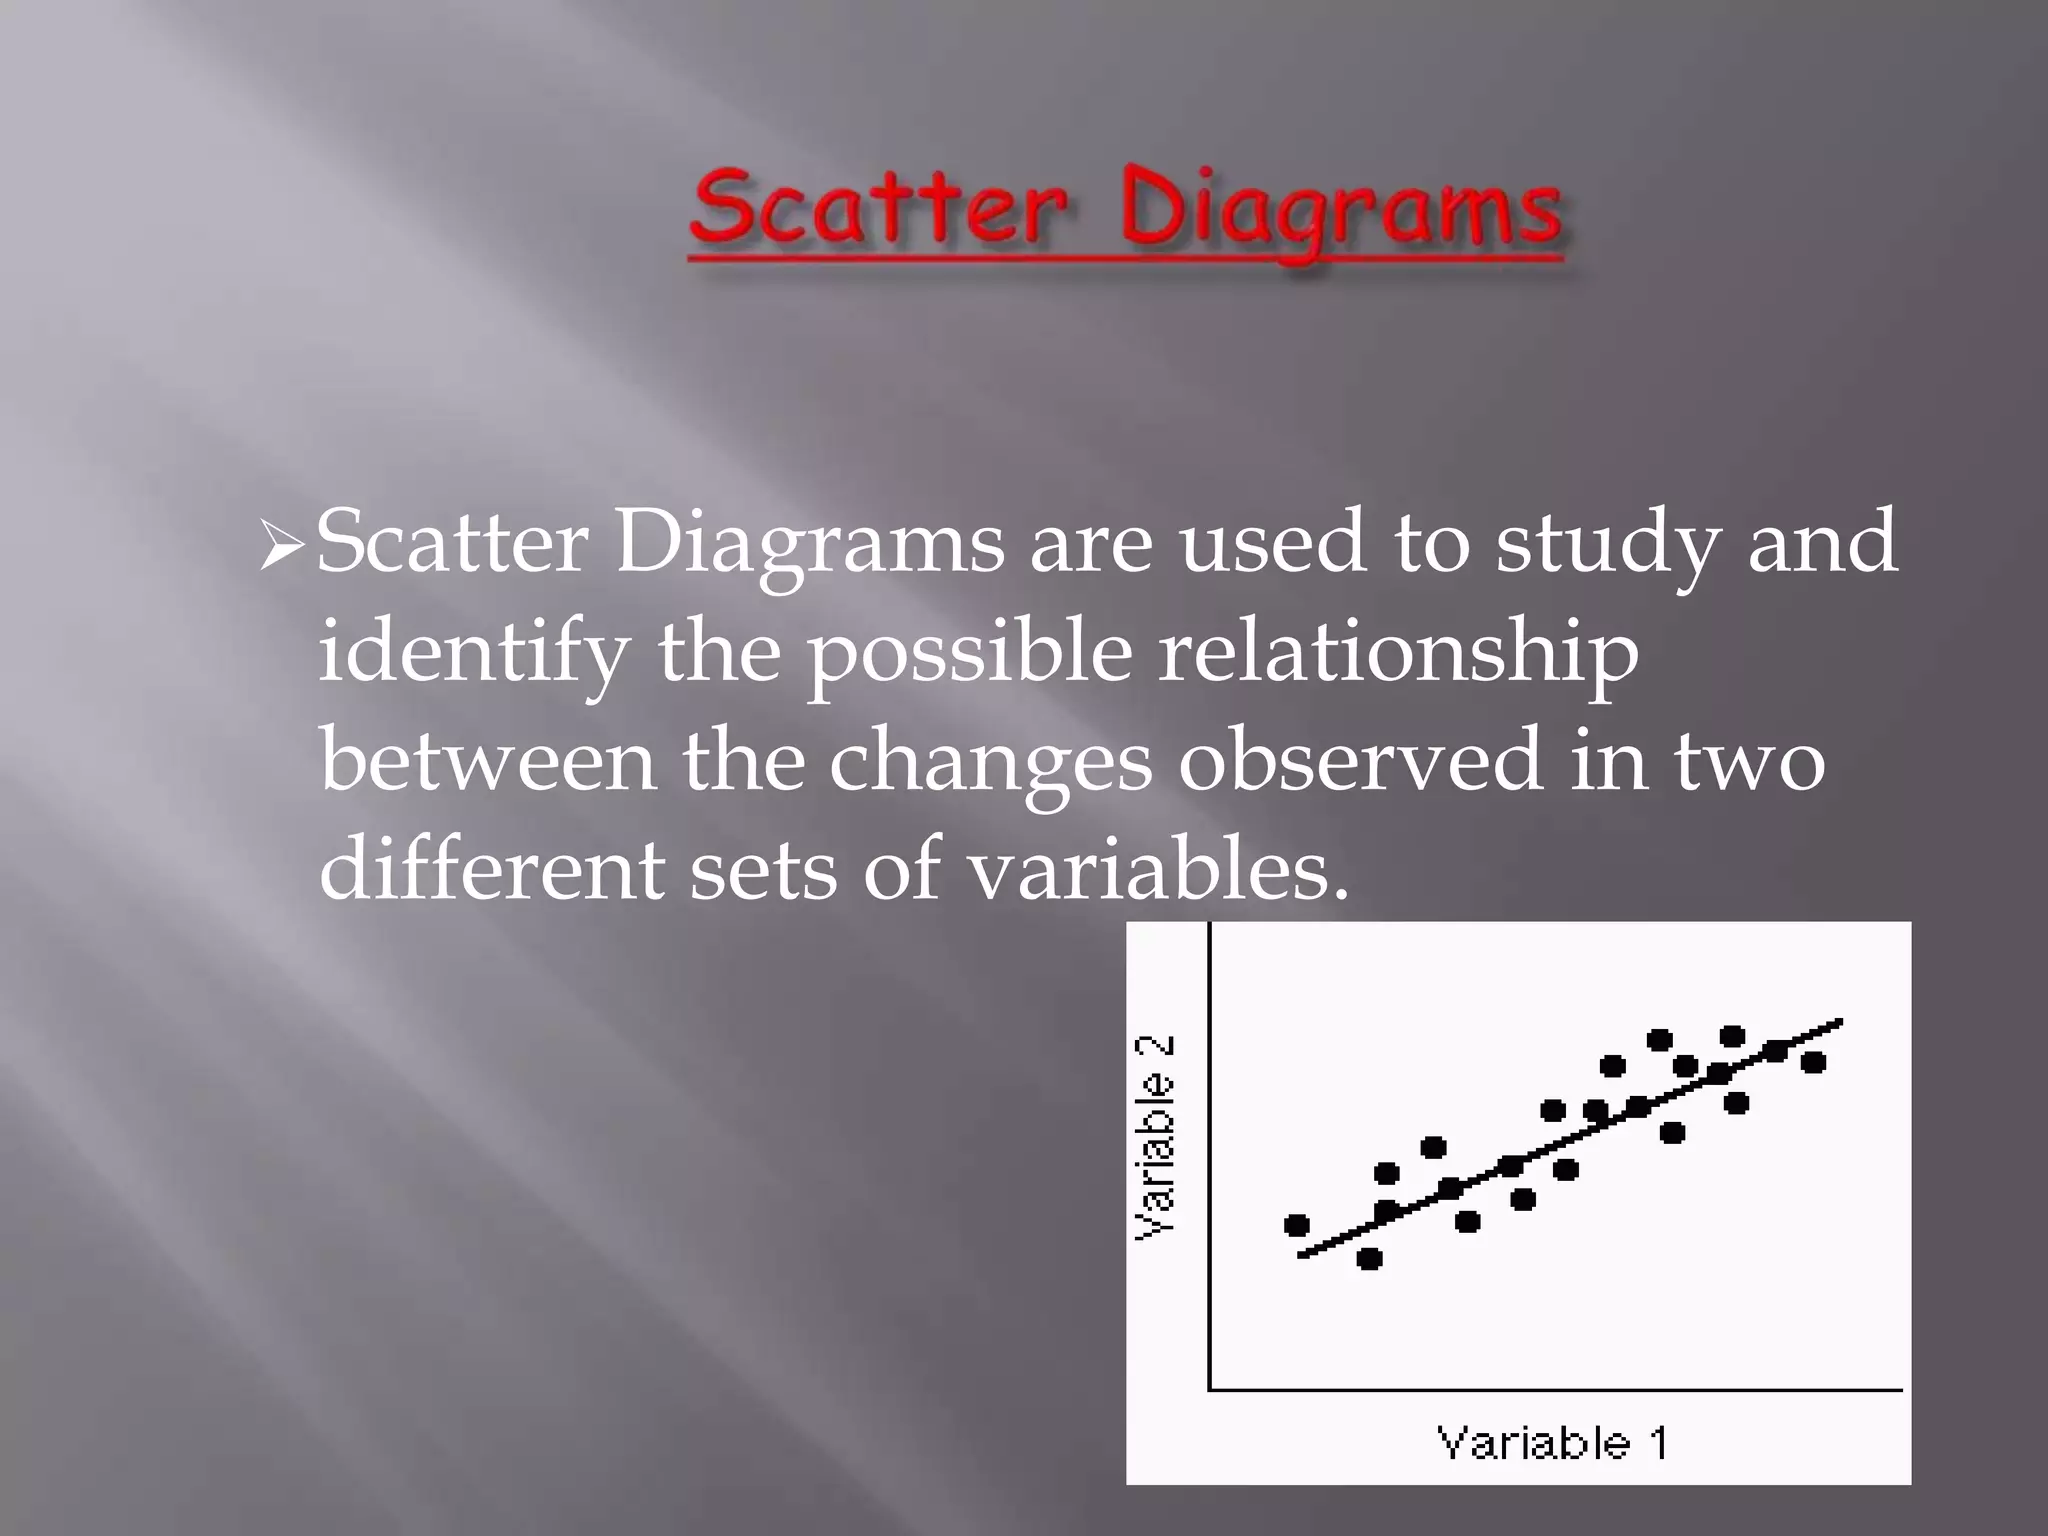
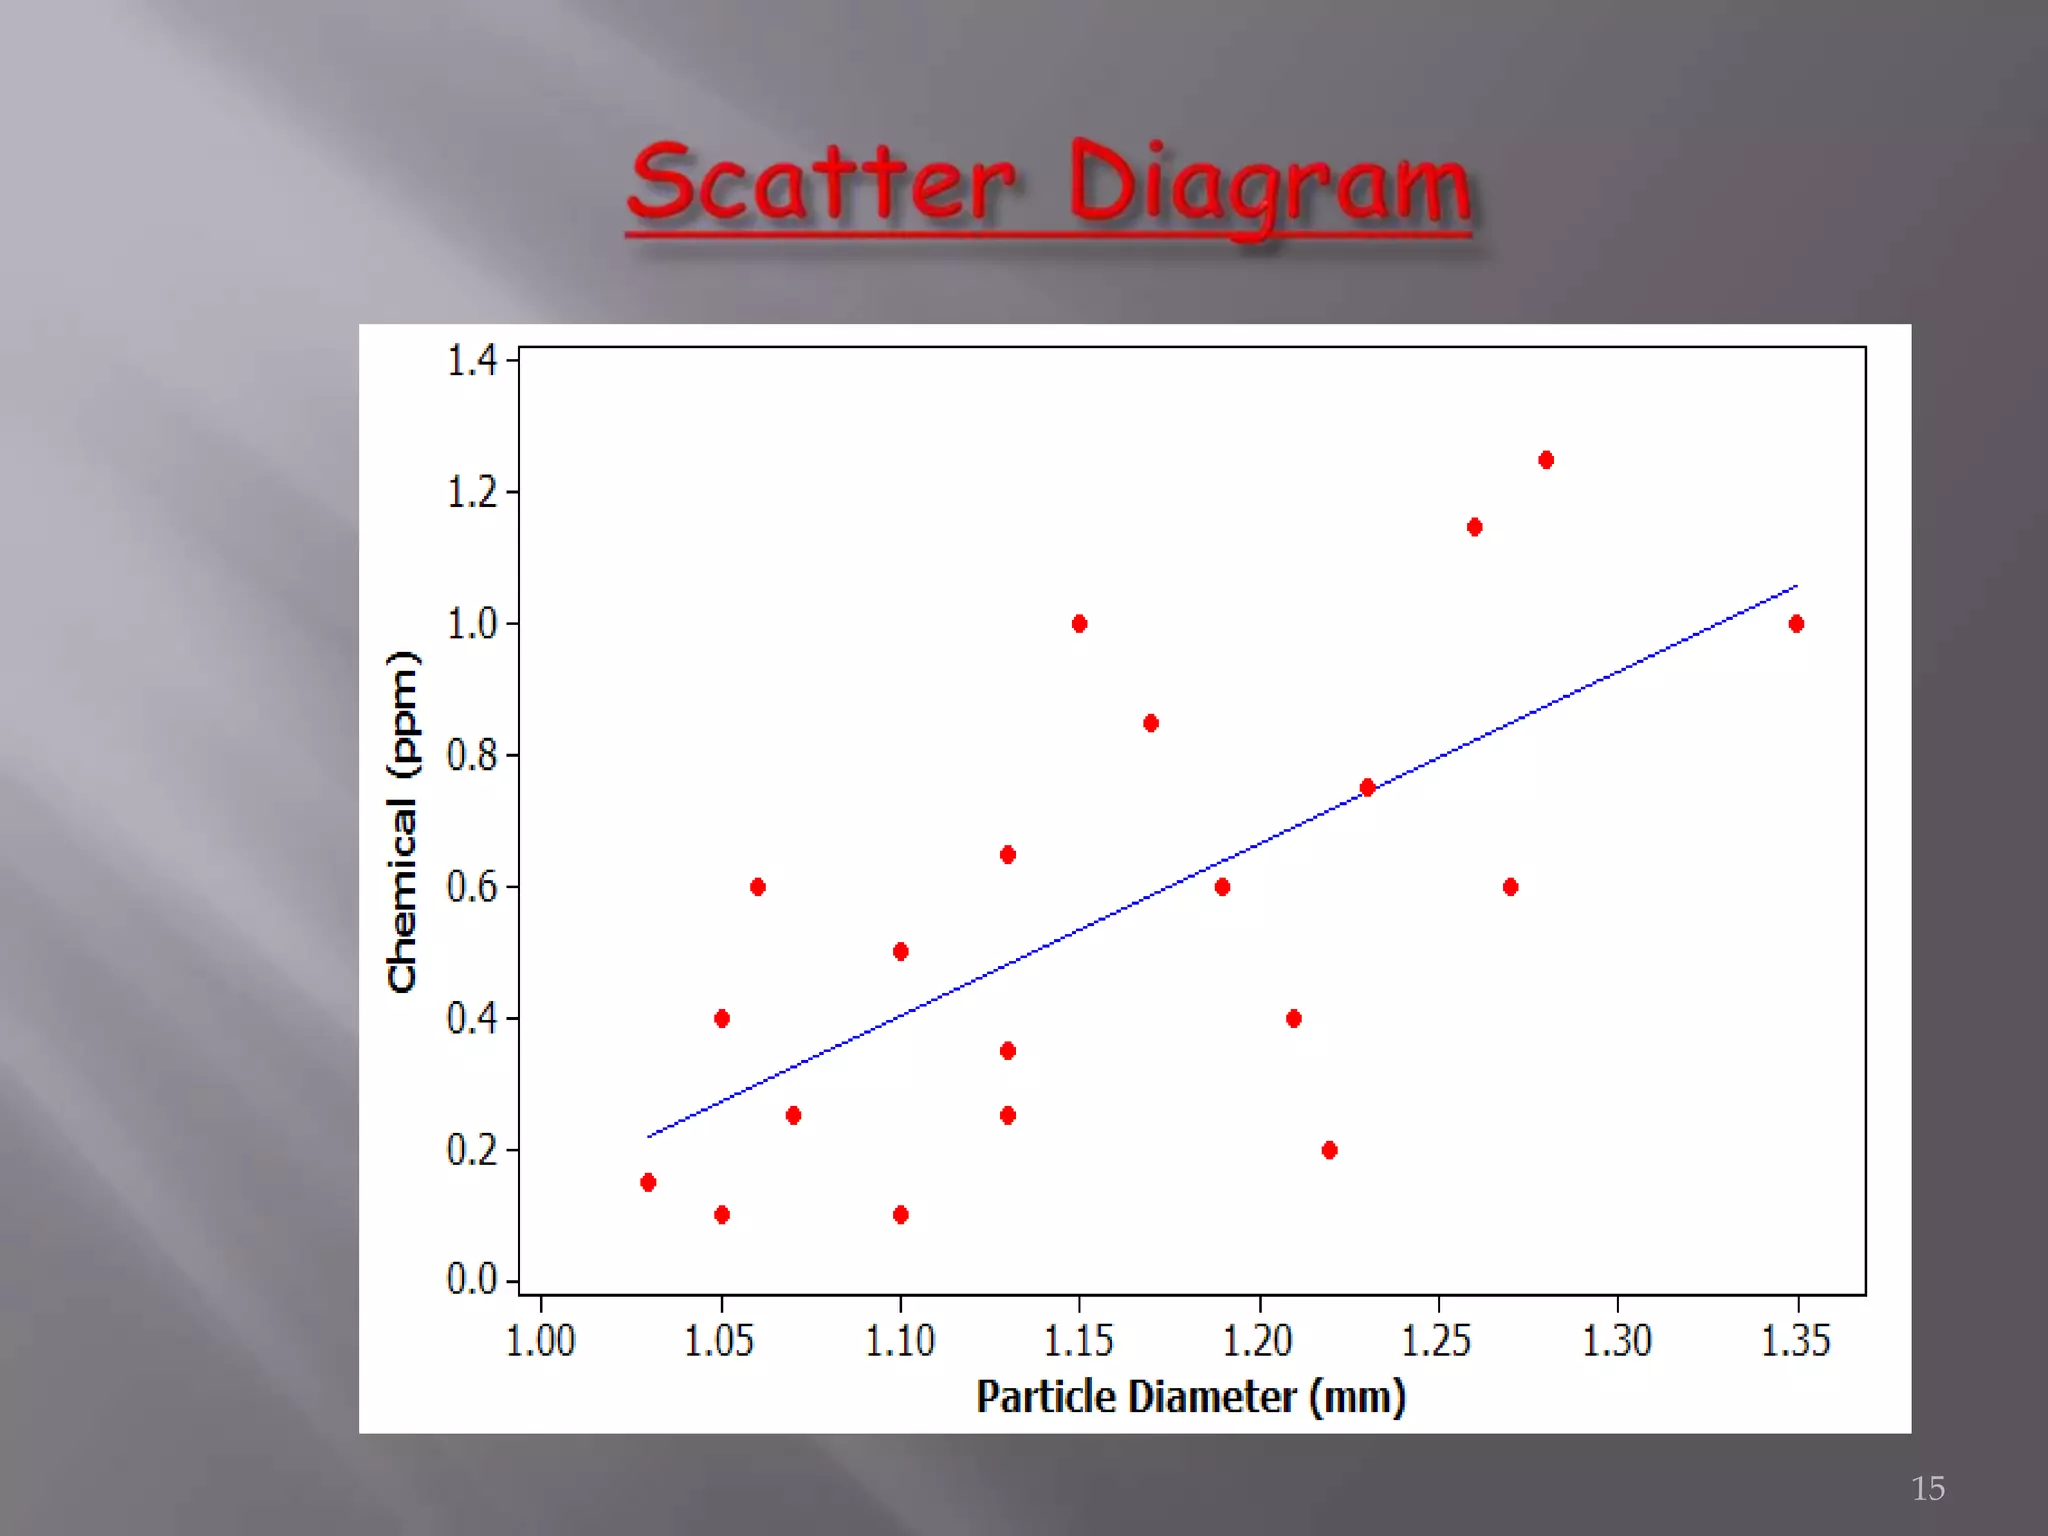

The document discusses the seven basic quality tools which are histograms, Pareto charts, cause-and-effect diagrams, flowcharting, control charts, checklists, and scatter diagrams. These quality tools can be applied to improve quality in organizations, manufacturing processes, and individual processes. They were first emphasized by Kaoru Ishikawa and help evaluate data distribution, identify important causes, examine relationships between variables, and ensure consistency in processes.


![7 qc tools training material[1]](https://cdn.slidesharecdn.com/ss_thumbnails/7qctoolstrainingmaterial1-120925054558-phpapp02-thumbnail.jpg?width=640&height=640&fit=bounds)


![7 qc tools[1] to print](https://cdn.slidesharecdn.com/ss_thumbnails/7qctools1toprint-191017092858-thumbnail.jpg?width=640&height=640&fit=bounds)


