Download as PDF, PPTX


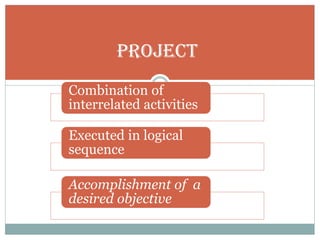

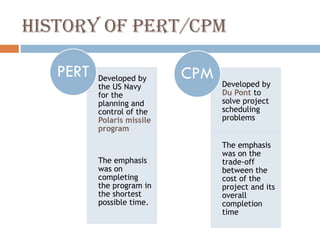
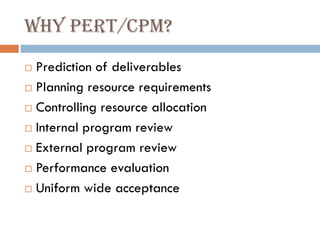
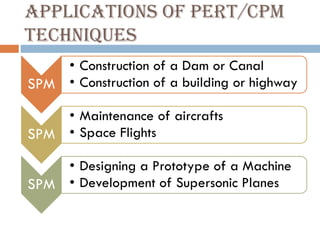
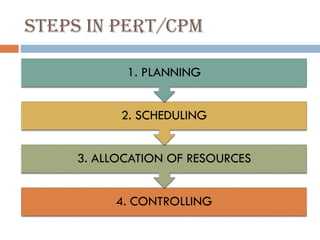
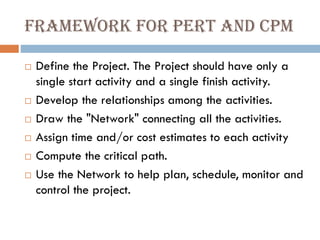
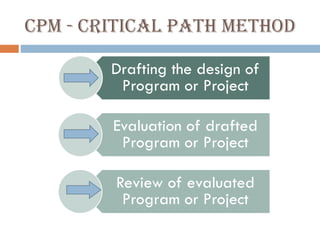
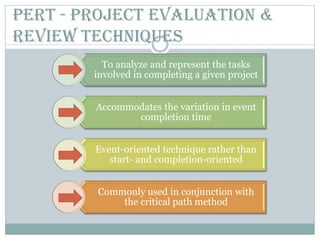
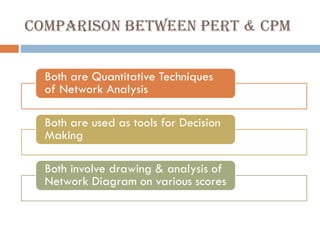
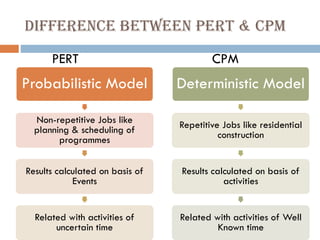
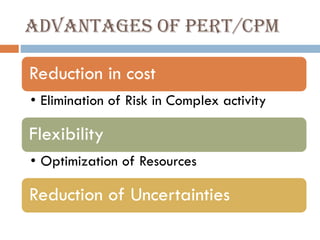
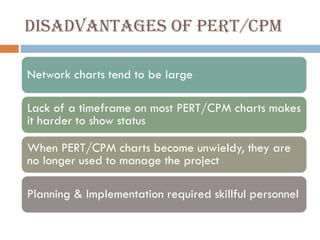


This document discusses network diagrams, PERT (Project Evaluation and Review Technique), and CPM (Critical Path Method) for project scheduling. It provides the history and applications of PERT/CPM, the steps involved, and compares PERT and CPM. Key points covered include defining a project, developing activity relationships, drawing the network diagram, estimating activity times, determining the critical path, and using the network to plan and control the project. Advantages and disadvantages of PERT/CPM techniques are also presented.