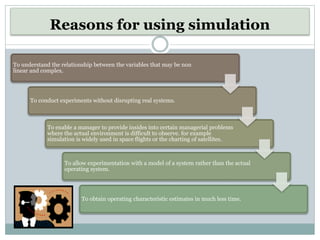
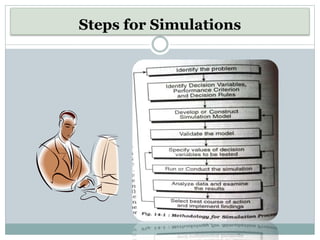
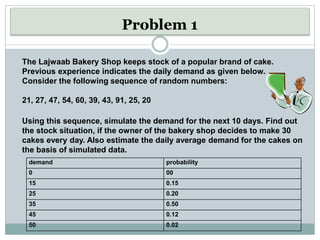
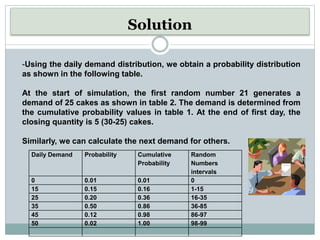
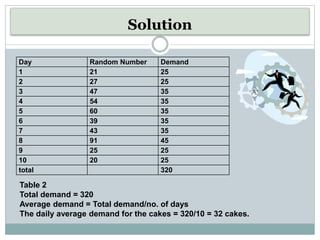
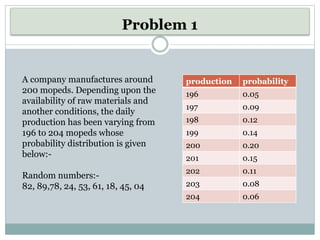
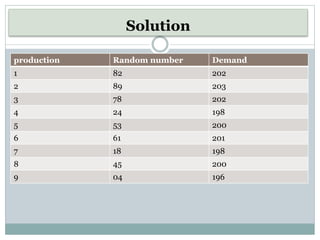
SIMULATION
OPERATION RESEARCH
Presented by:
Komal Hambir
Nikita Jain
Bansri Shah
Ruchira Mohite
Simulation
Simulation is based on the random numbers and
probabilities, it provides the decision maker with useful
information like how likely each outcome can be expected.
This is a versatile tool which deals itself to the solution of
a large variety of O.R problems which are otherwise
difficult to solve.
It is a technique for carrying out experiments for
analyzing the behavior and evaluating the performance of
a proposed system under assumed condition of reality
Simulation
Simulation typically involves
• Initialization of the system to some specified
state.
• Generation of the inputs to the system.
• Operation of the system under the particular
state input configuration according to the
rules laid down by the procedural model.
• Observation and collection of statistics on the
performance of the system.
Reasons for using simulation
To understand the relationship between the variables that may be non
linear and complex.
To conduct experiments without disrupting real systems.
To enable a manager to provide insides into certain managerial problems
where the actual environment is difficult to observe. for example
simulation is widely used in space flights or the charting of satellites.
To allow experimentation with a model of a system rather than the actual
operating system.
To obtain operating characteristic estimates in much less time.
Applications
 Testing the impact of various policy decisions
through corporate planning models.
 Financial studies involving risky investments.
 Determining ambulance and fire fighting- fire
fighting equipments location and dispatching.
 Design of distribution system parking lots and
communication systems.
 Testing a series of inventory order policies to find the
least cost order point.
Steps for Simulations
Advantages
 Flexible and straightforward technique.
 To analyze large and complex real world systems.
 Used in solving problems where all values of the
variable are not known or are partly known.
 It does not interfere with real world system as
experiments are done with models and not on the
system itself.
 Easier to apply.
Limitations
Does not produce optimal results.
Very expensive as it takes years to develop a useable
corporate planning model.
Long and complicated process.
Each simulation process is unique and its solution and
interferences are not usually transferable to other
problems
Problem 1
demand probability
0 00
15 0.15
25 0.20
35 0.50
45 0.12
50 0.02
The Lajwaab Bakery Shop keeps stock of a popular brand of cake.
Previous experience indicates the daily demand as given below.
Consider the following sequence of random numbers:
21, 27, 47, 54, 60, 39, 43, 91, 25, 20
Using this sequence, simulate the demand for the next 10 days. Find out
the stock situation, if the owner of the bakery shop decides to make 30
cakes every day. Also estimate the daily average demand for the cakes on
the basis of simulated data.
Solution
Daily Demand Probability Cumulative
Probability
Random
Numbers
intervals
0 0.01 0.01 0
15 0.15 0.16 1-15
25 0.20 0.36 16-35
35 0.50 0.86 36-85
45 0.12 0.98 86-97
50 0.02 1.00 98-99
-Using the daily demand distribution, we obtain a probability distribution
as shown in the following table.
At the start of simulation, the first random number 21 generates a
demand of 25 cakes as shown in table 2. The demand is determined from
the cumulative probability values in table 1. At the end of first day, the
closing quantity is 5 (30-25) cakes.
Similarly, we can calculate the next demand for others.
Solution
Day Random Number Demand
1 21 25
2 27 25
3 47 35
4 54 35
5 60 35
6 39 35
7 43 35
8 91 45
9 25 25
10 20 25
total 320
Table 2
Total demand = 320
Average demand = Total demand/no. of days
The daily average demand for the cakes = 320/10 = 32 cakes.
A company manufactures around
200 mopeds. Depending upon the
availability of raw materials and
another conditions, the daily
production has been varying from
196 to 204 mopeds whose
probability distribution is given
below:-
Random numbers:-
82, 89,78, 24, 53, 61, 18, 45, 04
production probability
196 0.05
197 0.09
198 0.12
199 0.14
200 0.20
201 0.15
202 0.11
203 0.08
204 0.06
Problem 1
production probability Cumulative
probability
Random
number
intervals
196 0.05 0.05 00-4
197 0.09 0.14 5-13
198 0.12 0.26 13-25
199 0.14 0.40 26-3
200 0.20 0.60 40-59
201 0.15 0.75 60-74
202 0.11 0.86 75-85
203 0.08 0.94 86-93
204 0.06 1 94-100
Solution
production Random number Demand
1 82 202
2 89 203
3 78 202
4 24 198
5 53 200
6 61 201
7 18 198
8 45 200
9 04 196
Solution
Total demand = 1800
Average demand = total demand/no of days
1800/9
200 mepods/day
Solution
OPERATION RESEARCH Simulation

OPERATION RESEARCH Simulation

  • 1.
    SIMULATION OPERATION RESEARCH Presented by: KomalHambir Nikita Jain Bansri Shah Ruchira Mohite
  • 2.
    Simulation Simulation is basedon the random numbers and probabilities, it provides the decision maker with useful information like how likely each outcome can be expected. This is a versatile tool which deals itself to the solution of a large variety of O.R problems which are otherwise difficult to solve. It is a technique for carrying out experiments for analyzing the behavior and evaluating the performance of a proposed system under assumed condition of reality
  • 3.
    Simulation Simulation typically involves •Initialization of the system to some specified state. • Generation of the inputs to the system. • Operation of the system under the particular state input configuration according to the rules laid down by the procedural model. • Observation and collection of statistics on the performance of the system.
  • 4.
    Reasons for usingsimulation To understand the relationship between the variables that may be non linear and complex. To conduct experiments without disrupting real systems. To enable a manager to provide insides into certain managerial problems where the actual environment is difficult to observe. for example simulation is widely used in space flights or the charting of satellites. To allow experimentation with a model of a system rather than the actual operating system. To obtain operating characteristic estimates in much less time.
  • 5.
    Applications  Testing theimpact of various policy decisions through corporate planning models.  Financial studies involving risky investments.  Determining ambulance and fire fighting- fire fighting equipments location and dispatching.  Design of distribution system parking lots and communication systems.  Testing a series of inventory order policies to find the least cost order point.
  • 6.
  • 7.
    Advantages  Flexible andstraightforward technique.  To analyze large and complex real world systems.  Used in solving problems where all values of the variable are not known or are partly known.  It does not interfere with real world system as experiments are done with models and not on the system itself.  Easier to apply.
  • 8.
    Limitations Does not produceoptimal results. Very expensive as it takes years to develop a useable corporate planning model. Long and complicated process. Each simulation process is unique and its solution and interferences are not usually transferable to other problems
  • 9.
    Problem 1 demand probability 000 15 0.15 25 0.20 35 0.50 45 0.12 50 0.02 The Lajwaab Bakery Shop keeps stock of a popular brand of cake. Previous experience indicates the daily demand as given below. Consider the following sequence of random numbers: 21, 27, 47, 54, 60, 39, 43, 91, 25, 20 Using this sequence, simulate the demand for the next 10 days. Find out the stock situation, if the owner of the bakery shop decides to make 30 cakes every day. Also estimate the daily average demand for the cakes on the basis of simulated data.
  • 10.
    Solution Daily Demand ProbabilityCumulative Probability Random Numbers intervals 0 0.01 0.01 0 15 0.15 0.16 1-15 25 0.20 0.36 16-35 35 0.50 0.86 36-85 45 0.12 0.98 86-97 50 0.02 1.00 98-99 -Using the daily demand distribution, we obtain a probability distribution as shown in the following table. At the start of simulation, the first random number 21 generates a demand of 25 cakes as shown in table 2. The demand is determined from the cumulative probability values in table 1. At the end of first day, the closing quantity is 5 (30-25) cakes. Similarly, we can calculate the next demand for others.
  • 11.
    Solution Day Random NumberDemand 1 21 25 2 27 25 3 47 35 4 54 35 5 60 35 6 39 35 7 43 35 8 91 45 9 25 25 10 20 25 total 320 Table 2 Total demand = 320 Average demand = Total demand/no. of days The daily average demand for the cakes = 320/10 = 32 cakes.
  • 12.
    A company manufacturesaround 200 mopeds. Depending upon the availability of raw materials and another conditions, the daily production has been varying from 196 to 204 mopeds whose probability distribution is given below:- Random numbers:- 82, 89,78, 24, 53, 61, 18, 45, 04 production probability 196 0.05 197 0.09 198 0.12 199 0.14 200 0.20 201 0.15 202 0.11 203 0.08 204 0.06 Problem 1
  • 13.
    production probability Cumulative probability Random number intervals 1960.05 0.05 00-4 197 0.09 0.14 5-13 198 0.12 0.26 13-25 199 0.14 0.40 26-3 200 0.20 0.60 40-59 201 0.15 0.75 60-74 202 0.11 0.86 75-85 203 0.08 0.94 86-93 204 0.06 1 94-100 Solution
  • 14.
    production Random numberDemand 1 82 202 2 89 203 3 78 202 4 24 198 5 53 200 6 61 201 7 18 198 8 45 200 9 04 196 Solution
  • 15.
    Total demand =1800 Average demand = total demand/no of days 1800/9 200 mepods/day Solution