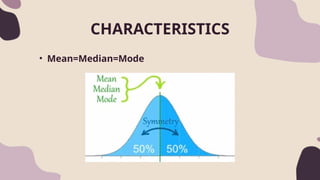
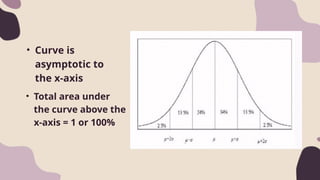
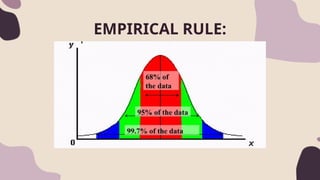
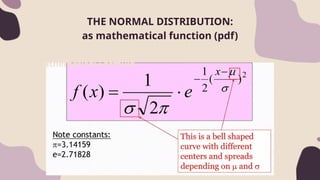
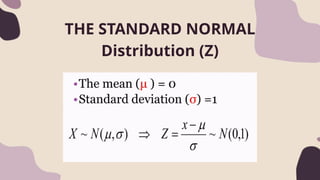
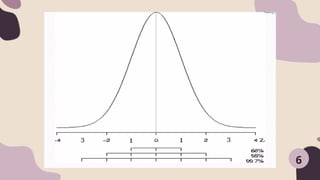
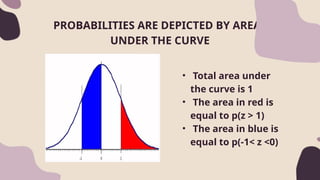
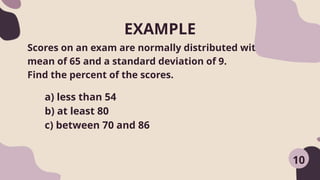
The document presents an overview of the normal distribution, defining it as a continuous frequency distribution with a bell-shaped curve where the mean, median, and mode are equal. It emphasizes its importance in making inferences about variables assumed to be normally distributed, as well as discussing the empirical rule and its mathematical representations. An example is provided to illustrate the application of the normal distribution in interpreting exam scores.


![NORMAL DISTRIBUTION FIN [Autosaved].pptx](https://cdn.slidesharecdn.com/ss_thumbnails/normaldistributionfinautosaved-250706062357-4c5756a9-thumbnail.jpg?width=640&height=640&fit=bounds)


