Downloaded 205 times
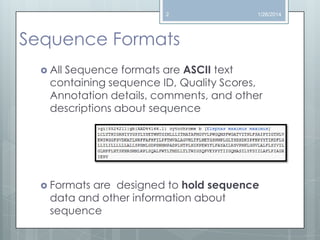
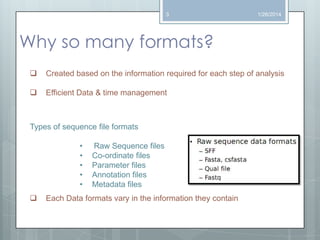
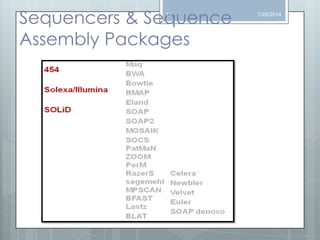
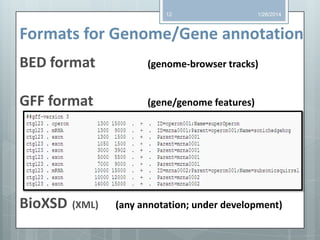
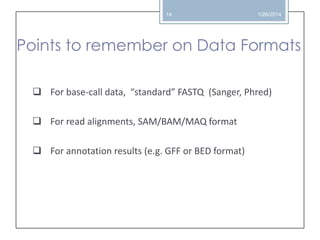
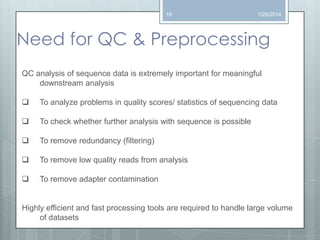
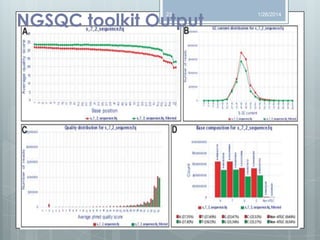
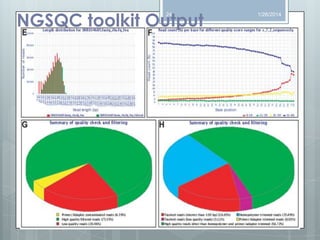
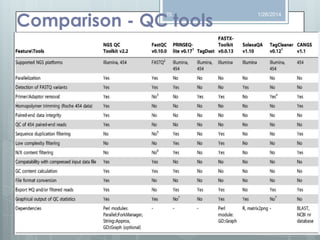
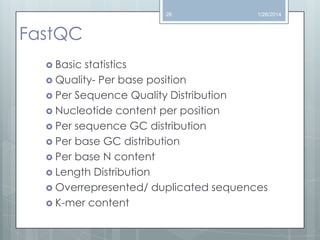

The document discusses various next-generation sequencing (NGS) data formats and quality control (QC) analysis methods. It outlines different sequence file formats, including FASTQ, SAM/BAM, GFF, and BED, highlighting their applications in sequencing analysis and gene annotation. The importance of QC tools, such as NGS QC Toolkit and FastQC, is emphasized for filtering low-quality sequences and ensuring reliable results in downstream analyses.