Downloaded 309 times

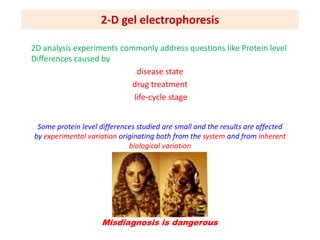


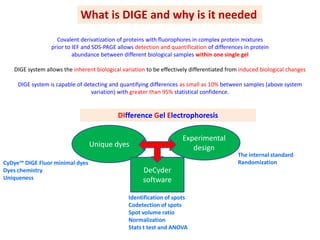
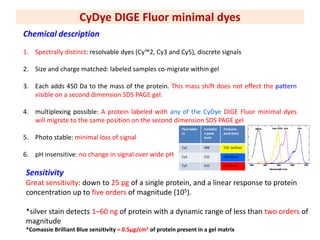
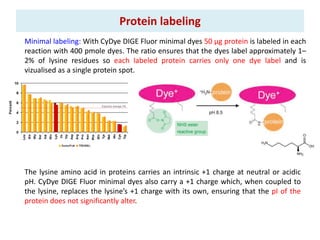


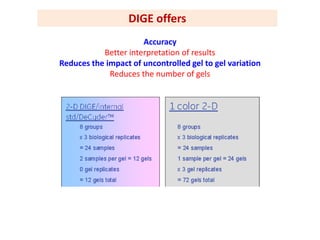
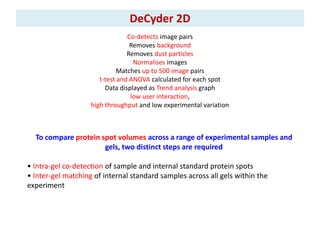


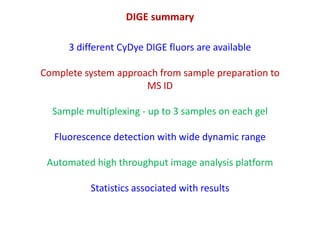

The document discusses 2D gel electrophoresis and the limitations of conventional 2D gels. It introduces Difference Gel Electrophoresis (DIGE), which uses spectrally distinct fluorescent dyes to label protein samples before running multiple samples on the same 2D gel. This allows direct comparison of protein abundance levels between samples and eliminates gel-to-gel variation. The document outlines the experimental design, statistical analysis software, and advantages of DIGE over conventional 2D gels such as increased accuracy, reduced variation, and ability to detect small protein differences.


