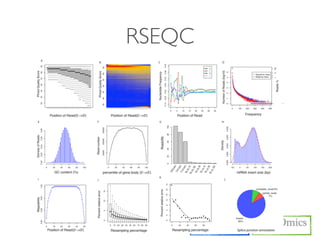
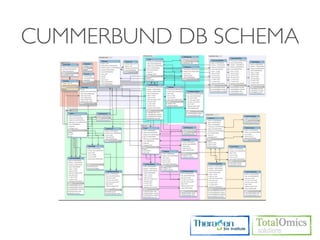
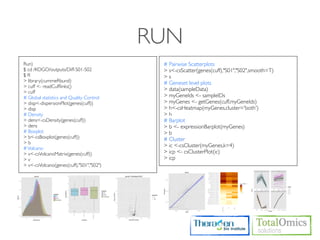
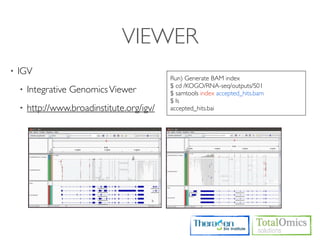
Download as PDF, PPTX
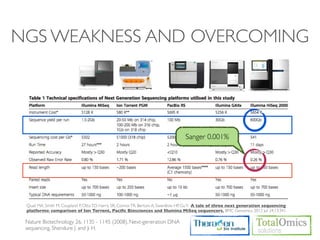
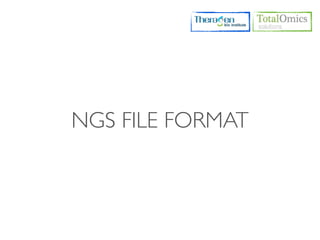
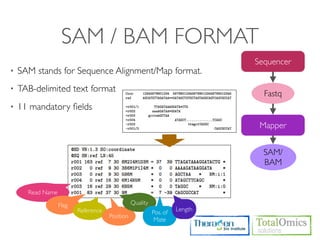
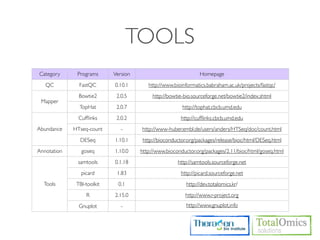
![SAMPLE QUALITY SCORE
Usage)
$ TBI-toolkit-qscore [FASTQ]
Sanger(Phred33) or Illumina 1.8+
0 to 93 using ASCII 33 to 126
Run)
$ cd /KOGO/RNA-seq/inputs
$ TBI-toolkit-qscore S01_1.fq.gz
Sanger(Phred33) or Illumina 1.8+
0 to 93 using ASCII 33 to 126
0:1, 1:”, 2:#, 3:$, 4:%, 5:&, ......](https://image.slidesharecdn.com/kogo2013workshopv3wh-130215022246-phpapp01/85/Kogo-2013-RNA-seq-analysis-50-320.jpg)
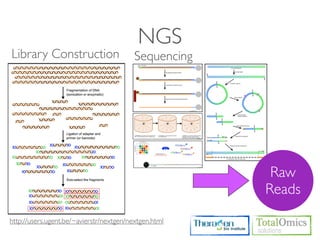
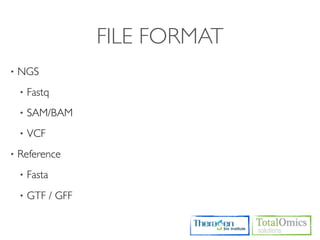
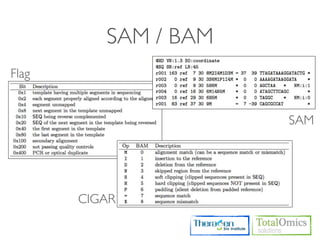
![REFERENCE INDEX
Index for bowtie2 mapper
Usage)
$ bowtie2-build [options] <reference_in> <bt2_base>
Run)
$ cd /KOGO/RNA-seq/ref
$ bowtie2-build chr.fa chr.fa
$ ls
chr.fa.1.bt2 chr.fa.2.bt2 ......
Fasta index
Usage)
$ samtools faidx <ref.fasta>
Run)
$ cd /KOGO/RNA-seq/ref
$ samtools faidx chr.fa
$ ls
chr.fa.fai](https://image.slidesharecdn.com/kogo2013workshopv3wh-130215022246-phpapp01/85/Kogo-2013-RNA-seq-analysis-51-320.jpg)
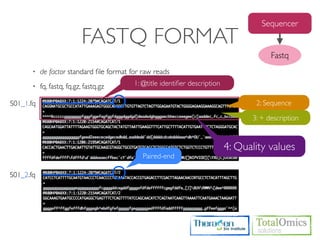
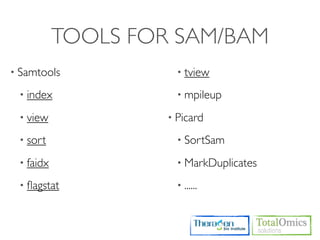
![MASK GENESET
...... We recommend including any annotated rRNA, mitochondrial transcripts other
abundant transcripts you wish to ignore in your analysis in this file. Due to variable
efficiency of mRNA enrichment methods and rRNA depletion kits, masking these
transcripts often improves the overall robustness of transcript abundance estimates.
cufflinks manuals (http://cufflinks.cbcb.umd.edu/manual.html)
Usage)
$ TBI-toolkit-gtf_selector [IN GTF] [OUT GTF] [Source 1] [Source 2] ......
Run)
$ cd /KOGO/RNA-seq/ref
$ TBI-toolkit-gtf_selector ens.gtf mask.gtf tRNA rRNA Mt_tRNA Mt_rRNA](https://image.slidesharecdn.com/kogo2013workshopv3wh-130215022246-phpapp01/85/Kogo-2013-RNA-seq-analysis-52-320.jpg)
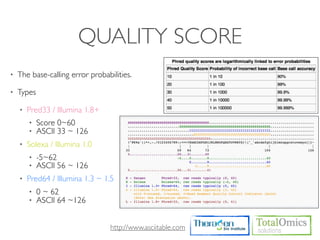
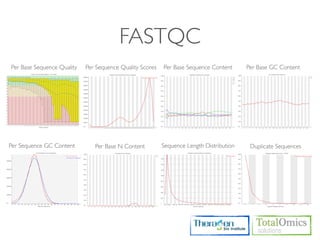
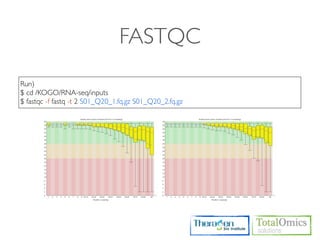
![FASTQC
Usages)
$ fastqc seqfile1 seqfile2 .. seqfileN
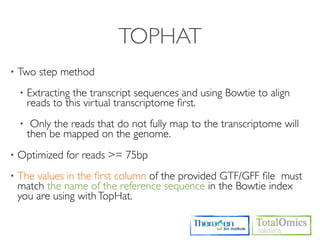
$ fastqc [-o output dir] [--(no)extract] [-f fastq|bam|sam] [-c contaminant file] seqfile1 .. seqfileN
Arguments
-f format bam,sam,bam_mapped,sam_mapped and fastq
-t threads
Run)
$ cd /KOGO/RNA-seq/inputs
$ fastqc -f fastq -t 2 S01_1.fq.gz S01_2.fq.gz
Output)
$ firefox R01_1.fq_fastqc/fastqc_report.html
$ firefox R01_2.fq_fastqc/fastqc_report.html](https://image.slidesharecdn.com/kogo2013workshopv3wh-130215022246-phpapp01/85/Kogo-2013-RNA-seq-analysis-57-320.jpg)
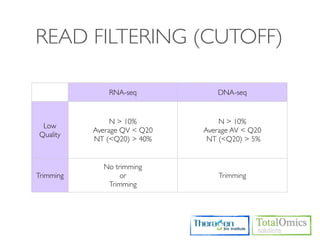
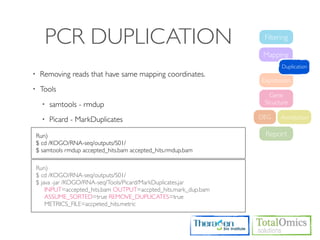
![FILTERING
Usages)
$ TBI-toolkit filter [option*] seqfile_1 seqfile_2 output_1 output_2
Option)
-n N_ratio
-a integer : Average QV of read
-m NT_ratio < QV
Run)
$ cd /KOGO/RNA-seq/inputs
$ TBI-toolkit-fq_filter -n 0.1 -m 0.4 -a 20 S01_1.fq.gz S01_2.fq.gz S01_Q20_1.fq.gz S01_Q20_2.fq.gz
$ ls
S01_Q20_1.fq.gz S01_Q20_2.fq.gz S01_Q20.log S01_Q20.err
$ cat S01_Q20.log
$ less S01_Q20.err](https://image.slidesharecdn.com/kogo2013workshopv3wh-130215022246-phpapp01/85/Kogo-2013-RNA-seq-analysis-61-320.jpg)
![USAGE
Usage
$ tophat [options] <bowtie_index_base> <reads1_1> <reads1_2>
Option Value Description
-o/--output-dir string The default is "./tophat_out".
-p/--num-threads int Use this many threads to align reads. The default is 1.
-r/--mate-inner-dist int This is the expected (mean) inner distance between mate pairs.The default is 50bp
The standard deviation for the distribution on inner distances between mate pairs.
--mate-std-dev int
The default is 20bp.
fr-unstranded fr-unstranded : Standard Illumina
--library-type fr-firststrand fr-firststrand : dUTP, NSR, NNSR
fr-secondstrand fr-secondstrand : Ligation, Standard Solid
--solexa-quals - Use the Solexa scale for quality values in FASTQ files.
--solexa1.3-quals - Phred64/Illumina 1.3~1.5
-G/--GTF Geneset Geneset (GTF 2.2 or GFF3 formatted file)
--rg-id string Read group ID
--rg-sample string Sample ID](https://image.slidesharecdn.com/kogo2013workshopv3wh-130215022246-phpapp01/85/Kogo-2013-RNA-seq-analysis-66-320.jpg)
![USAGE
$ cufflinks [options] <aligned_reads.(sam/bam)>
Option Value Description
Sets the name of the directory in which Cufflinks will write all of its output.
-o/--output-dir String
The default is "./".
Quantification
-p/--num-threads int Use this many threads to align reads. The default is 1.
Use the supplied reference annotation (a GFF file) to estimate isoform
-G/--GTF geneset
expression. It will not assemble novel transcripts. Novel Isoforms
Use the supplied reference annotation (GFF) to guide RABT assembly.
-g/--GTF-guide geneset Output will include all reference transcripts as well as any novel genes and
isoforms that are assembled.
Improving
Ignore all reads that could have come from transcripts in this GTF file. We
-M/--mask-file mask geneset accuracy
recommend including any annotated rRNA, mitochondrial transcripts other
abundant transcripts you wish to ignore in your analysis in this file.
fr-unstranded fr-unstranded : Standard Illumina
--library-type fr-firststrand fr-firststrand : dUTP, NSR, NNSR /
fr-secondstrand fr-secondstrand : Ligation, Standard Solid](https://image.slidesharecdn.com/kogo2013workshopv3wh-130215022246-phpapp01/85/Kogo-2013-RNA-seq-analysis-83-320.jpg)
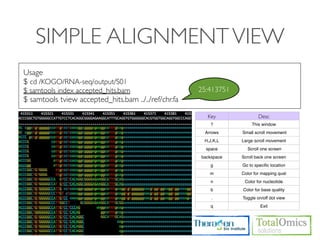
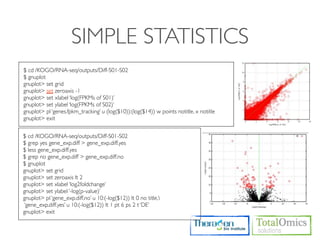
![SIMPLE STATISTICS
$ cd /KOGO/RNA-seq/outputs/S01
# Check higest expressed genes
$ sort -r -g -k 10 genes.fpkm_tracking | head -n 30
# Select FPKM S
$ cut -f 1,10 genes.fpkm_traking > gene_fpkm_s
#
$R
> data <- read.table(“gene_fpkm_s”, header=TRUE)
> fpkm_s <- as.numeric(data[,2])
>
> mean(fpkm_s)
> sd(fpkm_s)
>
> fpkm_s.log10 <- log(fpkm_s+1,10)
> bin_seq = seq(min(fpkm_s.log10-0.1),max(fpkm_s.log10+0.1),by=0.1)
> hist(fpkm_s.log10, breaks=bin_seq, xlab=‘log10(x+1)’, ylab=‘Number of genes’, axes=TRUE)
>
> boxplot(fpkm_s.log10)](https://image.slidesharecdn.com/kogo2013workshopv3wh-130215022246-phpapp01/85/Kogo-2013-RNA-seq-analysis-91-320.jpg)
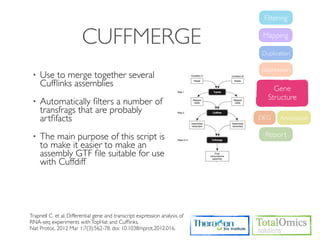
![USAGE
$ cuffmerge [options] <assembly_GTF_list.txt>
Option Value Description
-o <outprefix> Write the summary stats into the text output file <outprefix>(instead of stdout)
An optional "reference" annotation GTF. The input assemblies are merged together with
-g/--ref-gtf geneset
the reference GTF and included in the final output.
-p/--num-threads <int> Use this many threads to align reads. The default is 1.
This argument should point to the genomic DNA sequences for the reference. If a
directory, it should contain one fasta file per contig. If a multifasta file, all contigs should
be present. The merge script will pass this option to cuffcompare, which will use the
<seq_dir>/
-s/--ref-sequence sequences to assist in classifying transfrags and excluding artifacts (e.g. repeats). For
<seq_fasta>
example, Cufflinks transcripts consisting mostly of lower-case bases are classified as
repeats. Note that <seq_dir> must contain one fasta file per reference chromosome,
and each file must be named after the chromosome, and have a .fa or .fasta extension.](https://image.slidesharecdn.com/kogo2013workshopv3wh-130215022246-phpapp01/85/Kogo-2013-RNA-seq-analysis-95-320.jpg)
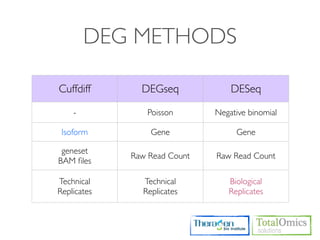
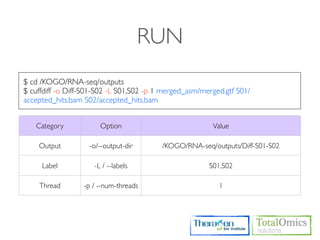
![CUFFDIFF
• Use to find significant changes in transcript expression,
splicing, and promoter use.
Usage)
$ cuffdiff [options]* <transcripts.gtf> <sample1_replicate1.sam[,...,sample1_replicateM]>
<sample2_replicate1.sam[,...,sample2_replicateM.sam]>
Option Value Description
-o / Sets the name of the directory in which Cuffdiff will write all
<string>
--output-dir of its output. The default is "./".
-L / Specify a label for each sample, which will be included in
<label1,label2,...,labelN>
--labels various output files produced by Cuffdiff.
-p /
<int> Use this many threads to align reads. The default is 1.
--num-threads](https://image.slidesharecdn.com/kogo2013workshopv3wh-130215022246-phpapp01/85/Kogo-2013-RNA-seq-analysis-104-320.jpg)
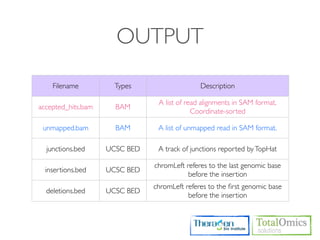
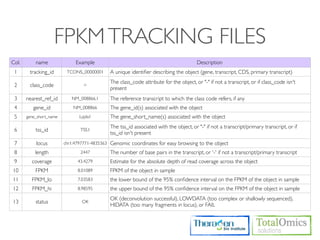
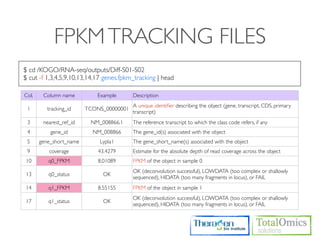
![OUTPUT
Type Files Description
genes.fpkm_tracking Gene [FPKMs, counts, read group tracking]. Tracks the summed
Genes genes.count_tracking [FPKMs, counts, read group tracking] of transcripts sharing each
genes.read_group_tracking gene_id
isoforms.fpkm_tracking
Isoforms isoforms.count_tracking Transcript [FPKMs, counts, read group tracking]
isoforms.read_group_tracking
cds.fpkm_tracking Coding sequence [FPKMs, counts, read group tracking]. Tracks
CDS cds.count_tracking the summed [FPKMs, counts, read group tracking] of transcripts
cds.read_group_tracking sharing each p_id, independent of tss_id
tss_groups.fpkm_tracking Primary transcript [FPKMs, counts, read group tracking]. Tracks
Primary
tss_groups.count_tracking the summed [FPKMs, counts, read group tracking] of transcripts
Transcripts
tss_groups.read_group_tracking sharing each tss_id](https://image.slidesharecdn.com/kogo2013workshopv3wh-130215022246-phpapp01/85/Kogo-2013-RNA-seq-analysis-106-320.jpg)
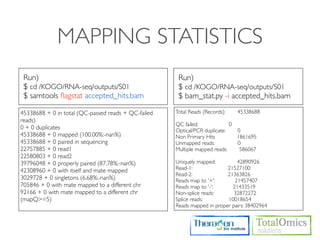
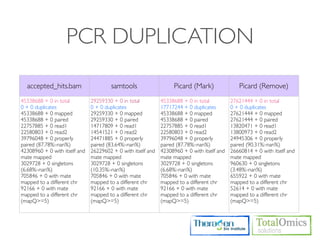
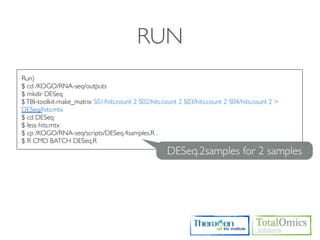
![HTSEQ-COUNT
If you have paired-end data, you have to sort the SAM file by read name first
Usage)
$ htseq-count [options] <sam_file> [gff_file, ensembl gtf]
Options)
-m [union,intersection-strict,intersection-nonempty]
-s.--stranded=<yes, no, or reverse>
whether the data is from a strand-specific assay (default: yes)
Run)
$ cd /KOGO/RNA-seq/outputs/S01
$ samtools sort -n accepted_hits.bam accepted_hits.nameSorted
$ samtools view accepted_hits.nameSorted.bam | htseq-count
-m union -s no - ../merged_asm/merged.gtf > accepted_hits.count
$ less accepted_hits.count
# ..... for (S02, S03, S04)](https://image.slidesharecdn.com/kogo2013workshopv3wh-130215022246-phpapp01/85/Kogo-2013-RNA-seq-analysis-113-320.jpg)

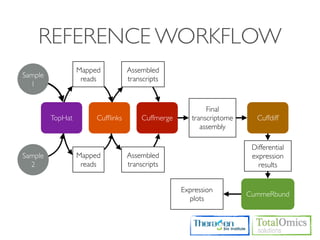
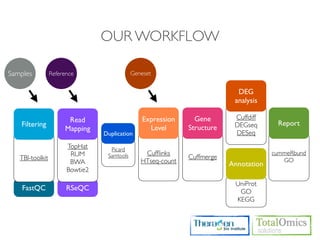
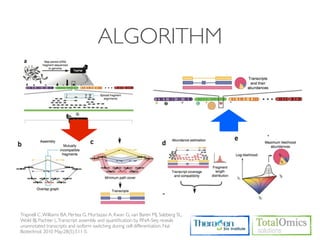
The document describes an RNA-seq analysis workflow that includes: 1. Preprocessing raw reads including quality control, filtering, and alignment to a reference genome using tools like FastQC, Bowtie2, and TopHat. 2. Assembling transcripts and estimating abundance using Cufflinks and HTseq-count. 3. Identifying differentially expressed genes between samples using DESeq and Cuffdiff. 4. Providing gene annotations and visualizing results using tools like GO, KEGG, and CummeRbund. The workflow follows a typical reference-based analysis approach and uses various open source tools for read mapping, assembly, quantification, and differential expression.