Downloaded 169 times


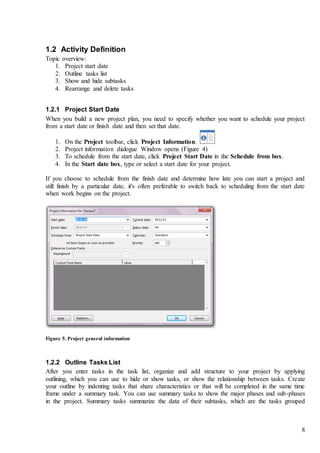


![13
To select nonadjacent tasks, hold down CTRL, and then click the tasks you want to link. To select
adjacent tasks, hold down SHIFT, and then click the first and last tasks you want to link.
You can choose between two different scheduling modes:
Manually Schedule – task start and finish dates are entered manually.
Auto Schedule – task start and finish dates are calculated automatically.
1.4.2 Delete Links
If you want to unlink tasks, select the tasks you want to unlink in the Task Name field, and then
click Unlink Tasks .
1.4.3 Links and summary tasks
Alternatives how to link summary tasks
A B C
1.4.4 Link Types
There are four kinds of task dependencies: Finish-to-start [FS], Start-to-start [SS], Finish-to-finish
[FF], and Start-to-finish [SF]. A simple finish-to-start link does not work in every situation.
Microsoft Project provides additional types of task links so you can model your project realistically.
For example, when two tasks need to start at the same time, you can create a start-to-start link.
When tasks need to finish at the same time, you can use a finish-to-finish link.
To change a task link:
1. On Gantt Chart,
2. Double-click the link line between the two tasks you want to change,
3. The Task dependency dialogue box will appear.
(FS) Finish-to-Start
(SS) Start-to-Start
(FF) Finish-to-Finish
(SF) Start-to-Finish](https://image.slidesharecdn.com/mspbasicsomeadvanced-en-20170425-180531201248/85/MS-Project-13-320.jpg)


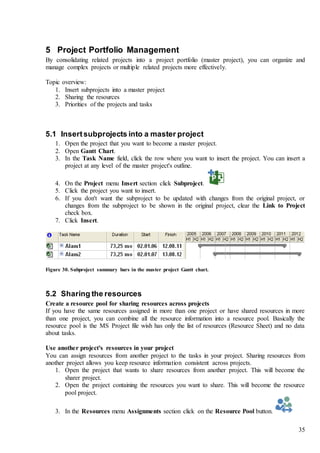


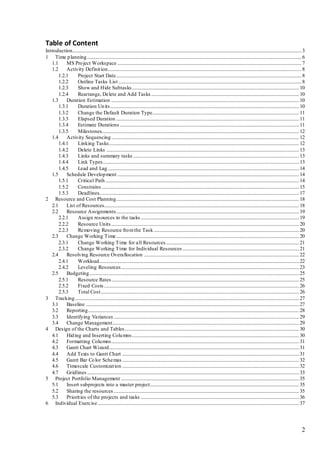
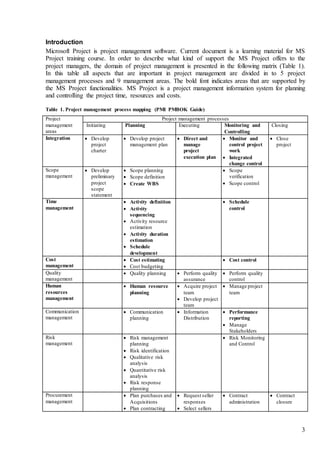
This document provides an overview of how to use Microsoft Project to plan and manage projects. It discusses setting up the project workspace and defining tasks, estimating durations, sequencing tasks, developing a schedule, assigning resources and tracking costs, tracking progress against the baseline, reporting on variances, and customizing Gantt charts and timescales. The document also covers inserting subprojects into a master project and sharing resources between projects as part of project portfolio management in MS Project.