Downloaded 344 times
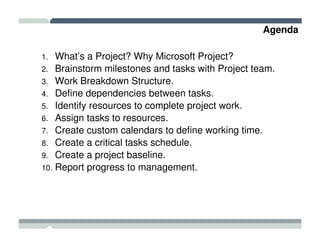
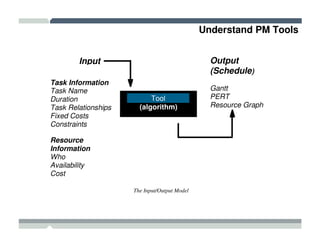
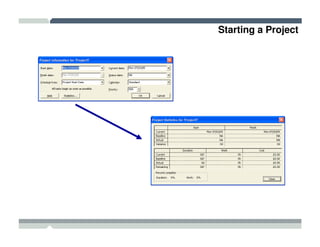
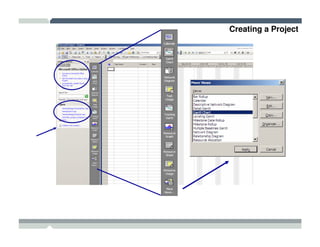
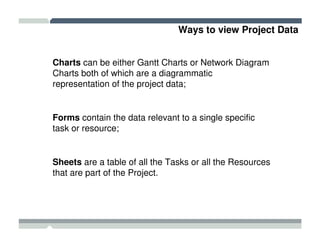
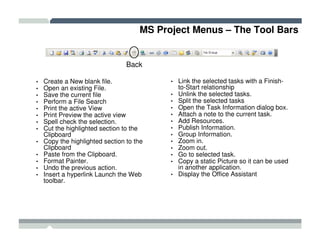
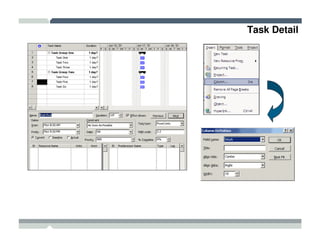
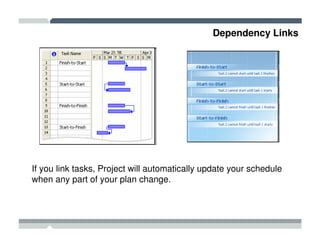
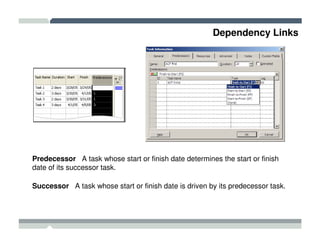
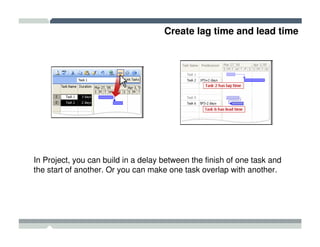
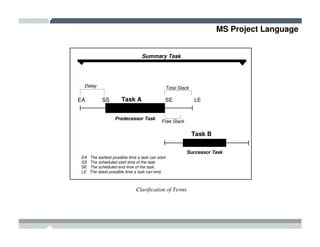
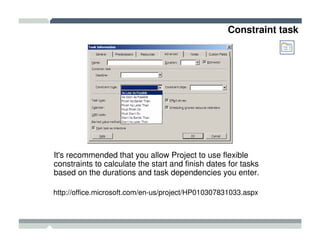
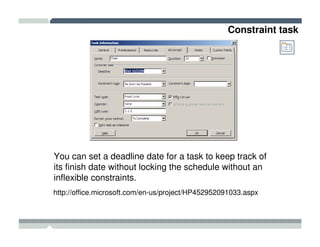
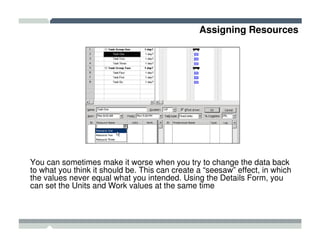
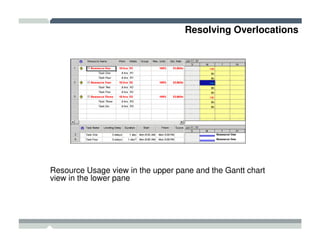
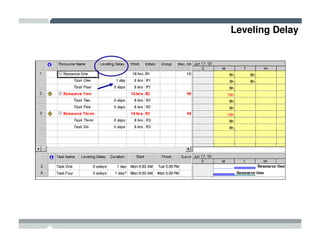
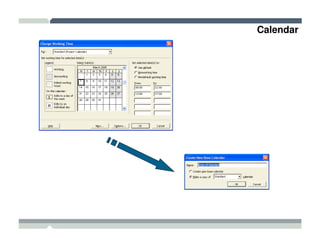
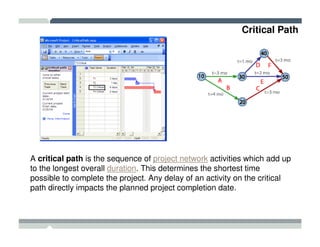
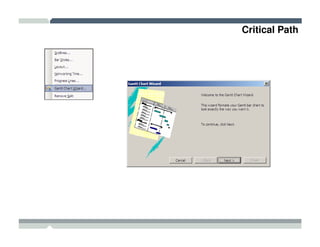
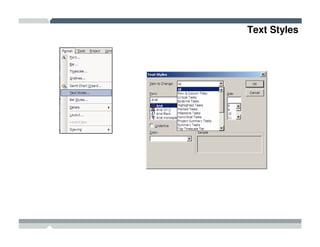
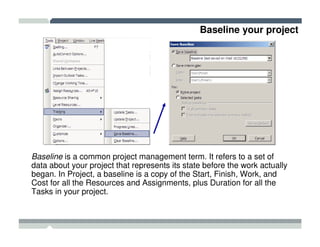
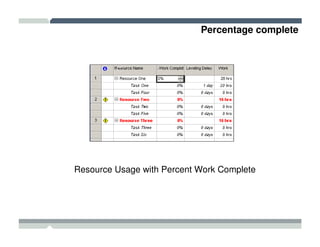
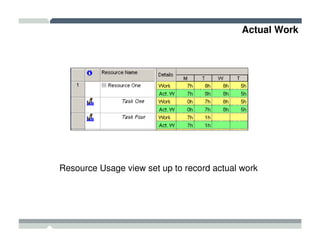
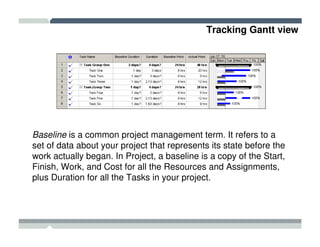
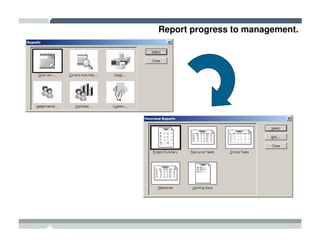


The seminar covered how to use Microsoft Project to plan and manage projects. It included how to define tasks, milestones, and resources, set dependencies between tasks, assign resources to tasks, track progress against the baseline, and report status to management. Formatting tools and views like the Gantt chart, network diagram, and resource usage were also demonstrated to visualize the project schedule and resource allocation.