Download as PDF, PPTX


![PLANNING USING PRIMAVERA PROFESSIONAL P6 18.8 (BY MATIWOS TSEGAYE
85
excavation work is 4000m³ in average formation and the daily (8-hr) productivity of excavator is
100m², the duration will be 40 days (4000/100) for an excavator, if 4 excavators are daily allocated
the duration would be 10 days [4000/(4x100)].
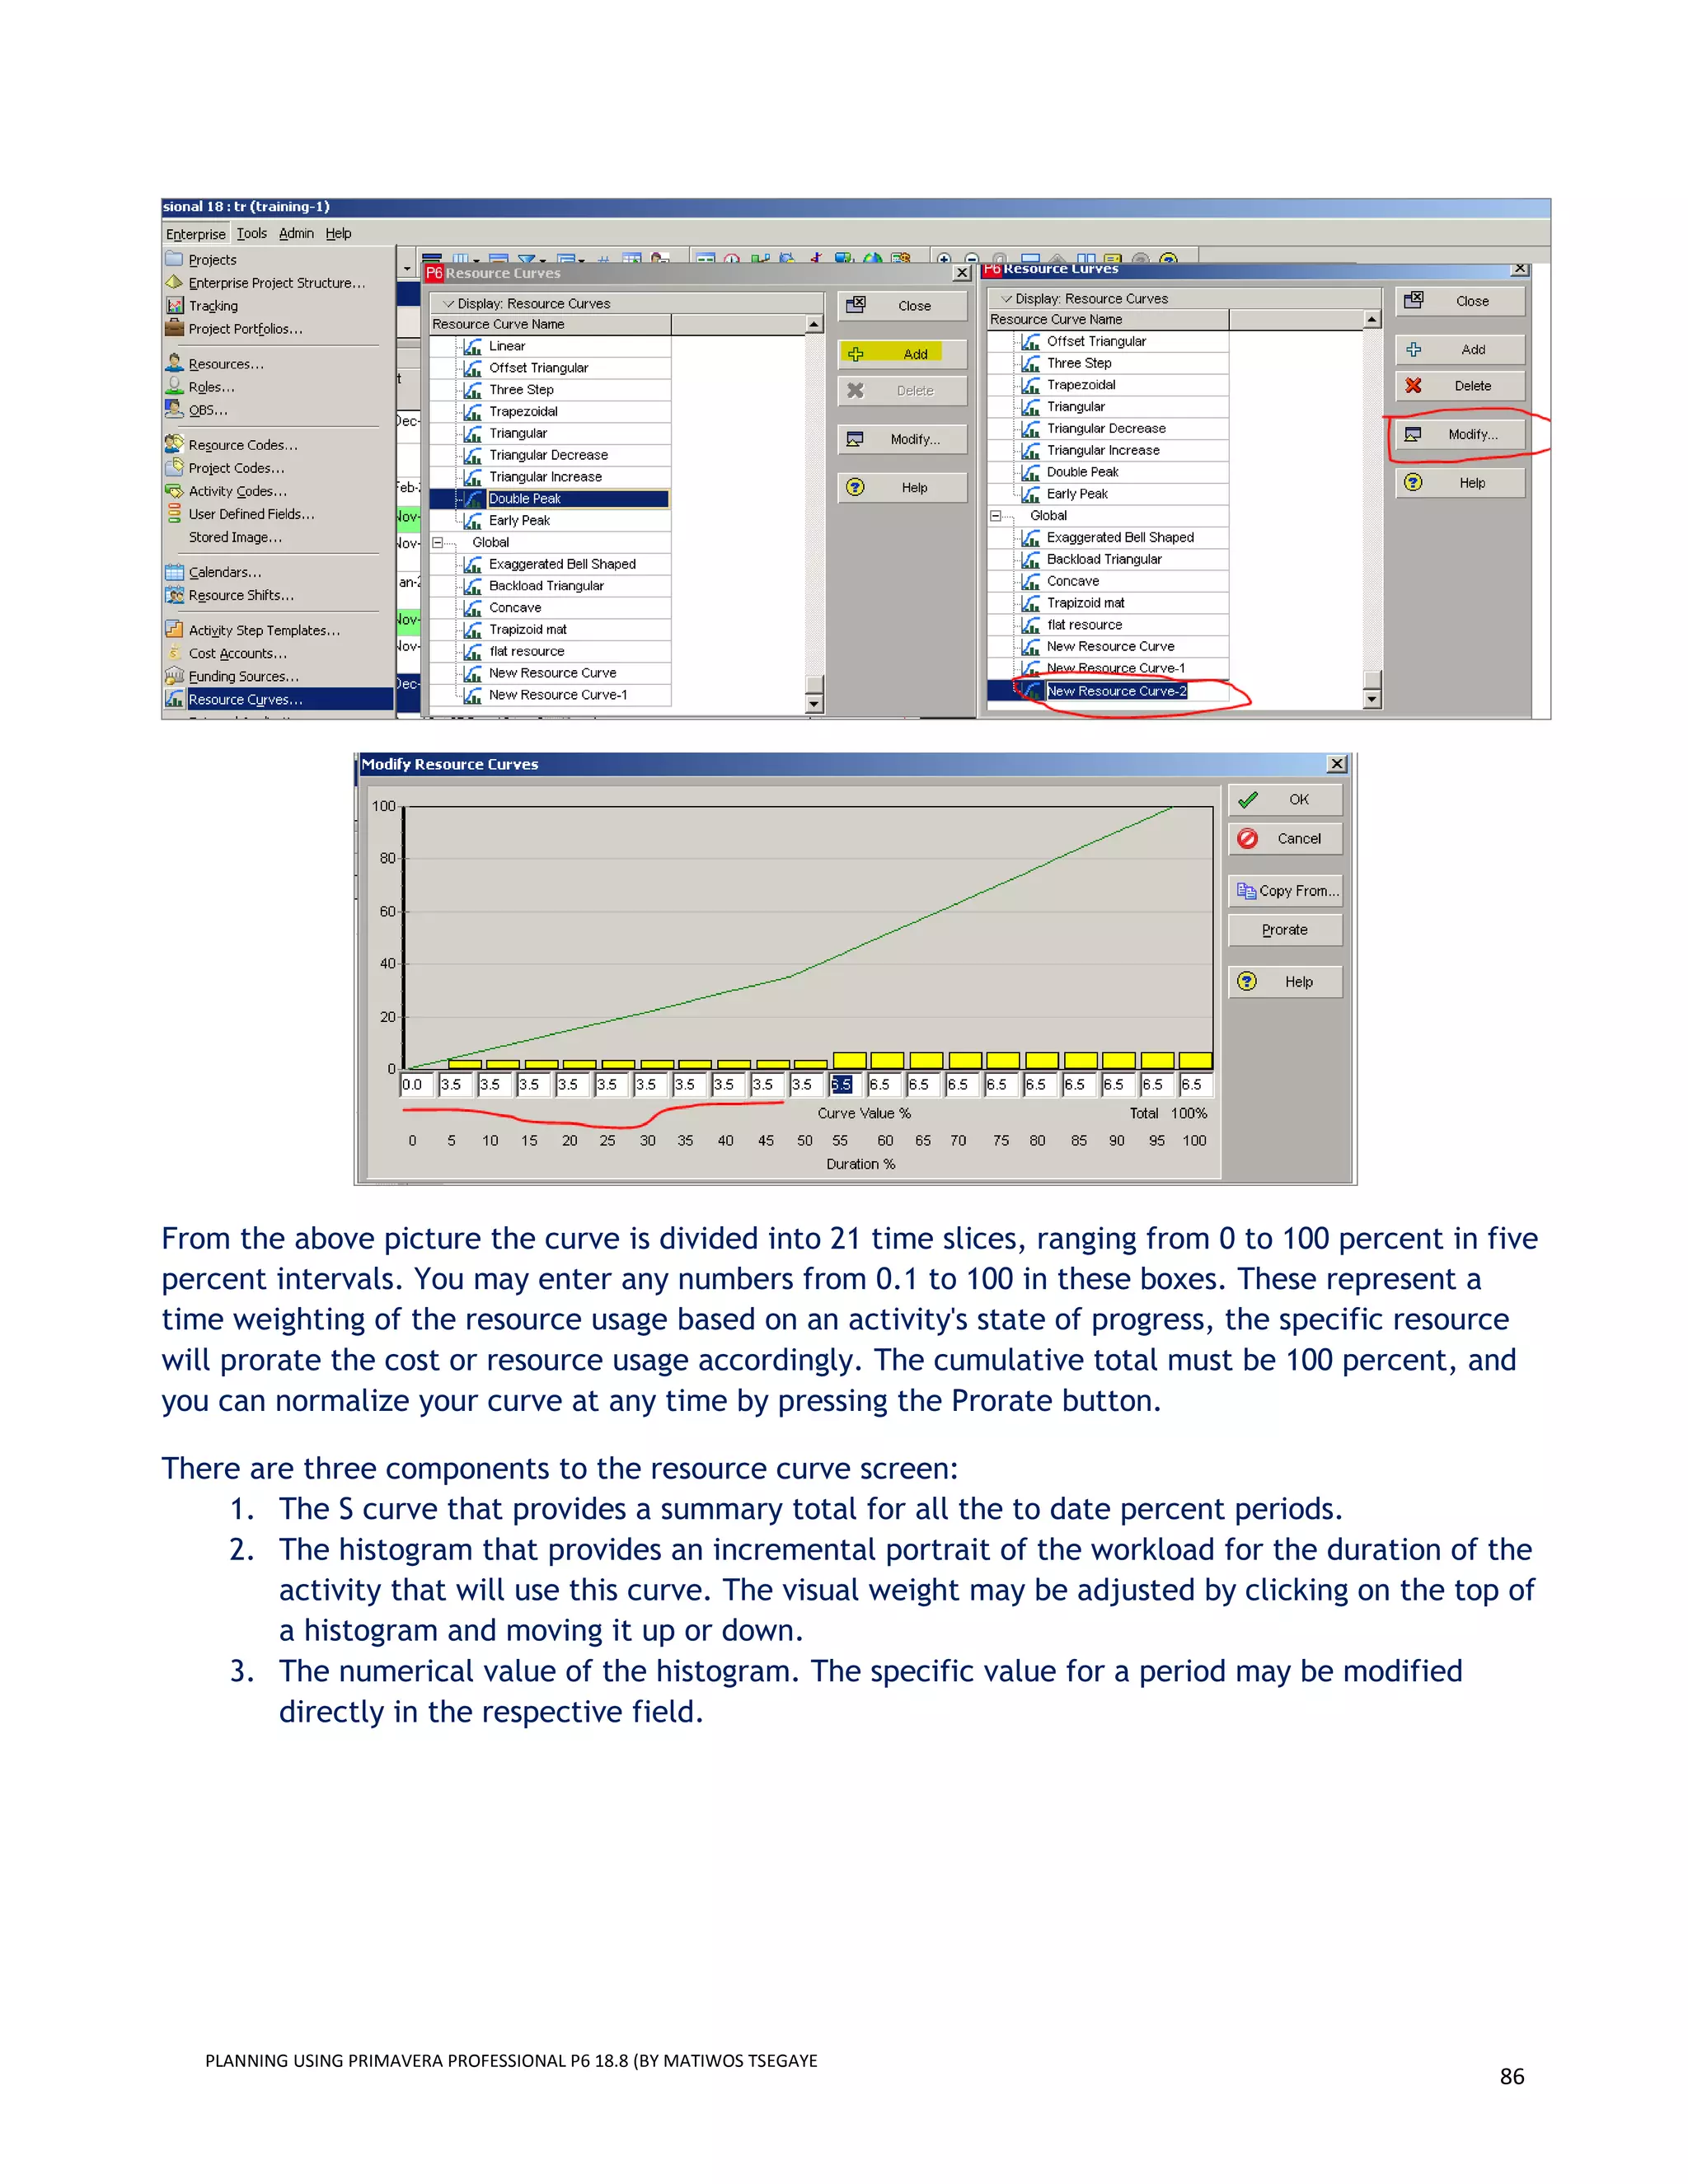
Resource curves: When resources perform work on an activity, you can choose how the resource
units or costs are spread through time. This is done using a resource curve. To see this column,
• right-click on the Resources tab on an activity → customize the columns → and choose Curve.
To view and modify resource curves,
• choose the menu Enterprise →Resource Curves → add → modify on selected curve. A list of
resource curves appears.](https://image.slidesharecdn.com/primaverap618-191115072550/75/Primavera-p6-18-8-planning-and-scheduling-guide-r3-90-2048.jpg)


![PLANNING USING PRIMAVERA PROFESSIONAL P6 18.8 (BY MATIWOS TSEGAYE
100
References
[1] W.J. DelPico, Project control: integrating cost and schedule in construction, John Wiley & Sons, Inc,
Hoboken, New Jersey, 2013.
[2] T.E.Uher, Programming and scheduling techniques, UNSW Press, Sydney, N.S.W, 2003.
[3] Project Management Body of Knowledge. 2013. 5th edition. Newtown Square, PA, Project Management
Institute.
[4] Amos, Scott J., Editor. Skills and Knowledge of Cost Engineering, 5th ed. Morgantown, WV: AACE
International, 2004.
[5] Tsegaye M. Efficient procedure for construction Scheduling during planning phase. Journal of Construction
Management and Economic, 2018.](https://image.slidesharecdn.com/primaverap618-191115072550/75/Primavera-p6-18-8-planning-and-scheduling-guide-r3-105-2048.jpg)


The document outlines guidelines for construction project planning using Primavera P6 software, emphasizing the importance of effective scheduling and resource allocation to improve project outcomes. It covers key topics such as baseline schedule development, project management processes, and the functionalities of Primavera P6 version 18.8. The manual serves as a comprehensive resource for construction professionals to optimize planning and management practices in the industry.


