nmr
•
24 likes•8,304 views

The document describes various NMR techniques including: 1) 2D NMR experiments like COSY and NOESY that provide information on through-bond and through-space couplings between nuclei to determine chemical structure and conformation. 2) The nuclear Overhauser effect (NOE) which allows measurement of internuclear distances below 5 Angstroms and is proportional to r^-6. 3) Pulse sequences like TOCSY that transfer magnetization between all spins within a coupled network to resolve overlapping signals in NMR spectra.

Recommended
More Related Content
What's hot
What's hot (20)
Similar to nmr
Similar to nmr (20)
More from Danish Kurien
More from Danish Kurien (13)
Recently uploaded
Recently uploaded (20)
nmr
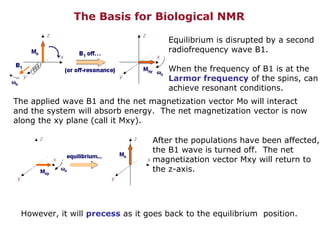
- 1. The Basis for Biological NMR Equilibrium is disrupted by a second radiofrequency wave B1. When the frequency of B1 is at the Larmor frequency of the spins, can achieve resonant conditions. The applied wave B1 and the net magnetization vector Mo will interact and the system will absorb energy. The net magnetization vector is now along the xy plane (call it Mxy). After the populations have been affected, the B1 wave is turned off. The net magnetization vector Mxy will return to the z-axis. However, it will precess as it goes back to the equilibrium position.
- 2. Spin-Spin Coupling (J Coupling)
- 4. Spin-Lattice Coupling (Nuclear Overhauser Effect) Two nuclear spins within about 5 Å will interact with each other through space. This interaction is called cross-relaxation, and it gives rise to the nuclear Overhauser effect (NOE). Two spins have 4 energy levels, and the transitions along the edges correspond to transitions of one or the other spin alone. W 2 and W 0 are the cross-relaxation pathways, which depend on the tumbling of the molecule. Nuclear spins can also cross-relax through dipole-dipole interactions and other mechanisms. This cross relaxation causes changes in one spin through perturbations of the other spin. Intensity of the NOE is proportional to r -6 ( r is distance between 2 spins).
- 5. Spin-Lattice Coupling (Nuclear Overhauser Effect) When two nuclear spins are within 5 Å, they will cross-relax. If one spin (S) is saturated (red lines along the edge), the system is not in equilibrium anymore. Magnetization will either flow from the top to the bottom (W2 active) or from the right to left (W0 active). The difference in energy between bb and aa is twice the spectrometer frequency, and molecular motions about that frequency are required for the transition. The difference between ab and ba is very small, and very slow molecular motions (e.g. proteins) will excite that transition.
- 6. The Pulse FT NMR Experiment equilibration 90º pulse detection of signals Experiment (t) Data Analysis Fourier Transform Time domain (t)
- 7. Typical 1 H Spectrum of a Protein Each 1H “resonates” at a well defined chemical shift. This 76 residue protein has a well-defined structure. Regions where Protons from Amino Acid Side Chains Resonate ppm downfield, less shielding upfield, more shielding
- 8. 2D Nuclear Magnetic Resonance - 15 N - C - CO - 15 N - C H H 15 N- 1 H HSQC In order to resolve spectral overlaps, a second dimension can be added to the basic 1D NMR experiment. Shown below is a spectrum which correlates 1 H bound directly to the amide 15 N in the protein backbone (and some side chains). R R
- 9. 2D Nuclear Magnetic Resonance The Spin-Echo Sequence In the spin-echo pulse sequence, a 90 o pulse is first applied to the spin system. The 90 o degree pulse rotates the magnetization down into the X'Y' plane. The transverse magnetization begins to dephase. At some point in time after the 90 o pulse, a 180 o pulse is applied. This pulse rotates the magnetization by 180 o about the X' axis. The 180 o pulse causes the magnetization to at least partially rephase and to produce a signal called an echo.
- 10. 2D Nuclear Magnetic Resonance When a molecule with J coupling (spin-spin coupling) is subjected to a spin-echo sequence, something unique but predictable occurs. Molecule A2-C-C-B where A and B are spin-1/2 nuclei experiencing resonance. The NMR spectrum from a 90-FID sequence looks like this: With a spin-echo sequence this same molecule gives a rather peculiar spectrum.
- 11. 2D Nuclear Magnetic Resonance To understand what is happening, consider the magnetization vectors from the A nuclei. There are two absorptions lines in the spectrum from the A nuclei, one at +J/2 and one at -J/2. At equilibrium, the magnetization vectors from the +J/2 and -J/2 lines in the spectrum are both along +Z.
- 12. 2D Nuclear Magnetic Resonance A 90 degree pulse rotates both magnetization vectors to the XY plane. 90 degree pulse Assuming a rotating frame of reference at o = , the vectors precess according to their Larmor frequency and dephase due to T2. Precession and dephasing When the 180 degree pulse is applied, it rotates the magnetization vectors by 180 degrees about the X' axis.
- 13. 2D Nuclear Magnetic Resonance Precession and dephasing When the 180 degree pulse is applied, it rotates the magnetization vectors by 180 degrees about the X' axis. In addition the +J/2 and -J/2 magnetization vectors change places because the 180 degree pulse also flips the spin state of the B nucleus which is causing the splitting of the A spectral lines.
- 14. 2D Nuclear Magnetic Resonance The two groups of vectors will refocus as they evolve at their own Larmor frequency. In this example the precession in the XY plane has been stopped when the vectors have refocussed. You will notice that the two groups of vectors do not refocus on the -Y axis. The phase of the two vectors on refocussing varies as a function of TE. This phase varies as a function of TE at a rate equal to the size of the spin-spin coupling frequency. Therefore, measuring this rate of change of phase will give us the size of the spin-spin coupling constant. This is the basis of one type of two-dimensional (2-D) NMR spectroscopy. Spins states flip Refocussing
- 15. 2D Exchange NMR t 1 t 2 FT in t 1 will give 2D frequency spectrum FT of t 2
- 16. The 2D NMR Pulse Sequence + 1D + 1D = 2D [2nd preparation]
- 17. Anatomy of a 2D NMR Experiment In this example, the second 90 degree pulse acts only on the Y component of magnetization in the X’Y’ plane. Look at the off resonance singlets ( o) for different values of t1.
- 18. Anatomy of a 2D NMR Experiment The spectra are plotted on a stacked plot. Have the frequency data along one axis (this is just like the 1D case) and a time domain on the second axis. Since the variations of the amplitudes along the time axis is also periodic, can build a pseudo-FID if we look at the point at each frequency along f2. If we plot the FID from the frequency data (like in 1D NMR) with the variations in the signal over time, we get a 2D plot. Get cross peaks in the 2D maps where the two lines intercept. For simplicity, look at the plot from above and draw it as a contour plot.
- 19. 2D Nuclear Magnetic Resonance The basic 2D experiment involves repeating a multiple-pulse 1D sequence. The 1D pulse-sequences are systematically varied over a delay time t D and the resultant spectra is plotted as stacks. There are now two time domains , one that originates during the acquisition as usual and the second that comes from the delay time t D .
- 21. 2D NMR: Coupling is the Key 2D detect signals twice (before/after coupling) Same as 1D experiment 90º pulse t 1 t 2 t 1 t 2 Transfers between coupled spins Chemical exchange can also happen during this time, and it is possible to confuse an NOE peak with a chemical exchange peak, but techniques have been developed to figure out which is which. Like all 2D sequences, t1 is the variable time to collect frequency information in the indirect dimension. The delay t is fixed and is the time during which the NOE builds up.
- 22. 2D Nuclear Magnetic Resonance The J-resolved Experiment In a 2-D J-resolved NMR experiment, time domain data is recorded as a function of TE and time. These two time dimensions will referred to as t1 and t2. For the A2-C-C-B molecule, the complete time domain signals look like this. This data is Fourier transformed first in the t2 direction to give an f2 dimension and then in the t1 direction to give an f1 dimension.
- 23. 2D Nuclear Magnetic Resonance The J-resolved Experiment Displaying the data as shaded contours, we have the following two-dimensional data set. The f1 dimension gives us J coupling information while the f2 dimension gives chemical shift information. This type of experiment is called homonuclear J-Resolved 2-D NMR.
- 24. The 2D NMR Spectrum Pulse Sequence Spectrum Coupled spins Before mixing After mixing t 1 t 2
- 25. The Power of 2D NMR: Resolving Overlapping Signals 1D 2D 2 signals overlapped 2 cross peaks resolved
- 26. COrrelation SpectroscopY (COSY) Two 90 degree pulses are applied in sequence. The time t1 is the time between the first and second pulse. The signal will vary with the time between the pulses (t1). In a 2D COSY spectrum, cross-peaks will exist where there is spin-spin coupling between nuclei.
- 27. Case Study: 2D NMR Spectrum of Ethanol The 2-D hydrogen correlated chemical shift spectrum of ethanol There are cross peaks between the OH and CH 2 hydrogens and the CH 2 And CH 3 hydrogens due to J coupling. There are no cross peaks between The CH 3 and OH hydrogens.
- 28. Some More Examples of 2D Spectra CH 3 CH 2 CH 2 OH (CH 3 ) 2 CHOH C 6 H 5 CH 2 CH 3 Scalar Coupling Dipolar Coupling Homo nuclear COSY Hetero nuclear TOCSY NOESY HSQC Hetero-TOCSY HMQC NOESY-HSQC NOESY-HMQC
- 29. Through Space Correlation (NOESY) Looking at J-coupled systems through COSY will tell us about the chemical structure of the system but does not tell much about stereochemistry or Conformation. Recall that if a nuclei in the system was hit with a pulse so as to cause saturation, it will relax by either zero- or double-quantum processes and would enhance the signals from nuclei that were close by. This was the NOE . Relaxation could take place either through W2IS or W0IS, depending on the size of the system ( the rate of tumbling ). The spins will stay aligned with the external magnetic field Bo while the molecule tumbles in solution. This generates magnetic fields (fluctuating dipoles) at the rate of tumbling. The fluctuating dipoles allow the spins to release energy.
- 30. Through Space Correlation (NOESY) Need a way to analyze how the molecule move in solution. Define the correlation function as the average of how the molecules are oriented at some time t and a little while after that (t + ) This function basically correlates the orientation of the molecule at two different times. This gives information about the rate of tumbling . The correlation function is in the time domain. This function can be Fourier transformed into the frequency domain to give the spectral density function . Here c is defined as the tumbling rate.
- 31. Through Space Correlation (NOESY) Depending on how fast the molecule is tumbling (as defined by c) the movement of the system will be composed of frequencies faster, slower or equal to the Larmor frequency. Since the probability of a transition depends on the different frequencies that the system has (i.e. the spectral density ), the W terms are proportional to the spectral density function . Since we need to have two magnetic dipoles to get dipolar coupling, the NOE depends on the strength of the two dipoles involved. The strength of a dipole is proportional to r -3 , thus the NOE varies as r -6 . The NOE decays very fast as the two nuclei are pulled away from each other. For protons, this is about 5-6 Å separation.
- 32. Steady State NOE In order to estimate the distance between protons in a molecule, can saturate one nuclei and look at the relative enhancement of other nuclei. Take two spectra, the first without any irradiation and the second with. Subtracting the two spectra will give the enhancements. This is used to estimate distances. In the case of a molecule with three protons, two at fixed distances (CH 2 ). Since the two protons (Ha and Hb) on CH 2 are fixed, they are references. The NOE effect from these two protons can be used a reference to calculate the distance between the other protons (Ha and Hc, Hb and Hc)
- 33. Transient NOE With steady state NOE, have to continuously irradiate the system to achieve saturation. This is fine for small molecules but with larger molecules, get spin diffusion: The energy that is transferred from nuclei I to nuclei S is then transferred to other nuclei. This will give signal enhancement even for nuclei far away from the center of irradiation. For larger molecules, the amount of time that the spins are saturated must be limited (otherwise get spin diffusion). Also, working on one proton at a time for larger molecules would be time consuming. Have to do a 2D experiment where all proton are studied.
- 34. NOE Spectroscopy The first two pulses are an inversion for all protons. We label everything with chemical shifts and couplings. The magnetization component that ends up in the -Z axis evolves during the mixing time tm and dipolar coupled spins will undergo NOE. The 2D spectrum will have chemical shifts in f1 and f2. The cross peaks are for nuclei that are dipolar coupled .
- 35. NOE Spectroscopy The cross peaks are for nuclei that are dipolar coupled . The size of the cross peaks will depend on the distance between the (through-space) coupled nuclei. These distances are measured relative to a standard for which the distance is already known. COSY : gives information on through-bond coupling (chemical structure). NOESY : gives information on through-space coupling (stereochemistry and configuration).
- 36. Interpretation of 2D NMR Spectra • Crosspeaks are a measure of some type of interaction between 2 spins (NOE, J-coupling....) • The intensity of the crosspeak often quantifies the interaction. • A heteronuclear experiment (1H-15N) would not have diagonal crosspeaks. 1H ppm 1H ppm
- 37. Assignment of Resonance A homonuclear TOCSY experiment: (Total Correlation Spectroscopy) Crosspeaks occur between 1H that are within a network of J-coupled spins (in practice within a residue) NH--CH --CH CH3 CH3
- 38. NOESY for Sequential Assignments • 1 H J-couplings are Too Small to Detect Interactions across Peptide Bond • One advantage of heteronuclear experiments is the large coupling constants -- can use hetero TOCSY and COSY like experiments to get across the peptide bond (see cbcannh and cbca(co)nnh experiments later.
- 39. Steps in Structure Determination Using NMR
- 40. TOCSY (Total Correlation Spectroscopy) is capable of correlating all spins in a coupled network. The “working end” of the TOCSY pulse sequence is an isotropic mixing sequence that is a sequence of pulses that are designed to remove all chemical shift differences and create a strong coupling environment. This is called the Hartmann-Hahn condition. Sometimes the TOCSY experiment is called HOHAHA (Homonuclear Hartmann-Hahn). The strong coupling product operator is similar to the regular (weak) coupling operator but it includes I x S x and I y S y terms. The net result of the TOCSY mixing sequence is the transfer of magnetization from I to S along the same axis (e.g. I z to S z or I x to S x or I y to S y ). The transfer depends on the coupling constant but is fairly complicated because S can transfer to another spin, R, and so on. Total Correlation Spectroscopy (TOCSY)
- 41. Total Correlation Spectroscopy (TOCSY) Like the 1D COSY, the 2D TOCSY experiment relies on scalar or J couplings. The idea behind the TOCSY experiment is the connection of all spins that can be linked up by J -couplings. Remember that J coupling between nuclei that are more than 3 bond lengths away is very weak. If we look at the amino acids in a protein, we notice that within an amino acid there usually always three covalent bonds between two protons giving rise to a 3 J proton proton coupling and thus sufficient to be used in a TOCSY experiment.
- 42. Spin Systems Any set of protons in a chain of unbroken J-coupling interactions will give rise to sets of TOCSY cross peaks. For example, each of the 3 sets of peaks shown above will be correlated in a 2D TOCSY spectrum. CH 3 CH 3 CH 3 H H H H H H H H H H H
- 44. Total Correlation Spectroscopy (TOCSY) Along the backbone we have a similar situation. As there are only two protons in the backbone portion we would have to cover at least four bonds to move from residue to residue along the backbone. The number of protons that can be linked up in a 2D TOCSY spectrum is therefore limited to all those protons within an amino acid. For some amino acids, e.g. phenylalanine, there is a further lack of connection within the amino acid. Such amino acids contain two or more spin systems. TOCSY : Between the Hb protons and the Hd protons of phenylalanine are four covalent bonds. J -coupling over 4 covalent bonds is extremely weak and practically non-existent.
- 45. Total Correlation Spectroscopy (TOCSY) The TOCSY spectra of Asp and Phe are shown below. These patterns are characteristic for each amino acid. As they are neither affected by the linkage of amino acids along the backbone nor by the structure of the protein they will always allow the identification of the type of amino acid.