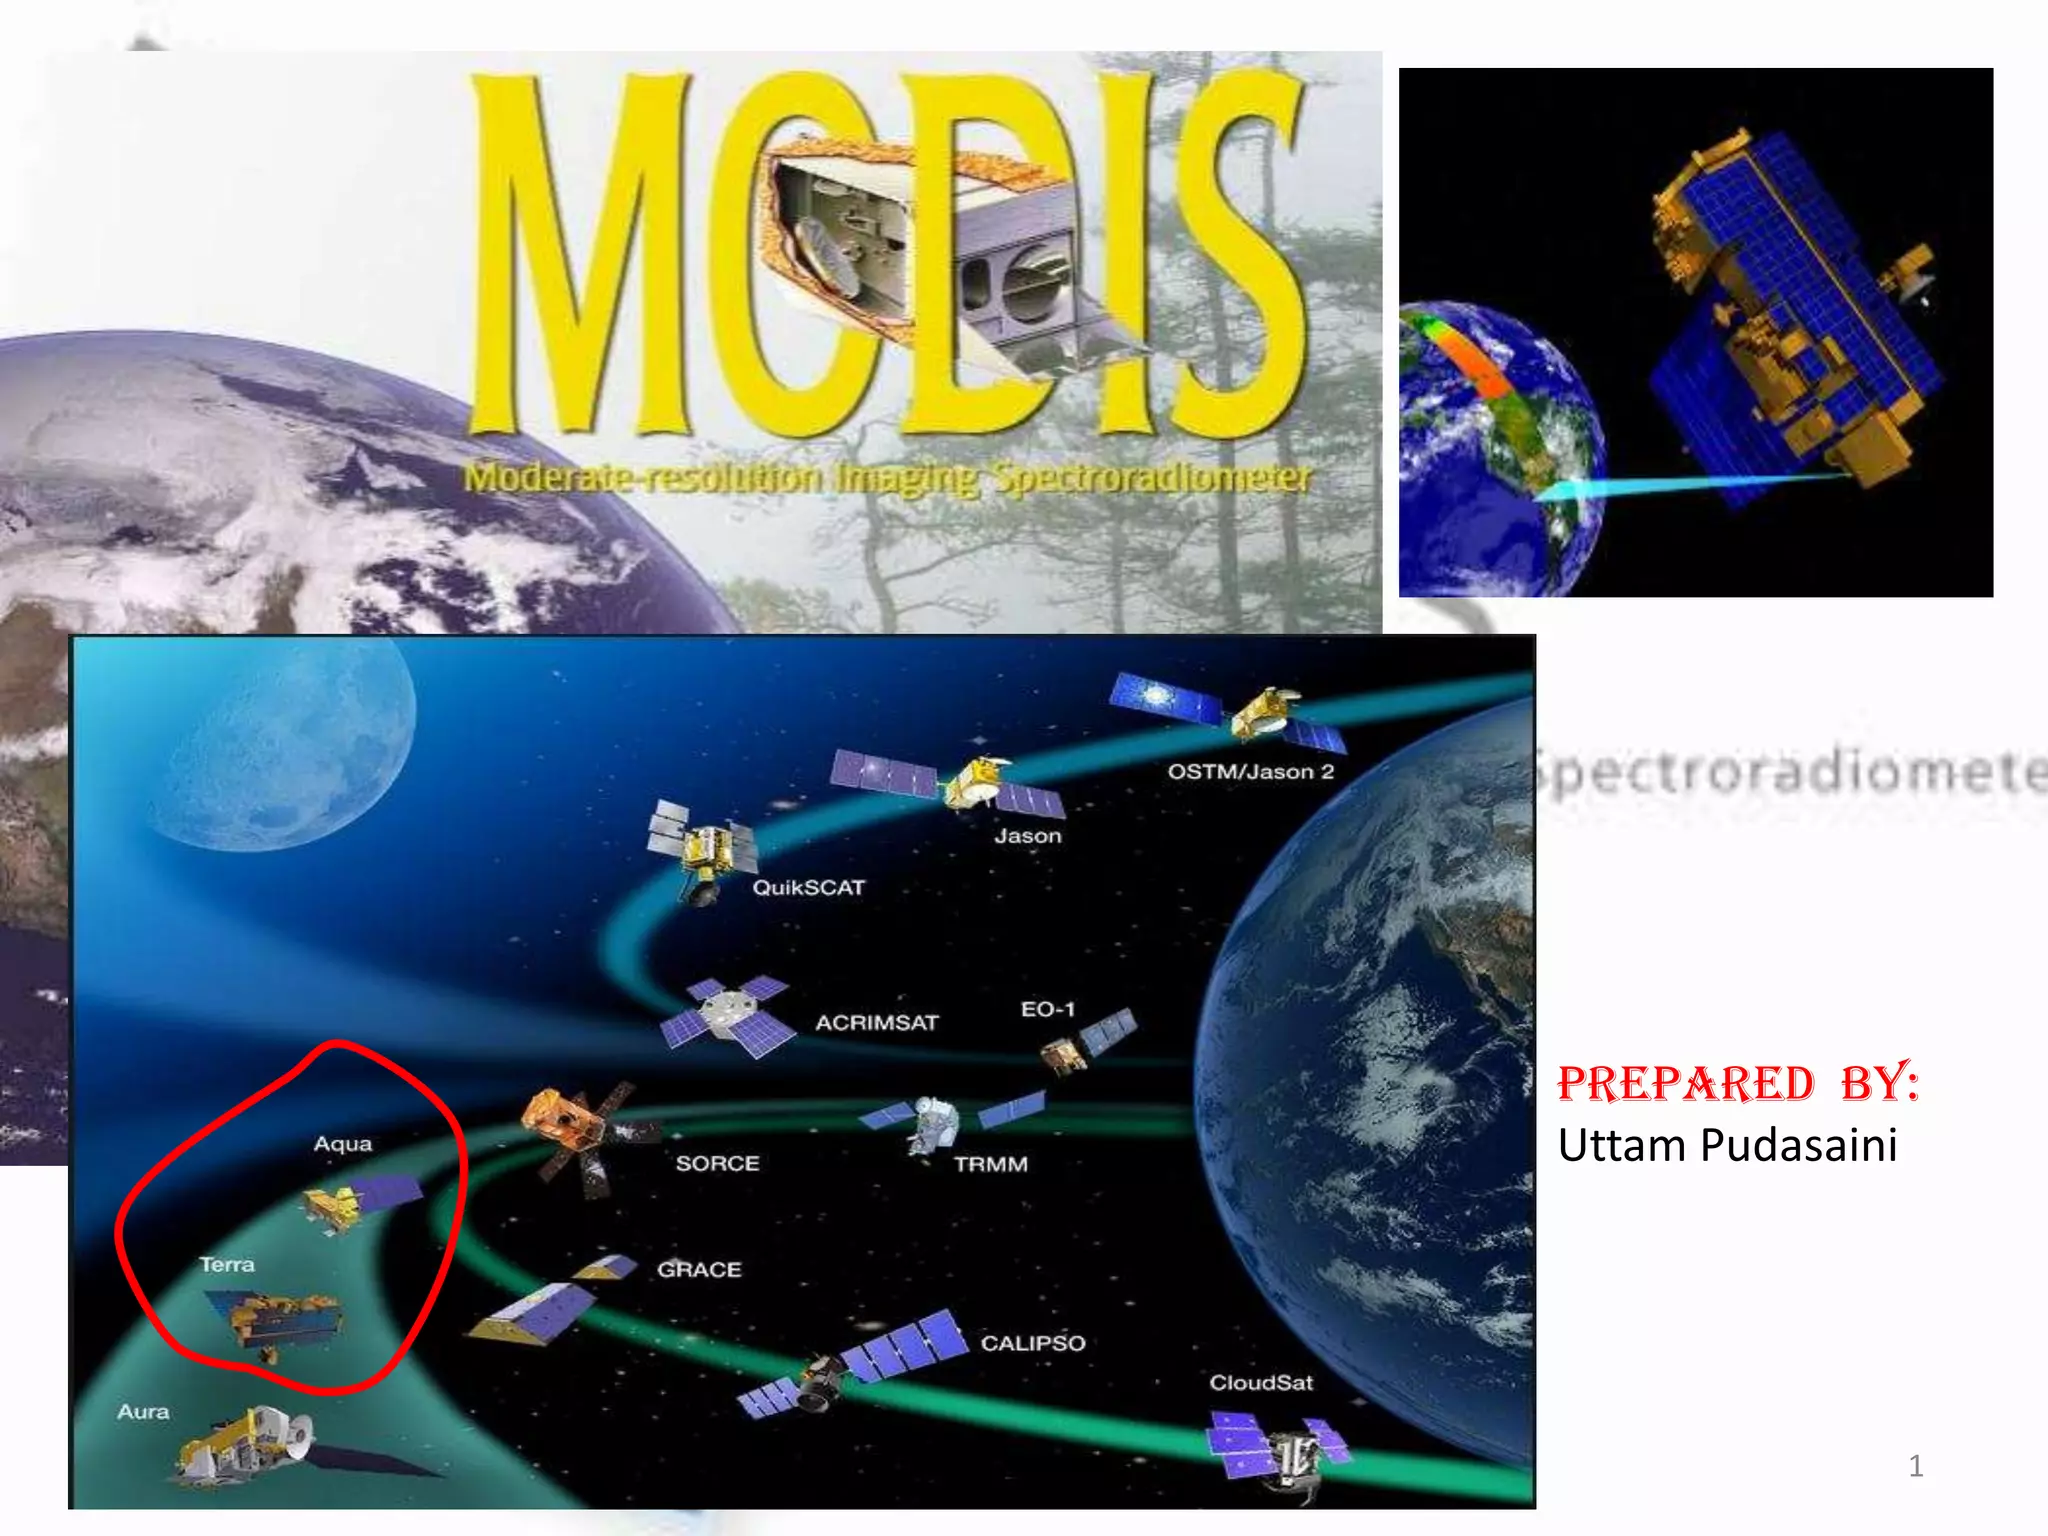
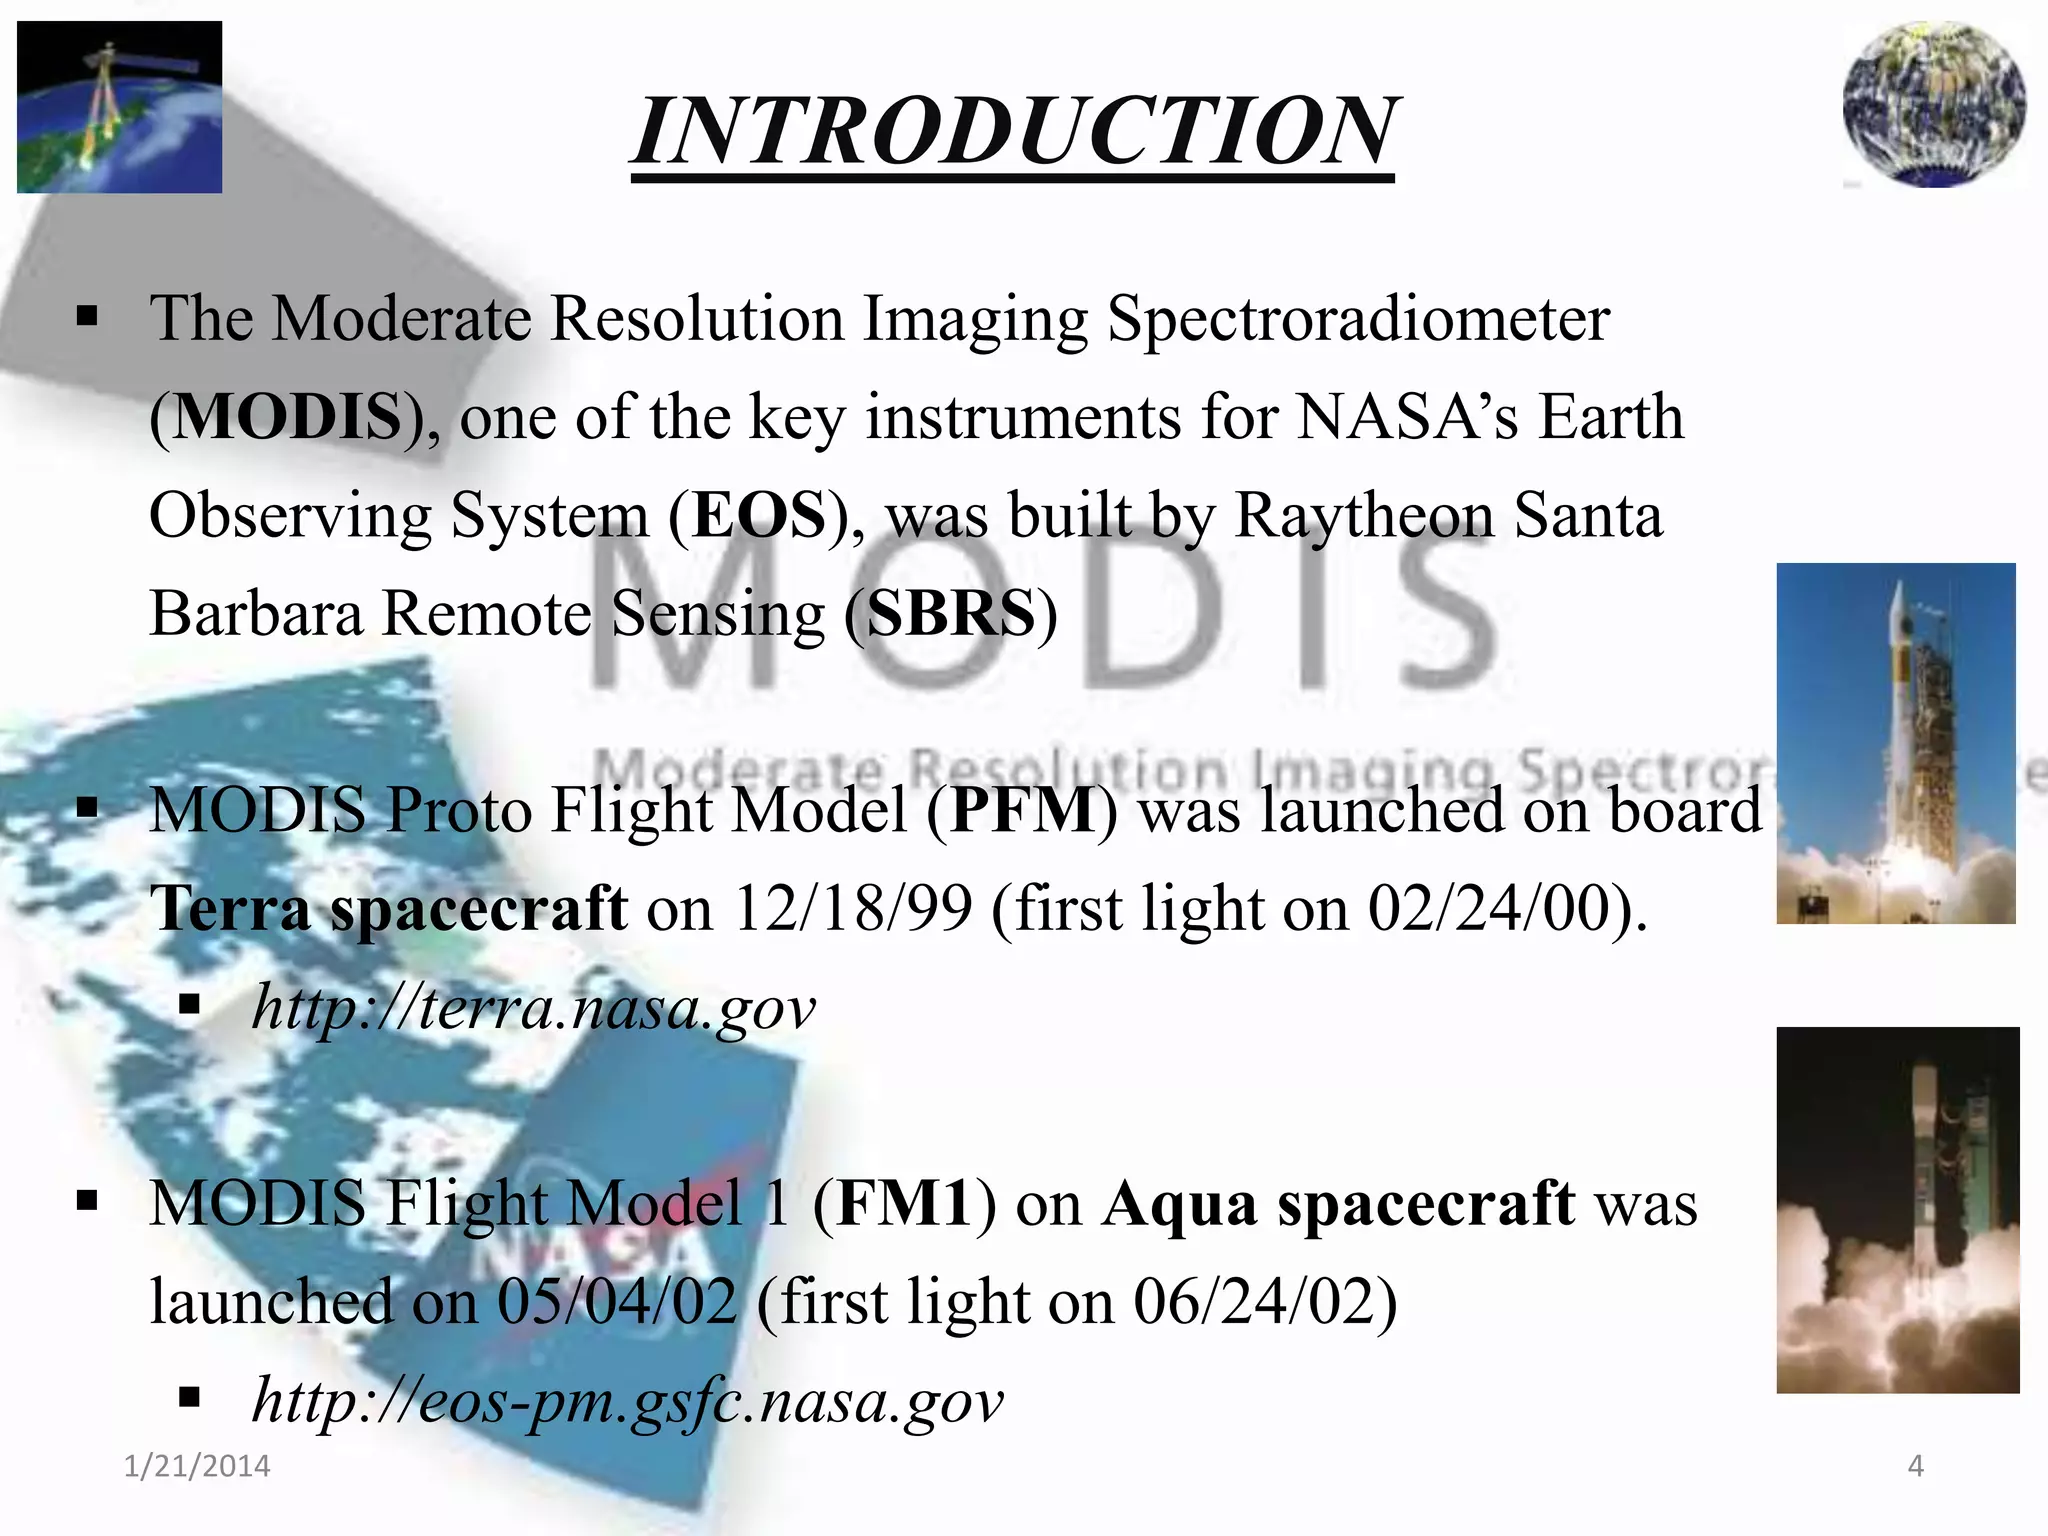
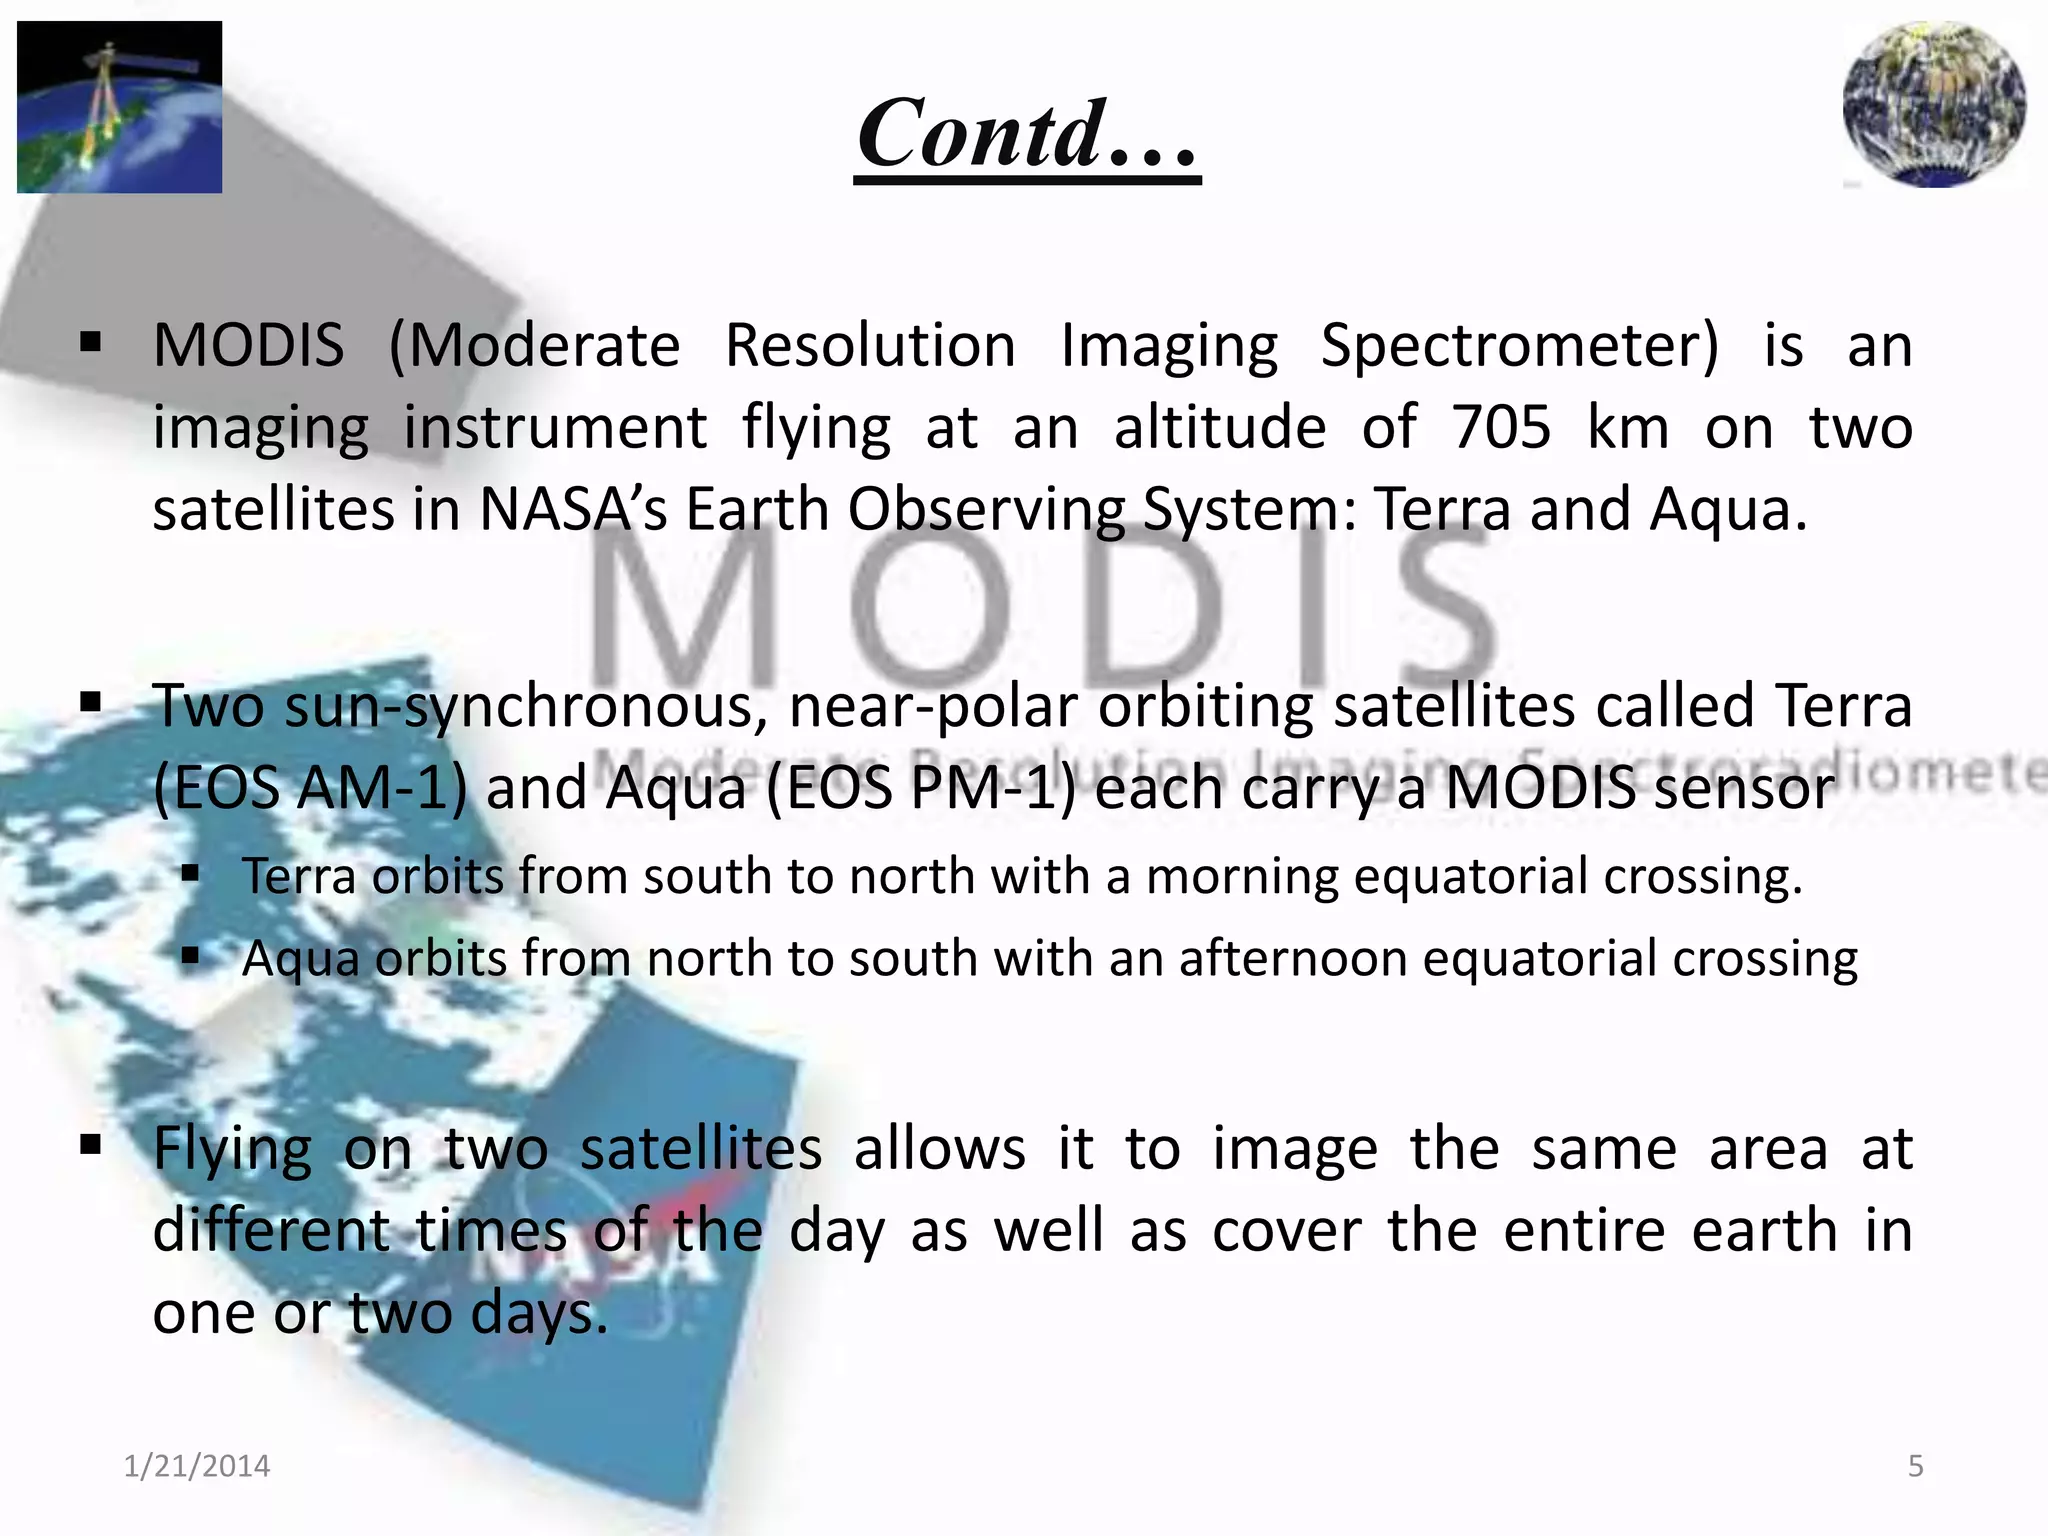
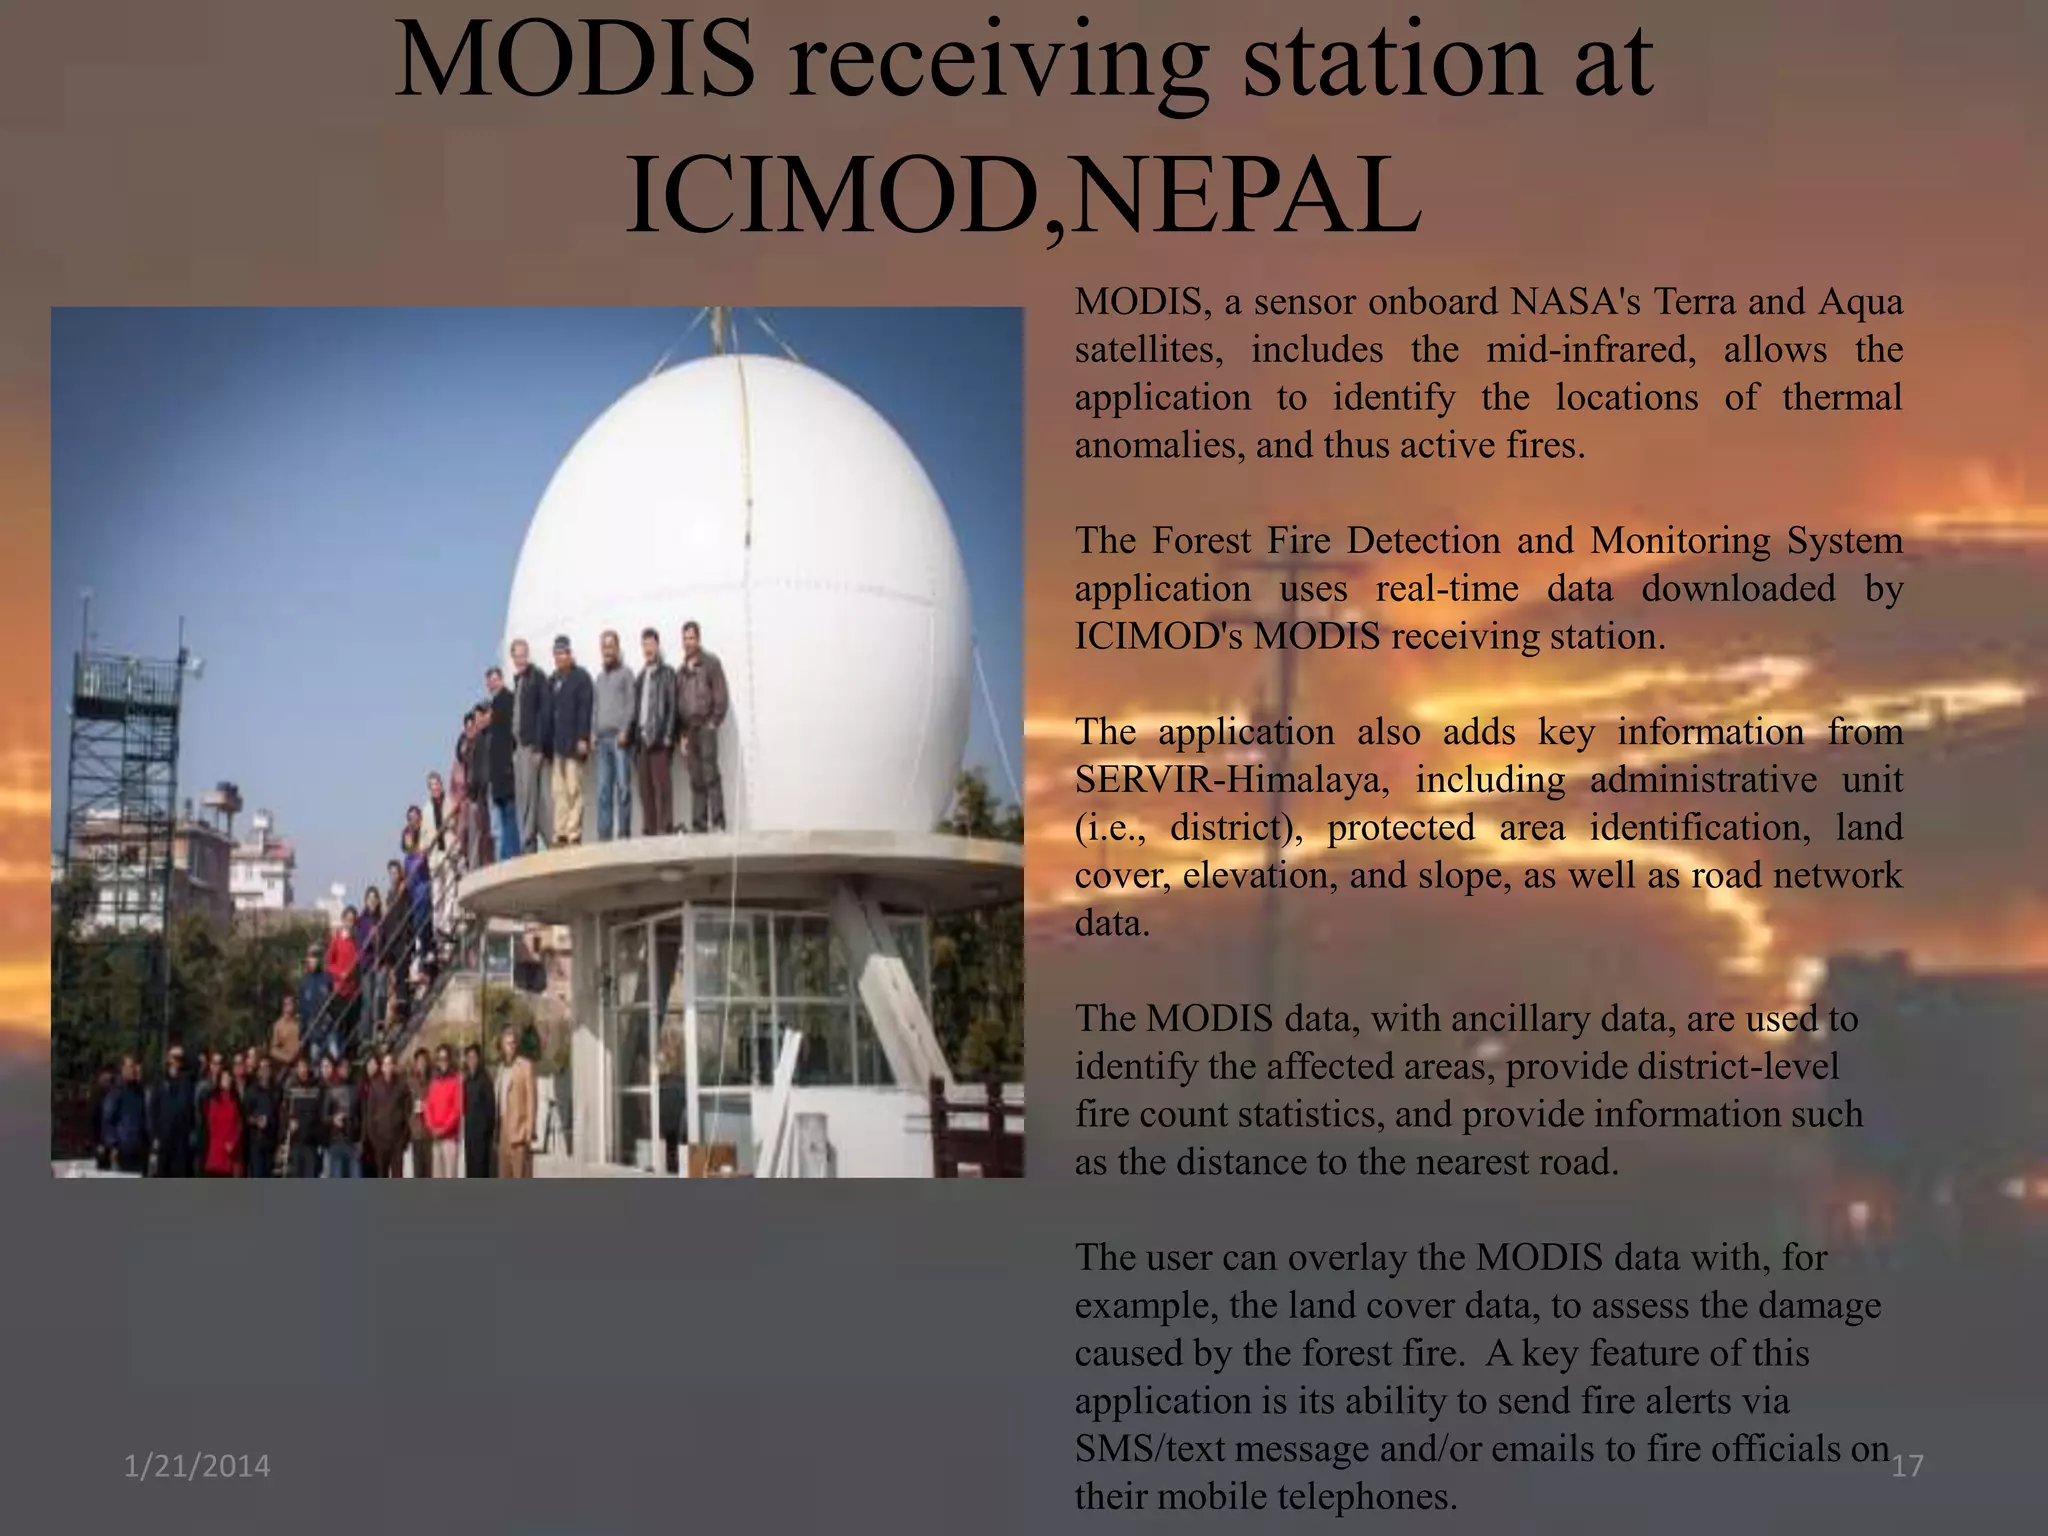
The purpose of choosing this topic is to aware you about sentinel satellites that leads to new discoveries and ultimately changes the arena of Remote Sensing.
Types of Platforms
1. Airbrone Platforms
2. Spacebrone Platforms
Platforms are Vital Role in remote sensing data acquisition
Necessary to correct the position the remote sensors that collect data from the objects of interest
Basic Concepts, Explanation, and Application. Fundamental Remote Sensing; Advantage/ disadvantages, Imaging/non Imaging sensors, RAR and SAR, SAR Geometry, Resolutions in the microwave, Geometric Distortions in SAR, Polarization in SAR, Target Interaction, SAR Interferometry
Evaluating satellite remote sensing as a method for measuring yield variabili...Amanda Woods
Evaluating satellite remote sensing as a method for measuring yield variability in Avocado and macadamia tree crops by Andrew Robson et. al. PARG UNE, NSW. Presented at SPAA Symposium Sep 2016.
El tratamiento digital de las imágenes agiliza el proceso de interpretación, permite generar modelos cuantitativos e integrar los resultados con otro tipo de información geográfica. Contribuye además a resolver problemas vinculados con la entrada y actualización de datos en la implementación de SIG (también conocido con los acrónimos SIG en español o GIS en inglés), por la capacidad de obtener documentos temáticos, a bajo costo y en un período de tiempo bastante cercano a la obtención de la imagen utilizada, ofreciendo mayor accesibilidad temporal frente a otras técnicas convencionales.
A GEO satellite’s distance from earth gives it a large coverage area, almost a fourth of the earth’s surface and also have 24 hour view of a particular area.This will be very helpful to army,navy etc.,These factors make it ideal for satellite broadcast and other multipoint applications.Continuous monitoring is done and also cost effective in long term, risk-less.
Use of Drones in Humanitarian Action and Disaster ManagementNepal Flying Labs
Presentation on the works carried out by WeRobotics and its Flying lab network during seminar series “Intrepid Solutions”, set up by Build Change and the Nepali Engineers’ Association (NEA) at its headquarter office in Pulchowk. Intrepid solution is an initiative to stimulate discussions between local practicing engineers, local researchers and international experts.
I was invited as a representative from Nepal Fyling Labs to give a short, five minute lightning talk on the technology we were using at the Digital Technologies for Resilience Workshop. The presentation focused on sharing the story of the lab about getting to the scale it wanted to reach mentioning some key areas where it wants to focus.
The Digital Technologies for Resilience, organized by FHI 360 with funding and support from the Rockefeller Foundation and the United States Agency for International Development (USAID), will be held in Bangkok, Thailand on November 14-15, 2017.
WeRobotics and Flying Labs: Uses of Drones in Humanitarian and Social Good p...Nepal Flying Labs
I was invited as a Keynote Speaker by the Crisis Mappers Japan, Furuhashi Laboratory at the Aoyama Gakuin University (AGU) to share about all the Humanitarian Response and Crisis Mapping related projects that WeRobotics has been doing at different parts of the world via local innovation hubs in different countries also known as Flying Labs.
The event also showcases some of the Drone use related initiatives that has recently begun by partnerships between DroneBird and local municipal offices.
State of the Map Asia is an annual gathering of people who contribute to OpenStreetMap (OSM) movement in Asia in different ways. During the conference, representatives from different countries of Asia presented the state of OpenStreetMap in their countries, as well as participate in discussions, mapping activities, workshops and events related to the free and open map of the world.
During the Nepal session, there were four presentations where the presenter talked about different kind of projects that are being done around OSM and Open data with the use of different tools and frontier technologies . I represented Nepal Flying Labs ,WeRobotics and gave 10 minute lightning talk on the topic : Drones and Open Street Maps. I briefly talked about the regulatory environment in the country for use of Drones and its current status. I also highlighted on the possibility of using high resolution satellite images as a Base Map in the Open street maps thus allowing any users to easily identify ground details and help them manually trace the objects more accurately.
I would like to thank Kathmandu Living Labs, the main organizer of this event for providing us this opportunity.
Generation of high resolution DSM using UAV Images Nepal Flying Labs
A final year project by Geomatics Engineering Students at Kathmandu University,Dhulikhel,Kavre.
All the datasets required for this project have been downloaded from the popular Trimble Company.This project makes use of 27 high resolution (2.4 cm average spatial resolution) UAV-acquired images of a sand mine at Tielt-Winge, Belgium . These images have been acquired by a Sony Nex-5R digital camera mounted on a Trimble UX5 Imaging Rover, a fixed wing UAV. Three software: LPS, AgiSoft PhotoScan and PIX4D were used for image processing.
The team members:
1.Uttam Pudasaini : utmpudasaini@hotmail.com
2.Niroj Panta : sadrose777@gmail.com
3.Biplov Bhandari : bionicbiplov45@gmail.com
4.Upendra Oli : Upendraoli@gmail.com
Using arc map to create package map along with a report file [metadata]Nepal Flying Labs
Copying a arc map .mxd document into a new workspace or lets say new computer always creates problems like missing links, Location of all shape files scattered on different locations in the creator's computer.Thus zipping all those scattered files into a single folder which on double clicking directly takes you to the map document with no broken link of data is an attempt made by us through development of this tool.
Geoprocessing(Building Your Own Tool) and Geostatistical Analysis(An Introdu...Nepal Flying Labs
Its a presentation slide prepared by me and my team for a workshop at my college.Don't hesitate to mail me at utmpudasaini@hotmail.com or utmpudasaini@gmail.com if you want to know more or details regarding the demos.
Analysis of suggested Sites for Construction of a Shopping Mall at Banepa,KavreNepal Flying Labs
This Project analyses the locations which are assumed to be provided by a shopping mall which is trying to extend its network at Banepa. We are provided with three areas of Banepa whose topographical information is to be collected and among these areas we have selected a working site and based on certain parameters we have divided this site into a number of appropriate locations.
This presentation was given at Kathmandu University during 3rd year Engineering Project of Geomatics Engineering study.
Survey and Design of Gravity Fed Water supply system at a DadaGaun ,BanepaNepal Flying Labs
This is a presentation slide prepared for the final presentation during my 2nd year of study at Kathmandu Engineering ,Nepal.A village from Banepa where there is a scarcity of water has been chosen as the project study site and following surveying techniques have been implementation to develop a water distribution network for the community.
1.Leveling from water resource to the village
2.Traverse and Tacheometry around the village for topographical map generation
3.Design of water distribution routes
Though i am not an applied physics /B.S.C physics student ,Science has always been something of my interest :) Presentation during "International School on Astronomy and Space Science organized by Ministry of Environment, Science and Technology and B.P. Koirala Memorial Planetorium, Observatory and Science Museum Development Board "
TWO MOST COMMON GEOGRAPHIC INFORMATION SERVICE STANDARDS 19116:2004 AND ISO ...Nepal Flying Labs
I gave this presentation in front of my classmates and my course instructor as an assignment of one of my subject so called Spatial Data Infrastructure (SDI).It deals in detail about two major geographic information service standards:ISO 19116:2004 Geographic Information Positioning Services and ISO 19117:2005 Geographic Information Portrayal.
This presentation slide is a final presentation of the project "3D MODELLING OF KATHMANDU UNIVERSITY USING ARC GIS AND GOOGLE SKETCH UP".The project members are
1.Uttam Pudasaini : utmpudasaini@gmail.com
2.Niroj Panta : sadrose777@gmail.com
3.Biplov Bhandari : bionicbiplov45@gmail.com
4.Archana KC : kecyarchana@gmail.com
5.Upendra Oli : Upendraoli@gmail.com
UiPath Test Automation using UiPath Test Suite series, part 4DianaGray10
Welcome to UiPath Test Automation using UiPath Test Suite series part 4. In this session, we will cover Test Manager overview along with SAP heatmap.
The UiPath Test Manager overview with SAP heatmap webinar offers a concise yet comprehensive exploration of the role of a Test Manager within SAP environments, coupled with the utilization of heatmaps for effective testing strategies.
Participants will gain insights into the responsibilities, challenges, and best practices associated with test management in SAP projects. Additionally, the webinar delves into the significance of heatmaps as a visual aid for identifying testing priorities, areas of risk, and resource allocation within SAP landscapes. Through this session, attendees can expect to enhance their understanding of test management principles while learning practical approaches to optimize testing processes in SAP environments using heatmap visualization techniques
What will you get from this session?
1. Insights into SAP testing best practices
2. Heatmap utilization for testing
3. Optimization of testing processes
4. Demo
Topics covered:
Execution from the test manager
Orchestrator execution result
Defect reporting
SAP heatmap example with demo
Speaker:
Deepak Rai, Automation Practice Lead, Boundaryless Group and UiPath MVP
Dev Dives: Train smarter, not harder – active learning and UiPath LLMs for do...UiPathCommunity
💥 Speed, accuracy, and scaling – discover the superpowers of GenAI in action with UiPath Document Understanding and Communications Mining™:
See how to accelerate model training and optimize model performance with active learning
Learn about the latest enhancements to out-of-the-box document processing – with little to no training required
Get an exclusive demo of the new family of UiPath LLMs – GenAI models specialized for processing different types of documents and messages
This is a hands-on session specifically designed for automation developers and AI enthusiasts seeking to enhance their knowledge in leveraging the latest intelligent document processing capabilities offered by UiPath.
Speakers:
👨🏫 Andras Palfi, Senior Product Manager, UiPath
👩🏫 Lenka Dulovicova, Product Program Manager, UiPath
Builder.ai Founder Sachin Dev Duggal's Strategic Approach to Create an Innova...Ramesh Iyer
In today's fast-changing business world, Companies that adapt and embrace new ideas often need help to keep up with the competition. However, fostering a culture of innovation takes much work. It takes vision, leadership and willingness to take risks in the right proportion. Sachin Dev Duggal, co-founder of Builder.ai, has perfected the art of this balance, creating a company culture where creativity and growth are nurtured at each stage.
GraphRAG is All You need? LLM & Knowledge GraphGuy Korland
Guy Korland, CEO and Co-founder of FalkorDB, will review two articles on the integration of language models with knowledge graphs.
1. Unifying Large Language Models and Knowledge Graphs: A Roadmap.
https://arxiv.org/abs/2306.08302
2. Microsoft Research's GraphRAG paper and a review paper on various uses of knowledge graphs:
https://www.microsoft.com/en-us/research/blog/graphrag-unlocking-llm-discovery-on-narrative-private-data/
Accelerate your Kubernetes clusters with Varnish CachingThijs Feryn
A presentation about the usage and availability of Varnish on Kubernetes. This talk explores the capabilities of Varnish caching and shows how to use the Varnish Helm chart to deploy it to Kubernetes.
This presentation was delivered at K8SUG Singapore. See https://feryn.eu/presentations/accelerate-your-kubernetes-clusters-with-varnish-caching-k8sug-singapore-28-2024 for more details.
Connector Corner: Automate dynamic content and events by pushing a buttonDianaGray10
Here is something new! In our next Connector Corner webinar, we will demonstrate how you can use a single workflow to:
Create a campaign using Mailchimp with merge tags/fields
Send an interactive Slack channel message (using buttons)
Have the message received by managers and peers along with a test email for review
But there’s more:
In a second workflow supporting the same use case, you’ll see:
Your campaign sent to target colleagues for approval
If the “Approve” button is clicked, a Jira/Zendesk ticket is created for the marketing design team
But—if the “Reject” button is pushed, colleagues will be alerted via Slack message
Join us to learn more about this new, human-in-the-loop capability, brought to you by Integration Service connectors.
And...
Speakers:
Akshay Agnihotri, Product Manager
Charlie Greenberg, Host
Key Trends Shaping the Future of Infrastructure.pdfCheryl Hung
Keynote at DIGIT West Expo, Glasgow on 29 May 2024.
Cheryl Hung, ochery.com
Sr Director, Infrastructure Ecosystem, Arm.
The key trends across hardware, cloud and open-source; exploring how these areas are likely to mature and develop over the short and long-term, and then considering how organisations can position themselves to adapt and thrive.
Encryption in Microsoft 365 - ExpertsLive Netherlands 2024Albert Hoitingh
In this session I delve into the encryption technology used in Microsoft 365 and Microsoft Purview. Including the concepts of Customer Key and Double Key Encryption.
Slack (or Teams) Automation for Bonterra Impact Management (fka Social Soluti...Jeffrey Haguewood
Sidekick Solutions uses Bonterra Impact Management (fka Social Solutions Apricot) and automation solutions to integrate data for business workflows.
We believe integration and automation are essential to user experience and the promise of efficient work through technology. Automation is the critical ingredient to realizing that full vision. We develop integration products and services for Bonterra Case Management software to support the deployment of automations for a variety of use cases.
This video focuses on the notifications, alerts, and approval requests using Slack for Bonterra Impact Management. The solutions covered in this webinar can also be deployed for Microsoft Teams.
Interested in deploying notification automations for Bonterra Impact Management? Contact us at sales@sidekicksolutionsllc.com to discuss next steps.
DevOps and Testing slides at DASA ConnectKari Kakkonen
My and Rik Marselis slides at 30.5.2024 DASA Connect conference. We discuss about what is testing, then what is agile testing and finally what is Testing in DevOps. Finally we had lovely workshop with the participants trying to find out different ways to think about quality and testing in different parts of the DevOps infinity loop.
3. A SHORT HISTORY
1983 – NASA began to explore the concept of a polar-orbiting platform to
complement a manned polar-orbiting space station
Beginning as System Z, gained momentum with NASA’s proposed “Global
Habitability” program
After Challenger disaster, polar space station disappeared as did manned
servicing requirement
System Z became EOS – Earth Observing System
Several instrument suites were developed
Surface Imaging and Sounding Package (SISP) included the Moderate
Resolution Imaging Spectrometer
MODIS soon split into 2 concepts
MODIS-N focused primarily on land and atmosphere sensing but included
some ocean bands
MODIS-T (tilting) focused on ocean
Due to budget constraints, MODIS-T vanished, replaced by MODIS-N
1/21/2014
3
4. INTRODUCTION
The Moderate Resolution Imaging Spectroradiometer
(MODIS), one of the key instruments for NASA’s Earth
Observing System (EOS), was built by Raytheon Santa
Barbara Remote Sensing (SBRS)
MODIS Proto Flight Model (PFM) was launched on board
Terra spacecraft on 12/18/99 (first light on 02/24/00).
http://terra.nasa.gov
MODIS Flight Model 1 (FM1) on Aqua spacecraft was
launched on 05/04/02 (first light on 06/24/02)
http://eos-pm.gsfc.nasa.gov
1/21/2014
4
5. Contd…
MODIS (Moderate Resolution Imaging Spectrometer) is an
imaging instrument flying at an altitude of 705 km on two
satellites in NASA’s Earth Observing System: Terra and Aqua.
Two sun-synchronous, near-polar orbiting satellites called Terra
(EOS AM-1) and Aqua (EOS PM-1) each carry a MODIS sensor
Terra orbits from south to north with a morning equatorial crossing.
Aqua orbits from north to south with an afternoon equatorial crossing
Flying on two satellites allows it to image the same area at
different times of the day as well as cover the entire earth in
one or two days.
1/21/2014
5
7. LAUNCH OBJECTIVES
Unprecedented look at
terrestrial, atmospheric,
ocean
and
phenomenology for a wide and diverse
community of users throughout the world.
To develop a valid global, interactive Earth system models able to
predict global change accurately enough to assist policy makers
in making sound decisions concerning the protection of our
environment
1/21/2014
7
9. DESIGN CONCEPTS
The Scan Mirror Assembly uses a continuously rotating double-sided
scan mirror to scan 55-degrees
The MODIS instrument consists of a cross-track scan mirror,
collecting optics and individual detector elements.
The swath dimensions of MODIS are 2330km (across track) by 10km
(along track at nadir).
The along track swath dimension is due to the optical set-up as well
as the scanning mechanism of MODIS.
In contrast to other scanning sensors like e.g. AVHRR, MODIS is
observing within one scan ten lines of 1km spatial resolution (40 lines
of 250m resolution and 20 lines of 500m resolution, respectively).
1/21/2014
9
11. Major Bands of MODIS Sensors
MODIS reflectance products focuses on Red, Blue, NIR AND MIR
Red band highly related with plant growth- to calculate EVI(enhanced)
AND NDVI
Blue band
Shortest and nosiest band to monitor atmospheric dust and other
particles travelling across the globe
Eliminating atmospheric noise on the calculation of vegetation
indices
The bands help monitor changes in vegetation ,soil and atmosphere
that can influence in calculation of ecosystem variables like
vegetation indices
NIR to visualize land and water (land reflects it while water bodies
almost absorb it all)
MIR band to determine cloud properties vegetation and soil moisture
1/21/2014
11
13. CONTD…
Its coarse spatial resolution is designed to observe land, ocean,
and atmospheric conditions at a regional and global scale.
The MODIS instrument provides high radiometric sensitivity (12
bit) in 36 spectral bands ranging in wavelength from 0.4 µm to
14.4 over a 2330 km swath.
20 Reflective Solar Bands (RSB): 0.4 - 2.2 microns
16 Thermal Emissive Bands (TEB) 3.5 - 14.5 microns
Bands are imaged at a nominal resolution of 250 m at nadir, with
five bands at 500 m, and the remaining 29 bands at 1 km.
1/21/2014
13
14. MODIS PRODUCTS
Availability of a suite of products ranging from raw images to
highly processed products such as vegetation indices.
Products are made on varying temporal schedules, some of
which are made as often as daily and every 8 days.
Products are all archived and available, usually at no charge.
MODIS products are organized into different processing
levels.
Level 0 products are raw digital number images.
Level 1 products include raw radiance and calibrated
radiance images. .
Level 2 and 3 products have more processing and are
derived from lower level products.
1/21/2014
14
15. WHERE TO GET MODIS PRODUCTS???
Level 1 and atmosphere products are available through the
Level 1 and Atmospheric Archive and Distribution System
(LAADS). http://ladsweb.nascom.nasa.gov/
Level 2 and 3 Land Products are available through Nasa’s
Warehouse Inventory Search Too (WIST) and the Land
Processes Distributed Active Archive Center (LPDAAC) Data
Pool at the U. S. Geological Survey EROS Data Center
(EDC). https://lpdaac.usgs.gov/get_data
1/21/2014
15
16. RECEIVING STATION
MODIS on board the Terra and Aqua spacecraft have the
feature of Direct Broadcast capability together with an on
board data storage and a transmission capability initiated by a
ground command.
Direct Broadcast means that all raw data collected on board
are immediately transmitted to ground.
Everybody on the world can listen to the downloaded data
whenever the satellite is above their horizon assuming
appropriate hard- and software equipment.
An Overpass Predictor delivered by NASA can be used to
determine when there will be a TERRA / AQUA spacecraft
overpass. More than 50 stations world-wide are now in
operation for receiving MODIS data by Direct Broadcast.
1/21/2014
16
17. MODIS receiving station at
ICIMOD,NEPAL
MODIS, a sensor onboard NASA's Terra and Aqua
satellites, includes the mid-infrared, allows the
application to identify the locations of thermal
anomalies, and thus active fires.
The Forest Fire Detection and Monitoring System
application uses real-time data downloaded by
ICIMOD's MODIS receiving station.
The application also adds key information from
SERVIR-Himalaya, including administrative unit
(i.e., district), protected area identification, land
cover, elevation, and slope, as well as road network
data.
The MODIS data, with ancillary data, are used to
identify the affected areas, provide district-level
fire count statistics, and provide information such
as the distance to the nearest road.
1/21/2014
The user can overlay the MODIS data with, for
example, the land cover data, to assess the damage
caused by the forest fire. A key feature of this
application is its ability to send fire alerts via
SMS/text message and/or emails to fire officials on17
their mobile telephones.