Download to read offline

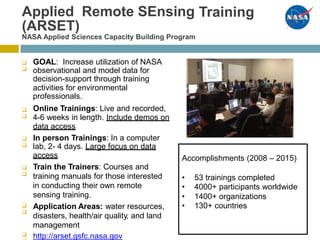
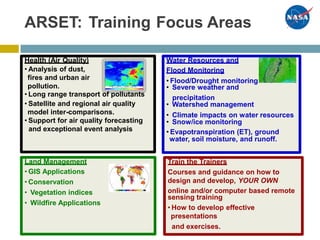
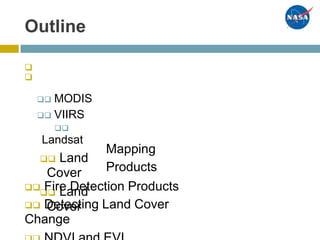

The ARSET NASA webinar provides training on remote sensing for land management and wildfire applications, aiming to enhance the use of NASA's observational data for environmental decision-making. Training formats include online sessions and in-person labs, covering topics such as flood monitoring, health impacts, and land management using various satellite data products like MODIS and Landsat. Key accomplishments since 2008 include over 53 completed trainings with more than 4,000 participants from over 130 countries.


