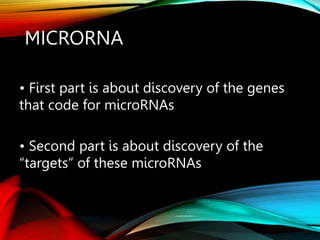
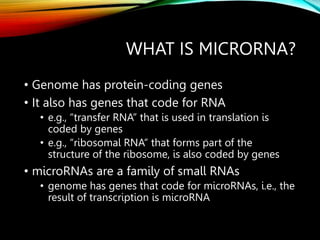
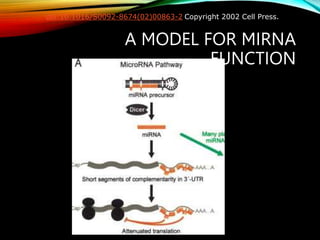
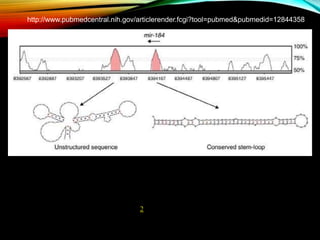
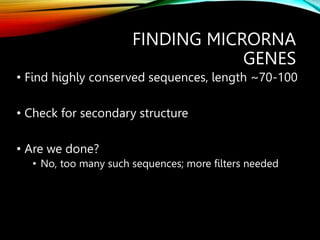
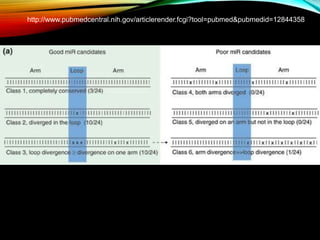
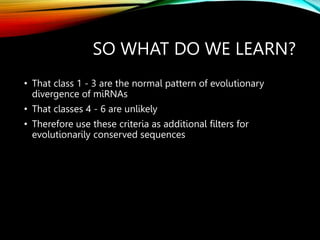
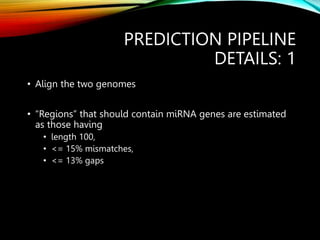
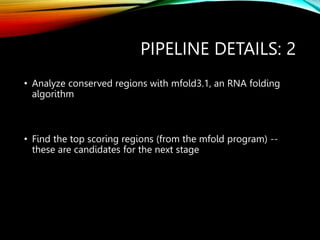
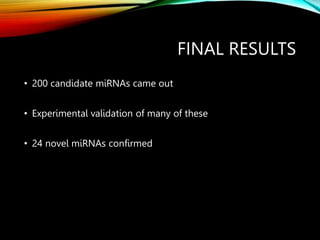
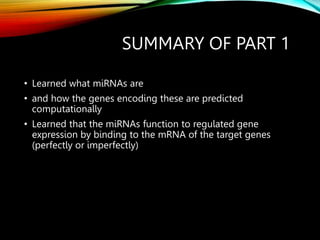
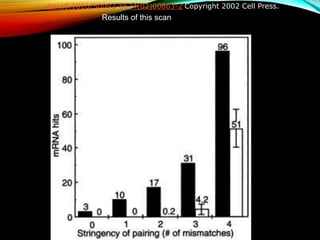
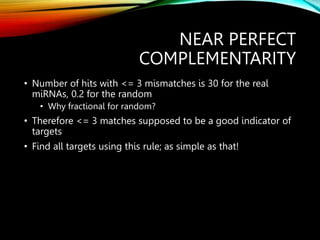
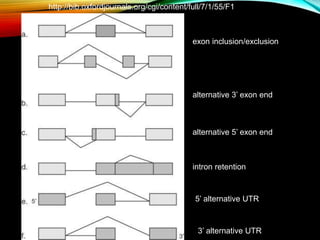
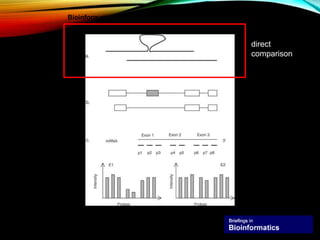
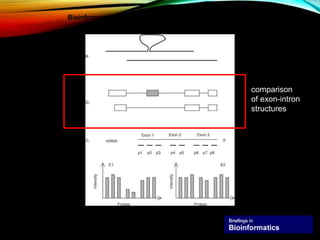
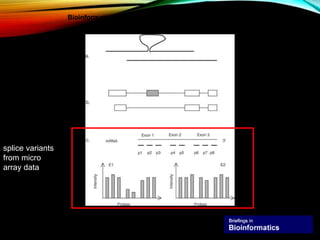
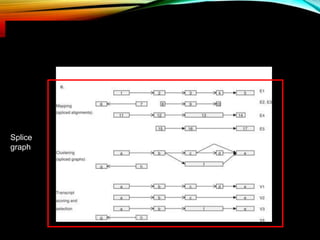
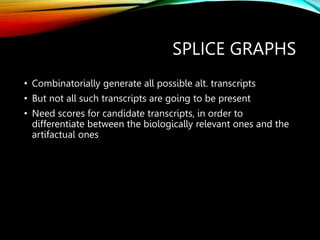
TWO SHORT PIECES
MicroRNA
Alternative splicing
MICRORNA
• First part is about discovery of the genes
that code for microRNAs
• Second part is about discovery of the
“targets” of these microRNAs
WHAT IS MICRORNA?
• Genome has protein-coding genes
• It also has genes that code for RNA
• e.g., “transfer RNA” that is used in translation is
coded by genes
• e.g., “ribosomal RNA” that forms part of the
structure of the ribosome, is also coded by genes
• microRNAs are a family of small RNAs
• genome has genes that code for microRNAs, i.e., the
result of transcription is microRNA
WHAT IS MICRORNA?
• 21-22 nucleotide non-coding RNA
• The gene that codes for a miRNA first produces a ~70
nucleotide transcript
• This “pre-miRNA” transcript has the capacity to form a stem-
loop structure
• This pre-miRNA is then processed into 21-22 nucleotide
long miRNA by an enzyme called Dicer.
WHAT IS MICRORNA?
• Vast majority of microRNAs regulate other genes
by binding to complementary sequences in the
target gene
• Perfect complementarity of binding leads to
mRNA degradation of the target gene
• Imperfect pairing inhibits translation of mRNA to
protein
• miRNAs are an important piece of the puzzle
that is gene regulation
A MODEL FOR MIRNA
FUNCTION
doi:10.1016/S0092-8674(02)00863-2 Copyright 2002 Cell Press.
HOW TO FIND MIRNAS?
• Experimental methods so far
• Lai et al (2003) one of the works that try solving this problem
computationally
• Basic idea:
• look for evolutionarily conserved sequences
• check if some of these fold well into the stem-loop structure
(“hairpins”) associated with miRNAs
COMPARATIVE GENOMICS
• Start with 24 known Drosophila pre-miRNAs (the ~70-100
long transcripts before miRNAs)
• All are found to be conserved beween D. melanogaster and
D. pseudoobscura
• Typically, more conserved than gene. (The third codon
“wobble” not relevant here)
miRNA genes are isolated, evolutionarily conserved genomic sequences that have the capacity to
form extended stem-loop structures as RNA. Shown are VISTA plots of globally aligned sequence
from D. melanogaster and D. pseudoobscura, in which the degree of conservation is represented by
the height of the peak. This particular region contains a conserved sequence identified in this study
that adopts a stem-loop structure characteristic of known miRNAs. Expression of this sequence
was confirmed by northern analysis (Table 2), and it was subsequently determined to be the fly
ortholog of mammalian mir-184. Most conserved sequences do not have the ability to form
extended stem-loops, as evidenced by the fold adopted by the sequence in the neighboring peak.
http://www.pubmedcentral.nih.gov/articlerender.fcgi?tool=pubmed&pubmedid=12844358
FINDING MICRORNA
GENES
• Find highly conserved sequences, length ~70-100
• Check for secondary structure
• Are we done?
• No, too many such sequences; more filters needed
COMPARATIVE GENOMICS
• Look carefully at pairwise alignments of each of
the 24 pairs or orthologous pre-miRNAs.
• Only three pairs completely conserved
• Ten pairs are diverged exclusively within their
loop sequence;no pair diverged exclusively in
arm
• Of the 11 remaining, seven show more changes
in the loop than in non-miRNA-encoding arm
http://www.pubmedcentral.nih.gov/articlerender.fcgi?tool=pubmed&pubmedid=12844358
SO WHAT DO WE LEARN?
• That class 1 - 3 are the normal pattern of evolutionary
divergence of miRNAs
• That classes 4 - 6 are unlikely
• Therefore use these criteria as additional filters for
evolutionarily conserved sequences
PREDICTION PIPELINE
DETAILS: 1
• Align the two genomes
• “Regions” that should contain miRNA genes are estimated
as those having
• length 100,
• <= 15% mismatches,
• <= 13% gaps
PIPELINE DETAILS: 2
• Analyze conserved regions with mfold3.1, an RNA folding
algorithm
• Find the top scoring regions (from the mfold program) --
these are candidates for the next stage
PIPELINE DETAILS: 3
• Assess the divergence pattern of candidate miRNAs
• Boolean filters: remove candidates with
• exclusive divergence in arm
• more divergence in miRNA-coding arm than in loop
FINAL RESULTS
• 200 candidate miRNAs came out
• Experimental validation of many of these
• 24 novel miRNAs confirmed
SUMMARY OF PART 1
• Learned what miRNAs are
• and how the genes encoding these are predicted
computationally
• Learned that the miRNAs function to regulated gene
expression by binding to the mRNA of the target genes
(perfectly or imperfectly)
PART 2: FINDING THE
TARGETS
• Rhoades et al (2002)
• We should be looking for targets …
• … with base complementarity
• But small size (20-24 nt) and imperfect base
pairing imply that we may ending up predicting
too many
• Rhoades et al found that nearly perfect
complementarity is a good indicator of miRNA
targets in plant
PLANT MIRNAS
• Started with 16 known Arabidopsis miRNAs
• Looked for complementary strings with <= 4 mismatches
and no gaps
• Also did the same genome-wide search with “randomized”
versions of the 16 miRNAs
Results of this scan
doi:10.1016/S0092-8674(02)00863-2 Copyright 2002 Cell Press.
NEAR PERFECT
COMPLEMENTARITY
• Number of hits with <= 3 mismatches is 30 for the real
miRNAs, 0.2 for the random
• Why fractional for random?
• Therefore <= 3 matches supposed to be a good indicator of
targets
• Find all targets using this rule; as simple as that!
ALTERNATIVE SPLICING
(A REVIEW BY LILIANA FLOREA, 2006)
WHAT IS ALTERNATIVE
SPLICING?
• The first result of transcription is “pre-mRNA”
• This undergoes “splicing”, i.e., introns are excised out,
and exons remain, to form mRNA
• This splicing process may involve different
combinations of exons, leading to different mRNAs, and
different proteins
• This is alternative splicing
SIGNIFICANCE
• Important regulatory mechanism, for modulating gene and
protein content in the cell
• Large-scale genomic data today suggests that as many as
60% of the human genes undergo alternative splicing
SIGNIFICANCE
• Number of human genes has recently been
estimated to be about 20-25 K.
• Not significantly greater than much less
complex organisms
• Alternative splicing is a potential explanation of
how a large variety of proteins can be achieved
with a small number of genes
• Errors in splicing mechanism implicated in
diseases such as cancers
http://bib.oxfordjournals.org/cgi/content/full/7/1/55/F1
exon inclusion/exclusion
alternative 3’ exon end
alternative 5’ exon end
intron retention
5’ alternative UTR
3’ alternative UTR
BIOINFORMATICS OF ALT.
SPLICING
• Two main goals:
• Find out cases of alt. splicing
• What are the different forms (“isoforms”) of a gene?
• Find out how alt. splicing is regulated
• What are the sequence motifs controlling alt. splicing, and
deciding which isoform will be produced
IDENTIFICATION OF SPLICE
VARIANTS
• Direct comparison between sequences of
different cDNA isoforms
• Q: What is cDNA? How is this different from a gene’s
DNA?
• cDNA is “complementary DNA”, obtained by reverse
transcription from mRNA. It has no introns
• Direct comparison reveals differences in the
isoforms
• But this difference could be part of an exon, a
whole exon, or a set of exons
Copyright restrictions may apply.
Florea, L. Brief Bioinform 2006 7:55-69; doi:10.1093/bib/bbk005
Bioinformatics methods for identifying alternative splicing
direct
comparison
IDENTIFICATION OF SPLICE
VARIANTS
• Comparison of exon-intron structures (the gene’s
architecture)
• Where do the exon-intron structures come from?
• Align cDNA (no introns) with genomic sequence (with introns)
• This gives us the intron and exon structure
Copyright restrictions may apply.
Florea, L. Brief Bioinform 2006 7:55-69; doi:10.1093/bib/bbk005
Bioinformatics methods for identifying alternative splicing
comparison
of exon-intron
structures
IDENTIFICATION OF SPLICE
VARIANTS
• Alignment tools.
• Align cDNA sequence to genomic sequence
• Why shouldn’t this be a perfect match with
gaps (introns)?
• Sequencing errors, polymorphisms, etc.
• Special purpose alignment programs for this
purpose
SPLICE VARIANTS FROM
MICROARRAY DATA
• Affymetrix GeneChip technology uses 22 probes collected
from exons or straddling exon boundaries
• When an exon is alternatively spliced, expression level of its
probes will be different in different experiments
Copyright restrictions may apply.
Florea, L. Brief Bioinform 2006 7:55-69; doi:10.1093/bib/bbk005
Bioinformatics methods for identifying alternative splicing
splice variants
from micro
array data
IDENTIFYING FULL LENGH ALT.
SPLICED TRANSCRIPTS
• Previous methods identified parts of alt. spliced transcript
• We assumed we had access to the cDNA sequence, i.e., the
full transcript
• Much more difficult to identify full length transcripts (i.e., all
alt. spliced forms)
METHOD 1 (“GENE
INDICES”)
• EST is the sequence of a partial transcript
• Compare all EST sequences against one another
• Identify significant overlaps
• Group and assemble sequences with
compatible overlaps into clusters
• Similar to the assembly task, except that we are
also dealing with alt. spliced forms here
Gene
indices
PROBLEMS WITH THIS
METHOD
• Overclustering: paralogs may get clustered
together.
• What are paralogs?
• Related but distinct genes in the same species
• Underclustering: if number of ESTs is not
sufficient
• Computationally expensive:
• Quadratic time complexity
METHOD 2: SPLICE
GRAPHS
• Nodes: Exons
• Edges: Introns
• Gene: directed acyclic graph
• Each path in this DAG is an alternative transcript
Splice
graph
Spliced alignments of cDNAs on the genome (E1–E5) are clustered along the genomic axis and
consolidated into splice graphs. Vertices in the splice graph represent exons (a–h), arcs are introns
connecting the exons consistently with the cDNA evidence, and a branching in the graph signals an
alternative splicing event. Splice variants (V1–V4) are read from the graph as paths from a source vertex
(with no ‘in’ arc) to a sink vertex (with no ‘out’ arc).
SPLICE GRAPHS
• Combinatorially generate all possible alt. transcripts
• But not all such transcripts are going to be present
• Need scores for candidate transcripts, in order to
differentiate between the biologically relevant ones and the
artifactual ones
SUMMARY
• Alternative splicing is very important
• Bioinformatics for finding alternative spliced forms

Micro RNA.ppt

  • 1.
  • 2.
    MICRORNA • First partis about discovery of the genes that code for microRNAs • Second part is about discovery of the “targets” of these microRNAs
  • 3.
    WHAT IS MICRORNA? •Genome has protein-coding genes • It also has genes that code for RNA • e.g., “transfer RNA” that is used in translation is coded by genes • e.g., “ribosomal RNA” that forms part of the structure of the ribosome, is also coded by genes • microRNAs are a family of small RNAs • genome has genes that code for microRNAs, i.e., the result of transcription is microRNA
  • 4.
    WHAT IS MICRORNA? •21-22 nucleotide non-coding RNA • The gene that codes for a miRNA first produces a ~70 nucleotide transcript • This “pre-miRNA” transcript has the capacity to form a stem- loop structure • This pre-miRNA is then processed into 21-22 nucleotide long miRNA by an enzyme called Dicer.
  • 5.
    WHAT IS MICRORNA? •Vast majority of microRNAs regulate other genes by binding to complementary sequences in the target gene • Perfect complementarity of binding leads to mRNA degradation of the target gene • Imperfect pairing inhibits translation of mRNA to protein • miRNAs are an important piece of the puzzle that is gene regulation
  • 6.
    A MODEL FORMIRNA FUNCTION doi:10.1016/S0092-8674(02)00863-2 Copyright 2002 Cell Press.
  • 7.
    HOW TO FINDMIRNAS? • Experimental methods so far • Lai et al (2003) one of the works that try solving this problem computationally • Basic idea: • look for evolutionarily conserved sequences • check if some of these fold well into the stem-loop structure (“hairpins”) associated with miRNAs
  • 8.
    COMPARATIVE GENOMICS • Startwith 24 known Drosophila pre-miRNAs (the ~70-100 long transcripts before miRNAs) • All are found to be conserved beween D. melanogaster and D. pseudoobscura • Typically, more conserved than gene. (The third codon “wobble” not relevant here)
  • 9.
    miRNA genes areisolated, evolutionarily conserved genomic sequences that have the capacity to form extended stem-loop structures as RNA. Shown are VISTA plots of globally aligned sequence from D. melanogaster and D. pseudoobscura, in which the degree of conservation is represented by the height of the peak. This particular region contains a conserved sequence identified in this study that adopts a stem-loop structure characteristic of known miRNAs. Expression of this sequence was confirmed by northern analysis (Table 2), and it was subsequently determined to be the fly ortholog of mammalian mir-184. Most conserved sequences do not have the ability to form extended stem-loops, as evidenced by the fold adopted by the sequence in the neighboring peak. http://www.pubmedcentral.nih.gov/articlerender.fcgi?tool=pubmed&pubmedid=12844358
  • 10.
    FINDING MICRORNA GENES • Findhighly conserved sequences, length ~70-100 • Check for secondary structure • Are we done? • No, too many such sequences; more filters needed
  • 11.
    COMPARATIVE GENOMICS • Lookcarefully at pairwise alignments of each of the 24 pairs or orthologous pre-miRNAs. • Only three pairs completely conserved • Ten pairs are diverged exclusively within their loop sequence;no pair diverged exclusively in arm • Of the 11 remaining, seven show more changes in the loop than in non-miRNA-encoding arm
  • 12.
  • 13.
    SO WHAT DOWE LEARN? • That class 1 - 3 are the normal pattern of evolutionary divergence of miRNAs • That classes 4 - 6 are unlikely • Therefore use these criteria as additional filters for evolutionarily conserved sequences
  • 14.
    PREDICTION PIPELINE DETAILS: 1 •Align the two genomes • “Regions” that should contain miRNA genes are estimated as those having • length 100, • <= 15% mismatches, • <= 13% gaps
  • 15.
    PIPELINE DETAILS: 2 •Analyze conserved regions with mfold3.1, an RNA folding algorithm • Find the top scoring regions (from the mfold program) -- these are candidates for the next stage
  • 16.
    PIPELINE DETAILS: 3 •Assess the divergence pattern of candidate miRNAs • Boolean filters: remove candidates with • exclusive divergence in arm • more divergence in miRNA-coding arm than in loop
  • 17.
    FINAL RESULTS • 200candidate miRNAs came out • Experimental validation of many of these • 24 novel miRNAs confirmed
  • 18.
    SUMMARY OF PART1 • Learned what miRNAs are • and how the genes encoding these are predicted computationally • Learned that the miRNAs function to regulated gene expression by binding to the mRNA of the target genes (perfectly or imperfectly)
  • 19.
    PART 2: FINDINGTHE TARGETS • Rhoades et al (2002) • We should be looking for targets … • … with base complementarity • But small size (20-24 nt) and imperfect base pairing imply that we may ending up predicting too many • Rhoades et al found that nearly perfect complementarity is a good indicator of miRNA targets in plant
  • 20.
    PLANT MIRNAS • Startedwith 16 known Arabidopsis miRNAs • Looked for complementary strings with <= 4 mismatches and no gaps • Also did the same genome-wide search with “randomized” versions of the 16 miRNAs
  • 21.
    Results of thisscan doi:10.1016/S0092-8674(02)00863-2 Copyright 2002 Cell Press.
  • 22.
    NEAR PERFECT COMPLEMENTARITY • Numberof hits with <= 3 mismatches is 30 for the real miRNAs, 0.2 for the random • Why fractional for random? • Therefore <= 3 matches supposed to be a good indicator of targets • Find all targets using this rule; as simple as that!
  • 23.
    ALTERNATIVE SPLICING (A REVIEWBY LILIANA FLOREA, 2006)
  • 24.
    WHAT IS ALTERNATIVE SPLICING? •The first result of transcription is “pre-mRNA” • This undergoes “splicing”, i.e., introns are excised out, and exons remain, to form mRNA • This splicing process may involve different combinations of exons, leading to different mRNAs, and different proteins • This is alternative splicing
  • 25.
    SIGNIFICANCE • Important regulatorymechanism, for modulating gene and protein content in the cell • Large-scale genomic data today suggests that as many as 60% of the human genes undergo alternative splicing
  • 26.
    SIGNIFICANCE • Number ofhuman genes has recently been estimated to be about 20-25 K. • Not significantly greater than much less complex organisms • Alternative splicing is a potential explanation of how a large variety of proteins can be achieved with a small number of genes • Errors in splicing mechanism implicated in diseases such as cancers
  • 27.
    http://bib.oxfordjournals.org/cgi/content/full/7/1/55/F1 exon inclusion/exclusion alternative 3’exon end alternative 5’ exon end intron retention 5’ alternative UTR 3’ alternative UTR
  • 28.
    BIOINFORMATICS OF ALT. SPLICING •Two main goals: • Find out cases of alt. splicing • What are the different forms (“isoforms”) of a gene? • Find out how alt. splicing is regulated • What are the sequence motifs controlling alt. splicing, and deciding which isoform will be produced
  • 29.
    IDENTIFICATION OF SPLICE VARIANTS •Direct comparison between sequences of different cDNA isoforms • Q: What is cDNA? How is this different from a gene’s DNA? • cDNA is “complementary DNA”, obtained by reverse transcription from mRNA. It has no introns • Direct comparison reveals differences in the isoforms • But this difference could be part of an exon, a whole exon, or a set of exons
  • 30.
    Copyright restrictions mayapply. Florea, L. Brief Bioinform 2006 7:55-69; doi:10.1093/bib/bbk005 Bioinformatics methods for identifying alternative splicing direct comparison
  • 31.
    IDENTIFICATION OF SPLICE VARIANTS •Comparison of exon-intron structures (the gene’s architecture) • Where do the exon-intron structures come from? • Align cDNA (no introns) with genomic sequence (with introns) • This gives us the intron and exon structure
  • 32.
    Copyright restrictions mayapply. Florea, L. Brief Bioinform 2006 7:55-69; doi:10.1093/bib/bbk005 Bioinformatics methods for identifying alternative splicing comparison of exon-intron structures
  • 33.
    IDENTIFICATION OF SPLICE VARIANTS •Alignment tools. • Align cDNA sequence to genomic sequence • Why shouldn’t this be a perfect match with gaps (introns)? • Sequencing errors, polymorphisms, etc. • Special purpose alignment programs for this purpose
  • 34.
    SPLICE VARIANTS FROM MICROARRAYDATA • Affymetrix GeneChip technology uses 22 probes collected from exons or straddling exon boundaries • When an exon is alternatively spliced, expression level of its probes will be different in different experiments
  • 35.
    Copyright restrictions mayapply. Florea, L. Brief Bioinform 2006 7:55-69; doi:10.1093/bib/bbk005 Bioinformatics methods for identifying alternative splicing splice variants from micro array data
  • 36.
    IDENTIFYING FULL LENGHALT. SPLICED TRANSCRIPTS • Previous methods identified parts of alt. spliced transcript • We assumed we had access to the cDNA sequence, i.e., the full transcript • Much more difficult to identify full length transcripts (i.e., all alt. spliced forms)
  • 37.
    METHOD 1 (“GENE INDICES”) •EST is the sequence of a partial transcript • Compare all EST sequences against one another • Identify significant overlaps • Group and assemble sequences with compatible overlaps into clusters • Similar to the assembly task, except that we are also dealing with alt. spliced forms here
  • 38.
  • 39.
    PROBLEMS WITH THIS METHOD •Overclustering: paralogs may get clustered together. • What are paralogs? • Related but distinct genes in the same species • Underclustering: if number of ESTs is not sufficient • Computationally expensive: • Quadratic time complexity
  • 40.
    METHOD 2: SPLICE GRAPHS •Nodes: Exons • Edges: Introns • Gene: directed acyclic graph • Each path in this DAG is an alternative transcript
  • 41.
    Splice graph Spliced alignments ofcDNAs on the genome (E1–E5) are clustered along the genomic axis and consolidated into splice graphs. Vertices in the splice graph represent exons (a–h), arcs are introns connecting the exons consistently with the cDNA evidence, and a branching in the graph signals an alternative splicing event. Splice variants (V1–V4) are read from the graph as paths from a source vertex (with no ‘in’ arc) to a sink vertex (with no ‘out’ arc).
  • 42.
    SPLICE GRAPHS • Combinatoriallygenerate all possible alt. transcripts • But not all such transcripts are going to be present • Need scores for candidate transcripts, in order to differentiate between the biologically relevant ones and the artifactual ones
  • 43.
    SUMMARY • Alternative splicingis very important • Bioinformatics for finding alternative spliced forms