The document discusses various concepts related to measurement and error including:
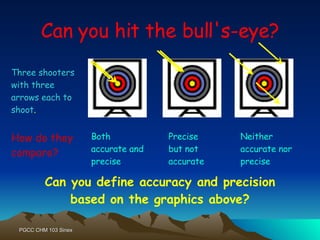
- Defining accuracy as closeness to the true value and precision as reproducibility of measurements.
- Types of errors such as determinate/systematic errors which can be corrected and indeterminate/random errors which average out with multiple trials.
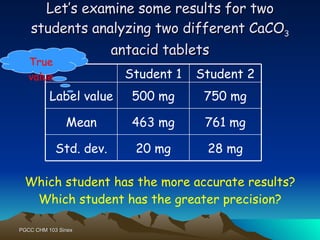
- Assessing total error by treating a reference standard as a sample and calculating differences from the reference value.
- Expressing accuracy and precision using terms like mean, percent error, range, standard deviation, and percent coefficient of variation.


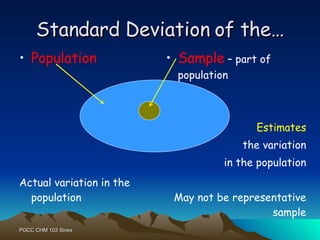

![THE SAMPLE STANDARD DEVIATION allows for more variation in the sample compared to the population, since sample is only part of population. Dividing by n-1 increases the estimate of the population variation. This attempts to eliminate the possibility of bias . On the TI-83, the sample standard deviation is given as Sx when you do 1-Var Stats under [STAT] CALC. Population Sample In Excel, use STDEV under insert function, f x](https://image.slidesharecdn.com/measurement-1215963655816041-8/85/Measurement-20-320.jpg)