Downloaded 11 times
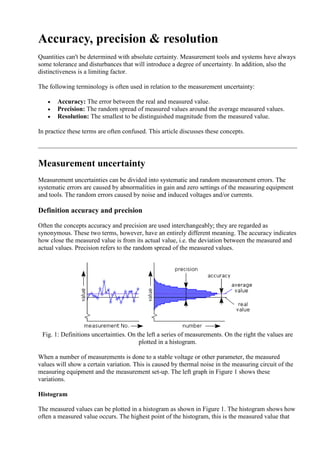
![Fig. 4: Total uncertainty of 5 % reading and 3 % full-scale on a 100 V range and a reading of 70 V.
Calculation of measurement uncertainty
The specification of the tolerance of the reading and the full scale together determine the total
measurement uncertainty of an instrument. In the following calculation example the same values are
used as in the examples above:
Accuracy: ±5 % reading (3 % full scale)
Range: 100 V, Reading: 70 V
The total measurement uncertainty is now calculated as follows:
[equ. 1]
In this situation, a total uncertainty of 7.5 V up and down. The real value should be between 62.5
and 77.5 volts. Figure 4 shows this graphically.
The percentage uncertainty is the relationship between reading and uncertainty. In the given
situation this is:
[equ. 2]
Digits
A digital multimeter can hold a specification of "±2.0 % rdg, + 4 digits. This means that 4 digits
have to be added to the reading uncertainty of 2 %. As an example again a 3½ digit digital readout.
This will read 5.00 V in while the 20 V range is selected. 2 % of the reading would mean an
uncertainty of 0.1 V. Add to this the inaccuracy of the digits (= 0.04 V). The total uncertainty is
therefore 0.14 V. The real value should be between 4.86 and 5.14 volts.](https://image.slidesharecdn.com/accuracy-precision-resolution-200415181237/85/Accuracy-precision-resolution-4-320.jpg)

![Suppose that an oscilloscope has a tolerance of 1.5 % and a 1:10 probe is used with a system
uncertainty of 2.5 %. These two specifications can be multiplied together to obtain total reading
uncertainty:
[equ. 3]
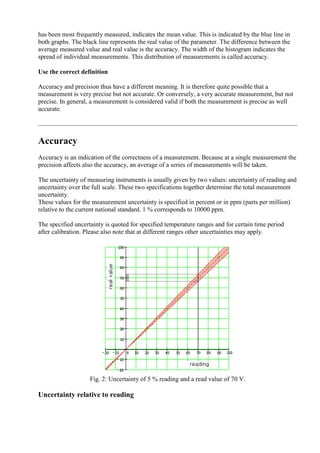
Measuring with a shunt resistor
Fig. 7: Increases of uncertainty when using a shunt resistor.
To measure currents an external shunt resistor is often used. The shunt has a certain tolerance that
affects the measurement.
The specified tolerance of the shunt resistor refers to the reading uncertainty. To find the total
uncertainty, the tolerance of the shunt and the reading uncertainty of the measuring instrument are
multiplied together:
[equ. 4]
In this example, the total reading uncertainty is 3.53 %.
The resistance of the shunt is temperature dependent. The resistance value is specified for a given
temperature. The temperature dependence is often expressed in ppm/°C.
As an example the calculating of the resistance value at ambient temperature (Tamb) of 30 °C. The
shunt has a specification: R=100 Ω @ 22 °C (respectively Rnom & Tnom), and a temperature
dependence of 20 ppm/°C.
[equ. 5]
The current flowing through the shunt causes dissipation of energy in the shunt and this will result
in rising of the temperature and therefore a change in resistance value. The change in resistance
value due to the current flow is dependent on several factors. For very accurate measurements the
shunt must be calibrated at a flow resistance and environmental conditions in which these will be
used.](https://image.slidesharecdn.com/accuracy-precision-resolution-200415181237/85/Accuracy-precision-resolution-6-320.jpg)
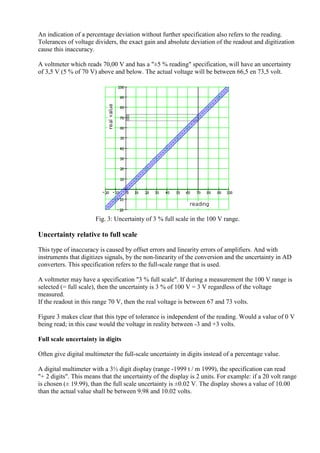
![Precision
The term precision is used to express the random measurement error. The random nature of the
deviations of the measured value is mostly of thermal origin. Because of the arbitrary nature of this
noise it's not possible to give an absolute error. The precision gives only the probability that the
measurement value is between given limits.
Fig. 8: Probability distribution for μ=2 en σ=1.
Gaussian distribution
Thermal noise has a Gaussian or normal distribution. This is described by the following equation:
[equ. 6]
Here is μ the mean value and σ indicates the degree of dispersion and corresponds to the RMS value
of the noise signal. The function provides a probability distribution curve as shown in Figure 8
where the mean value μ 2 is and the effective noise amplitude σ 1.
Table 1:
Probability Values
Border Chance
0,5·σ 38.3 %
0,674·σ 50.0 %
1·σ 68.3 %
2·σ 95.4 %
3·σ 99.7 %
Probability table
Table 1 lists some chance values expressed at a certain limit. As seen, the probability that a
measured value is within ±3·σ is 99.7 %.
Improving precision
The precision of a measurement can be improved by oversampling or filtering. The individual
measurements are averaged out so that the noise quantity is greatly reduced. The spread of the
measured values is hereby also reduced. With oversampling or filtering must be taken into account
that this may reduce the bandwidth.](https://image.slidesharecdn.com/accuracy-precision-resolution-200415181237/85/Accuracy-precision-resolution-7-320.jpg)

1. Accuracy refers to how close a measurement is to the actual value, while precision describes the consistency of repeated measurements. 2. Measurement uncertainty comes from systematic errors in instruments and random errors from noise. Total uncertainty is calculated by combining the uncertainties. 3. Improving precision involves averaging measurements to reduce noise, but this may reduce bandwidth. Resolution is the smallest distinguishable difference in values.


