SlideShare a Scribd company logo
1 of 15
• Accuracy is the closeness of a measured value to the trueAccuracy is the closeness of a measured value to the true
value.value.
• For example, the measured density of water has become moreFor example, the measured density of water has become more
accurate with improved experimental design, technique, andaccurate with improved experimental design, technique, and
equipment.equipment.
ACCURACYACCURACY
Density of HDensity of H22O at 20° CO at 20° C
(g/cm(g/cm33
))
11
1.01.0
1.001.00
0.9980.998
0.99820.9982
0.998200.99820
0.9982030.998203
• Percent error is used to estimate the accuracy of aPercent error is used to estimate the accuracy of a
measurement.measurement.
• Percent error will always be a positive.Percent error will always be a positive.
• What is the percent error if the measured density of titanium (Ti)What is the percent error if the measured density of titanium (Ti)
is 4.45 g/cmis 4.45 g/cm33
and the accepted density of Ti is 4.50 g/cmand the accepted density of Ti is 4.50 g/cm33
??
ACCURACYACCURACY
Average = 15.3 μg/LAverage = 15.3 μg/L
Standard Deviation = 2.1 μg/LStandard Deviation = 2.1 μg/L
What is the true concentration of As in this experiment?What is the true concentration of As in this experiment?
Estimate the accuracy of this method.Estimate the accuracy of this method.
How precise is this method?How precise is this method?
• Precision is the agreement between repeated measurements of thePrecision is the agreement between repeated measurements of the
same sample. Precision is usually expressed as a standard deviation.same sample. Precision is usually expressed as a standard deviation.
• For example, the precision of a method for measuring arsenic (As) wasFor example, the precision of a method for measuring arsenic (As) was
determined by measuring 7 different solutions each containing 14.3 μg/L ofdetermined by measuring 7 different solutions each containing 14.3 μg/L of
As.As.
PRECISIONPRECISION
MeasuredMeasured
ConcentrationConcentration
(μg/L)(μg/L)
18.418.4
13.613.6
13.613.6
14.214.2
16.016.0
13.613.6
17.817.8
14.3 μg/L14.3 μg/L
2.1 μg/L2.1 μg/L
• Describe the accuracy and precision of these 4 targets.Describe the accuracy and precision of these 4 targets.
ACCURACY AND PRECISIONACCURACY AND PRECISION
Accurate, andAccurate, and
preciseprecise
Precise, butPrecise, but
not accuratenot accurate
Accurate, butAccurate, but
not precisenot precise
Not accurate,Not accurate,
and notand not
preciseprecise
• Systematic (or determinate) errors are reproducible andSystematic (or determinate) errors are reproducible and
cause a bias in the same direction for each measurement.cause a bias in the same direction for each measurement.
• For example, a poorly trained operator that consistently makesFor example, a poorly trained operator that consistently makes
the same mistake will cause systematic error. Systematic errorthe same mistake will cause systematic error. Systematic error
can be corrected.can be corrected.
• Random (or indeterminate) errors are caused by the naturalRandom (or indeterminate) errors are caused by the natural
uncertainty that occurs with any measurement.uncertainty that occurs with any measurement.
• Random errors obey the laws of probability. That is, randomRandom errors obey the laws of probability. That is, random
error might cause a value to be over predicted during its firsterror might cause a value to be over predicted during its first
measurement and under predicted during its secondmeasurement and under predicted during its second
measurement. Random error cannot be corrected.measurement. Random error cannot be corrected.
ERRORSERRORS
• By convention, a measurement is recorded by writing all exactlyBy convention, a measurement is recorded by writing all exactly
known numbers and 1 number which is uncertain, together withknown numbers and 1 number which is uncertain, together with
a unit label.a unit label.
• All numbers written in this way, including the uncertain digit, areAll numbers written in this way, including the uncertain digit, are
called significant figures.called significant figures.
• For example, the blue line is 2.73 cm long. This measurementFor example, the blue line is 2.73 cm long. This measurement
has 3 significant figures. The first 2 digits (2.7 cm) are exactlyhas 3 significant figures. The first 2 digits (2.7 cm) are exactly
known. The third digit (0.03 cm) is uncertain because it wasknown. The third digit (0.03 cm) is uncertain because it was
interpolated or estimated 1 digit beyond the smallestinterpolated or estimated 1 digit beyond the smallest
graduation.graduation.
INTERPOLATION AND SIGNIFICANT FIGURESINTERPOLATION AND SIGNIFICANT FIGURES
• What is the volume of water in this graduated cylinder? AlwaysWhat is the volume of water in this graduated cylinder? Always
measure the volume of a liquid at the bottom of the meniscus.measure the volume of a liquid at the bottom of the meniscus.
The units are mL.The units are mL.
• The volume of water is 52.8 mL. The 52 mL are exactly known,The volume of water is 52.8 mL. The 52 mL are exactly known,
and the 0.8 mL is uncertain because it was interpolated orand the 0.8 mL is uncertain because it was interpolated or
estimated 1 digit beyond the smallest graduation.estimated 1 digit beyond the smallest graduation.
INTERPOLATION AND SIGNIFICANT FIGURESINTERPOLATION AND SIGNIFICANT FIGURES
• Zeros between nonzero digits are significant. That is, 508 cmZeros between nonzero digits are significant. That is, 508 cm
has 3 significant figures.has 3 significant figures.
• Leading zeroes merely locate the decimal point and are neverLeading zeroes merely locate the decimal point and are never
significant. That is, 0.0497 cm equals 4.97 x 10significant. That is, 0.0497 cm equals 4.97 x 10⁻²-2
cm and has 3cm and has 3
significant figures.significant figures.
• Trailing zeros are significant as follows: 50.0 mL has 3Trailing zeros are significant as follows: 50.0 mL has 3
significant figures, 50. mL has 2 significant figures, and 50 mLsignificant figures, 50. mL has 2 significant figures, and 50 mL
has 1 significant figure.has 1 significant figure.
SIGNIFICANT FIGURES AND ZEROSSIGNIFICANT FIGURES AND ZEROS
DatumDatum
(grams)(grams)
Number ofNumber of
SignificantSignificant
FiguresFigures
DatumDatum
(milliliters)(milliliters)
Number ofNumber of
SignificantSignificant
FiguresFigures
10,03410,034
1.9081.908
0.320.32
0.000460.00046
150150
0.00001600.0000160
150.150.
0.7050.705
0.0540.054
5.86 x 105.86 x 10-7-7
30403040
0.00007300.0000730
55
44
22
22
22
33
33
33
22
33
33
33
• When adding or subtracting do NOT extend the result beyondWhen adding or subtracting do NOT extend the result beyond
the first column with a doubtful figure. For example, …the first column with a doubtful figure. For example, …
SIGNIFICANT FIGURES, ADDITION, AND SUBTRACTIONSIGNIFICANT FIGURES, ADDITION, AND SUBTRACTION
• What is 16.874 + 2.6?What is 16.874 + 2.6?
• What is 16.874 - 2.6?What is 16.874 - 2.6?
SIGNIFICANT FIGURES, ADDITION, AND SUBTRACTIONSIGNIFICANT FIGURES, ADDITION, AND SUBTRACTION
• When multiplying or dividing the answer will have the sameWhen multiplying or dividing the answer will have the same
number of significant digits as the least accurate number usednumber of significant digits as the least accurate number used
to get the answer. For example, …to get the answer. For example, …
2.005 g / 4.95 mL = 0.405 g/mL2.005 g / 4.95 mL = 0.405 g/mL
• What is 16.874 x 2.6?What is 16.874 x 2.6?
• What is 16.874 / 2.6?What is 16.874 / 2.6?
SIGNIFICANT FIGURES, MULTIPLICATION, AND DIVISIONSIGNIFICANT FIGURES, MULTIPLICATION, AND DIVISION
• AnAn averageaverage is the best estimate of the true value of ais the best estimate of the true value of a
parameter.parameter.
• AA standard deviationstandard deviation is a measure of precision.is a measure of precision.
• Averages and standard deviations require several steps toAverages and standard deviations require several steps to
calculate. You must keep track of the number of significantcalculate. You must keep track of the number of significant
figures during each step. Dofigures during each step. Do NOTNOT discard or round any figuresdiscard or round any figures
until the final number is reported.until the final number is reported.
SIGNIFICANT FIGURES AND CALCULATIONS THATSIGNIFICANT FIGURES AND CALCULATIONS THAT
REQUIRE MULTIPLE STEPSREQUIRE MULTIPLE STEPS
SIGNIFICANT FIGURES AND CALCULATIONS THATSIGNIFICANT FIGURES AND CALCULATIONS THAT
REQUIRE MULTIPLE STEPSREQUIRE MULTIPLE STEPS
2 Significant
Figures
1 Significant Figure
2 Significant Figures
0 Significant Figures
1 Significant Figure
Significant Figures∞
• What is average and standard deviation for the following 3What is average and standard deviation for the following 3
measurements of the same sample?measurements of the same sample?
• American Public Health Association, American Water Works Association,American Public Health Association, American Water Works Association,
Water Environment Federation. 1995. Standard Methods for the ExaminationWater Environment Federation. 1995. Standard Methods for the Examination
of Water and Wastewater. 19th ed. Washington, DC: American Public Healthof Water and Wastewater. 19th ed. Washington, DC: American Public Health
Association.Association.
• Barnes, D.S., J.A. Chandler. 1982. Chemistry 111-112 Workbook andBarnes, D.S., J.A. Chandler. 1982. Chemistry 111-112 Workbook and
Laboratory Manual. Amherst, MA: University of Massachusetts.Laboratory Manual. Amherst, MA: University of Massachusetts.
• Christian, G.D. 1986. Analytical Chemistry, 3rd ed. New York, NY: JohnChristian, G.D. 1986. Analytical Chemistry, 3rd ed. New York, NY: John
Wiley & Sons, Inc.Wiley & Sons, Inc.
• Frisbie, S.H., E.J. Mitchell, A.Z. Yusuf, M.Y. Siddiq, R.E. Sanchez, R.Frisbie, S.H., E.J. Mitchell, A.Z. Yusuf, M.Y. Siddiq, R.E. Sanchez, R.
Ortega, D.M. Maynard, B. Sarkar. 2005. The development and use of anOrtega, D.M. Maynard, B. Sarkar. 2005. The development and use of an
innovative laboratory method for measuring arsenic in drinking water frominnovative laboratory method for measuring arsenic in drinking water from
western Bangladesh. Environmental Health Perspectives. 113(9):1196-1204.western Bangladesh. Environmental Health Perspectives. 113(9):1196-1204.
• Morrison Laboratories. 2006. Meniscus Madness. Available:Morrison Laboratories. 2006. Meniscus Madness. Available:
http://www.morrisonlabs.com/meniscus.htmhttp://www.morrisonlabs.com/meniscus.htm [accessed 25 August 2006].[accessed 25 August 2006].
SOURCESSOURCES

More Related Content

What's hot

11.1 uncertainty in measurement
11.1 uncertainty in measurement11.1 uncertainty in measurement
11.1 uncertainty in measurementPunia Turiman
 
Statistical analysis in analytical chemistry
Statistical analysis in analytical chemistryStatistical analysis in analytical chemistry
Statistical analysis in analytical chemistryJethro Masangkay
 
Selection and calibration of analytical method & calibration methods
Selection and calibration  of analytical method & calibration methodsSelection and calibration  of analytical method & calibration methods
Selection and calibration of analytical method & calibration methodsTapeshwar Yadav
 
Accuracy and precision
Accuracy and precisionAccuracy and precision
Accuracy and precisionmsali_aphs
 
Accuracy precision and significant figs (1)
Accuracy precision and significant figs (1)Accuracy precision and significant figs (1)
Accuracy precision and significant figs (1)vinaybagal1
 
Analytical chemistry lecture 3
Analytical chemistry lecture 3Analytical chemistry lecture 3
Analytical chemistry lecture 3Sunita Jobli
 
Stoichiometry Notes.ppt.pptx
Stoichiometry Notes.ppt.pptxStoichiometry Notes.ppt.pptx
Stoichiometry Notes.ppt.pptxJoshuaJoseph70
 
Volumetric analysis new
Volumetric analysis newVolumetric analysis new
Volumetric analysis newUday Deokate
 
Concentration units
Concentration unitsConcentration units
Concentration unitsSidra Javed
 
Analytical chemistry, errors, significant figures & Calibration
Analytical chemistry, errors, significant figures & CalibrationAnalytical chemistry, errors, significant figures & Calibration
Analytical chemistry, errors, significant figures & CalibrationNaresh Babu
 
Chapter 5 stoichiometric calculations summer2014
Chapter 5 stoichiometric calculations summer2014Chapter 5 stoichiometric calculations summer2014
Chapter 5 stoichiometric calculations summer2014Cleophas Rwemera
 
Uncertainity in Measurement
Uncertainity in MeasurementUncertainity in Measurement
Uncertainity in MeasurementThe Apprentiice
 
Chapter 1 introduction to analytical chemistry
Chapter 1 introduction to analytical chemistryChapter 1 introduction to analytical chemistry
Chapter 1 introduction to analytical chemistryMuhammad Hanif Baki
 

What's hot (20)

Units of measurement
Units of measurementUnits of measurement
Units of measurement
 
11.1 uncertainty in measurement
11.1 uncertainty in measurement11.1 uncertainty in measurement
11.1 uncertainty in measurement
 
1. errors ppt
1. errors ppt1. errors ppt
1. errors ppt
 
Statistical analysis in analytical chemistry
Statistical analysis in analytical chemistryStatistical analysis in analytical chemistry
Statistical analysis in analytical chemistry
 
Selection and calibration of analytical method & calibration methods
Selection and calibration  of analytical method & calibration methodsSelection and calibration  of analytical method & calibration methods
Selection and calibration of analytical method & calibration methods
 
Normality
NormalityNormality
Normality
 
Accuracy and precision
Accuracy and precisionAccuracy and precision
Accuracy and precision
 
Stoichiometric Calculations
Stoichiometric CalculationsStoichiometric Calculations
Stoichiometric Calculations
 
Accuracy precision and significant figs (1)
Accuracy precision and significant figs (1)Accuracy precision and significant figs (1)
Accuracy precision and significant figs (1)
 
Chapter 1(5)Measurement and Error
Chapter 1(5)Measurement andErrorChapter 1(5)Measurement andError
Chapter 1(5)Measurement and Error
 
Analytical chemistry lecture 3
Analytical chemistry lecture 3Analytical chemistry lecture 3
Analytical chemistry lecture 3
 
Gravimetry
GravimetryGravimetry
Gravimetry
 
Stoichiometry Notes.ppt.pptx
Stoichiometry Notes.ppt.pptxStoichiometry Notes.ppt.pptx
Stoichiometry Notes.ppt.pptx
 
Volumetric analysis new
Volumetric analysis newVolumetric analysis new
Volumetric analysis new
 
Concentration units
Concentration unitsConcentration units
Concentration units
 
Errors
ErrorsErrors
Errors
 
Analytical chemistry, errors, significant figures & Calibration
Analytical chemistry, errors, significant figures & CalibrationAnalytical chemistry, errors, significant figures & Calibration
Analytical chemistry, errors, significant figures & Calibration
 
Chapter 5 stoichiometric calculations summer2014
Chapter 5 stoichiometric calculations summer2014Chapter 5 stoichiometric calculations summer2014
Chapter 5 stoichiometric calculations summer2014
 
Uncertainity in Measurement
Uncertainity in MeasurementUncertainity in Measurement
Uncertainity in Measurement
 
Chapter 1 introduction to analytical chemistry
Chapter 1 introduction to analytical chemistryChapter 1 introduction to analytical chemistry
Chapter 1 introduction to analytical chemistry
 

Similar to Accuracy precision errors

Measurement NOTES
Measurement NOTESMeasurement NOTES
Measurement NOTEStdresch
 
Measuring sf-scinot
Measuring sf-scinotMeasuring sf-scinot
Measuring sf-scinotstephm32
 
PP_6a_Significant_Figures.ppt
PP_6a_Significant_Figures.pptPP_6a_Significant_Figures.ppt
PP_6a_Significant_Figures.pptOMPRAKASHGURJAR10
 
PPT-MST (2).pptxgsggggggggggggggggggggggggggggggggghhhs
PPT-MST (2).pptxgsggggggggggggggggggggggggggggggggghhhsPPT-MST (2).pptxgsggggggggggggggggggggggggggggggggghhhs
PPT-MST (2).pptxgsggggggggggggggggggggggggggggggggghhhsleamangaring12
 
Lecture 3.1- Measurements (HP)
Lecture 3.1- Measurements (HP)Lecture 3.1- Measurements (HP)
Lecture 3.1- Measurements (HP)Mary Beth Smith
 
Measurements and dimensional analysis
Measurements and dimensional analysisMeasurements and dimensional analysis
Measurements and dimensional analysisantonettealbina
 
Measurements in chemistry
Measurements in chemistryMeasurements in chemistry
Measurements in chemistrymakaberokurota
 
Description and Measurement
Description and MeasurementDescription and Measurement
Description and MeasurementDwayne Squires
 
3-measurement-161127184347.pptx
3-measurement-161127184347.pptx3-measurement-161127184347.pptx
3-measurement-161127184347.pptxDinoraSattorzoda
 
Metrics and Measurement
Metrics and MeasurementMetrics and Measurement
Metrics and MeasurementPaul Schumann
 
Analytical Chemistry.ppsx
Analytical Chemistry.ppsxAnalytical Chemistry.ppsx
Analytical Chemistry.ppsxSrShafnaJose
 
Ch 3 Measurement And Density
Ch 3  Measurement And DensityCh 3  Measurement And Density
Ch 3 Measurement And Densitykermis
 
Measure of Variability Report.pptx
Measure of Variability Report.pptxMeasure of Variability Report.pptx
Measure of Variability Report.pptxCalvinAdorDionisio
 

Similar to Accuracy precision errors (20)

Measurement NOTES
Measurement NOTESMeasurement NOTES
Measurement NOTES
 
Measuring sf-scinot
Measuring sf-scinotMeasuring sf-scinot
Measuring sf-scinot
 
PP_6a_Significant_Figures.ppt
PP_6a_Significant_Figures.pptPP_6a_Significant_Figures.ppt
PP_6a_Significant_Figures.ppt
 
Measuring college chap2
Measuring college chap2Measuring college chap2
Measuring college chap2
 
PPT-MST (2).pptxgsggggggggggggggggggggggggggggggggghhhs
PPT-MST (2).pptxgsggggggggggggggggggggggggggggggggghhhsPPT-MST (2).pptxgsggggggggggggggggggggggggggggggggghhhs
PPT-MST (2).pptxgsggggggggggggggggggggggggggggggggghhhs
 
Lecture 3&4
Lecture 3&4Lecture 3&4
Lecture 3&4
 
Lecture 3&4
Lecture 3&4Lecture 3&4
Lecture 3&4
 
Lecture 3.1- Measurements (HP)
Lecture 3.1- Measurements (HP)Lecture 3.1- Measurements (HP)
Lecture 3.1- Measurements (HP)
 
Measurements and dimensional analysis
Measurements and dimensional analysisMeasurements and dimensional analysis
Measurements and dimensional analysis
 
Measurements in chemistry
Measurements in chemistryMeasurements in chemistry
Measurements in chemistry
 
Description and Measurement
Description and MeasurementDescription and Measurement
Description and Measurement
 
Measurement teacher
Measurement teacherMeasurement teacher
Measurement teacher
 
Measurements
MeasurementsMeasurements
Measurements
 
PowerPointCh2_Section2.3.pdf
PowerPointCh2_Section2.3.pdfPowerPointCh2_Section2.3.pdf
PowerPointCh2_Section2.3.pdf
 
3-measurement-161127184347.pptx
3-measurement-161127184347.pptx3-measurement-161127184347.pptx
3-measurement-161127184347.pptx
 
Metrics and Measurement
Metrics and MeasurementMetrics and Measurement
Metrics and Measurement
 
Analytical Chemistry.ppsx
Analytical Chemistry.ppsxAnalytical Chemistry.ppsx
Analytical Chemistry.ppsx
 
Ch 3 Measurement And Density
Ch 3  Measurement And DensityCh 3  Measurement And Density
Ch 3 Measurement And Density
 
1.2
1.21.2
1.2
 
Measure of Variability Report.pptx
Measure of Variability Report.pptxMeasure of Variability Report.pptx
Measure of Variability Report.pptx
 

More from DrSampuranSuahg

Bacterial growth & cultivation
Bacterial growth & cultivationBacterial growth & cultivation
Bacterial growth & cultivationDrSampuranSuahg
 
Bacterial count, method to count bacteria
Bacterial count, method to count bacteriaBacterial count, method to count bacteria
Bacterial count, method to count bacteriaDrSampuranSuahg
 
Skin care products, row material of skin care products
Skin care products, row material of skin care productsSkin care products, row material of skin care products
Skin care products, row material of skin care productsDrSampuranSuahg
 
Herbal cosmetic, sourcs of cosmetic, types of cosmetic
Herbal cosmetic, sourcs of cosmetic, types of cosmeticHerbal cosmetic, sourcs of cosmetic, types of cosmetic
Herbal cosmetic, sourcs of cosmetic, types of cosmeticDrSampuranSuahg
 
GMP, Goods manufacturer Practices, Drug and Cosmetic act
GMP, Goods manufacturer Practices, Drug and Cosmetic actGMP, Goods manufacturer Practices, Drug and Cosmetic act
GMP, Goods manufacturer Practices, Drug and Cosmetic actDrSampuranSuahg
 

More from DrSampuranSuahg (7)

Bacterial growth & cultivation
Bacterial growth & cultivationBacterial growth & cultivation
Bacterial growth & cultivation
 
Bacterial count, method to count bacteria
Bacterial count, method to count bacteriaBacterial count, method to count bacteria
Bacterial count, method to count bacteria
 
Acid base titrations
Acid base titrationsAcid base titrations
Acid base titrations
 
Skin care products, row material of skin care products
Skin care products, row material of skin care productsSkin care products, row material of skin care products
Skin care products, row material of skin care products
 
Herbal cosmetic, sourcs of cosmetic, types of cosmetic
Herbal cosmetic, sourcs of cosmetic, types of cosmeticHerbal cosmetic, sourcs of cosmetic, types of cosmetic
Herbal cosmetic, sourcs of cosmetic, types of cosmetic
 
GMP, Goods manufacturer Practices, Drug and Cosmetic act
GMP, Goods manufacturer Practices, Drug and Cosmetic actGMP, Goods manufacturer Practices, Drug and Cosmetic act
GMP, Goods manufacturer Practices, Drug and Cosmetic act
 
ICH Guidelines
ICH GuidelinesICH Guidelines
ICH Guidelines
 

Recently uploaded

Q4-W6-Restating Informational Text Grade 3
Q4-W6-Restating Informational Text Grade 3Q4-W6-Restating Informational Text Grade 3
Q4-W6-Restating Informational Text Grade 3JemimahLaneBuaron
 
URLs and Routing in the Odoo 17 Website App
URLs and Routing in the Odoo 17 Website AppURLs and Routing in the Odoo 17 Website App
URLs and Routing in the Odoo 17 Website AppCeline George
 
Nutritional Needs Presentation - HLTH 104
Nutritional Needs Presentation - HLTH 104Nutritional Needs Presentation - HLTH 104
Nutritional Needs Presentation - HLTH 104misteraugie
 
Beyond the EU: DORA and NIS 2 Directive's Global Impact
Beyond the EU: DORA and NIS 2 Directive's Global ImpactBeyond the EU: DORA and NIS 2 Directive's Global Impact
Beyond the EU: DORA and NIS 2 Directive's Global ImpactPECB
 
Student login on Anyboli platform.helpin
Student login on Anyboli platform.helpinStudent login on Anyboli platform.helpin
Student login on Anyboli platform.helpinRaunakKeshri1
 
1029 - Danh muc Sach Giao Khoa 10 . pdf
1029 -  Danh muc Sach Giao Khoa 10 . pdf1029 -  Danh muc Sach Giao Khoa 10 . pdf
1029 - Danh muc Sach Giao Khoa 10 . pdfQucHHunhnh
 
Mastering the Unannounced Regulatory Inspection
Mastering the Unannounced Regulatory InspectionMastering the Unannounced Regulatory Inspection
Mastering the Unannounced Regulatory InspectionSafetyChain Software
 
Organic Name Reactions for the students and aspirants of Chemistry12th.pptx
Organic Name Reactions  for the students and aspirants of Chemistry12th.pptxOrganic Name Reactions  for the students and aspirants of Chemistry12th.pptx
Organic Name Reactions for the students and aspirants of Chemistry12th.pptxVS Mahajan Coaching Centre
 
Presentation by Andreas Schleicher Tackling the School Absenteeism Crisis 30 ...
Presentation by Andreas Schleicher Tackling the School Absenteeism Crisis 30 ...Presentation by Andreas Schleicher Tackling the School Absenteeism Crisis 30 ...
Presentation by Andreas Schleicher Tackling the School Absenteeism Crisis 30 ...EduSkills OECD
 
SOCIAL AND HISTORICAL CONTEXT - LFTVD.pptx
SOCIAL AND HISTORICAL CONTEXT - LFTVD.pptxSOCIAL AND HISTORICAL CONTEXT - LFTVD.pptx
SOCIAL AND HISTORICAL CONTEXT - LFTVD.pptxiammrhaywood
 
Separation of Lanthanides/ Lanthanides and Actinides
Separation of Lanthanides/ Lanthanides and ActinidesSeparation of Lanthanides/ Lanthanides and Actinides
Separation of Lanthanides/ Lanthanides and ActinidesFatimaKhan178732
 
Software Engineering Methodologies (overview)
Software Engineering Methodologies (overview)Software Engineering Methodologies (overview)
Software Engineering Methodologies (overview)eniolaolutunde
 
POINT- BIOCHEMISTRY SEM 2 ENZYMES UNIT 5.pptx
POINT- BIOCHEMISTRY SEM 2 ENZYMES UNIT 5.pptxPOINT- BIOCHEMISTRY SEM 2 ENZYMES UNIT 5.pptx
POINT- BIOCHEMISTRY SEM 2 ENZYMES UNIT 5.pptxSayali Powar
 
Web & Social Media Analytics Previous Year Question Paper.pdf
Web & Social Media Analytics Previous Year Question Paper.pdfWeb & Social Media Analytics Previous Year Question Paper.pdf
Web & Social Media Analytics Previous Year Question Paper.pdfJayanti Pande
 
Introduction to AI in Higher Education_draft.pptx
Introduction to AI in Higher Education_draft.pptxIntroduction to AI in Higher Education_draft.pptx
Introduction to AI in Higher Education_draft.pptxpboyjonauth
 
Hybridoma Technology ( Production , Purification , and Application )
Hybridoma Technology  ( Production , Purification , and Application  ) Hybridoma Technology  ( Production , Purification , and Application  )
Hybridoma Technology ( Production , Purification , and Application ) Sakshi Ghasle
 
Z Score,T Score, Percential Rank and Box Plot Graph
Z Score,T Score, Percential Rank and Box Plot GraphZ Score,T Score, Percential Rank and Box Plot Graph
Z Score,T Score, Percential Rank and Box Plot GraphThiyagu K
 
Paris 2024 Olympic Geographies - an activity
Paris 2024 Olympic Geographies - an activityParis 2024 Olympic Geographies - an activity
Paris 2024 Olympic Geographies - an activityGeoBlogs
 

Recently uploaded (20)

Q4-W6-Restating Informational Text Grade 3
Q4-W6-Restating Informational Text Grade 3Q4-W6-Restating Informational Text Grade 3
Q4-W6-Restating Informational Text Grade 3
 
URLs and Routing in the Odoo 17 Website App
URLs and Routing in the Odoo 17 Website AppURLs and Routing in the Odoo 17 Website App
URLs and Routing in the Odoo 17 Website App
 
Nutritional Needs Presentation - HLTH 104
Nutritional Needs Presentation - HLTH 104Nutritional Needs Presentation - HLTH 104
Nutritional Needs Presentation - HLTH 104
 
Beyond the EU: DORA and NIS 2 Directive's Global Impact
Beyond the EU: DORA and NIS 2 Directive's Global ImpactBeyond the EU: DORA and NIS 2 Directive's Global Impact
Beyond the EU: DORA and NIS 2 Directive's Global Impact
 
Student login on Anyboli platform.helpin
Student login on Anyboli platform.helpinStudent login on Anyboli platform.helpin
Student login on Anyboli platform.helpin
 
Staff of Color (SOC) Retention Efforts DDSD
Staff of Color (SOC) Retention Efforts DDSDStaff of Color (SOC) Retention Efforts DDSD
Staff of Color (SOC) Retention Efforts DDSD
 
1029 - Danh muc Sach Giao Khoa 10 . pdf
1029 -  Danh muc Sach Giao Khoa 10 . pdf1029 -  Danh muc Sach Giao Khoa 10 . pdf
1029 - Danh muc Sach Giao Khoa 10 . pdf
 
Mastering the Unannounced Regulatory Inspection
Mastering the Unannounced Regulatory InspectionMastering the Unannounced Regulatory Inspection
Mastering the Unannounced Regulatory Inspection
 
Organic Name Reactions for the students and aspirants of Chemistry12th.pptx
Organic Name Reactions  for the students and aspirants of Chemistry12th.pptxOrganic Name Reactions  for the students and aspirants of Chemistry12th.pptx
Organic Name Reactions for the students and aspirants of Chemistry12th.pptx
 
Presentation by Andreas Schleicher Tackling the School Absenteeism Crisis 30 ...
Presentation by Andreas Schleicher Tackling the School Absenteeism Crisis 30 ...Presentation by Andreas Schleicher Tackling the School Absenteeism Crisis 30 ...
Presentation by Andreas Schleicher Tackling the School Absenteeism Crisis 30 ...
 
Mattingly "AI & Prompt Design: Structured Data, Assistants, & RAG"
Mattingly "AI & Prompt Design: Structured Data, Assistants, & RAG"Mattingly "AI & Prompt Design: Structured Data, Assistants, & RAG"
Mattingly "AI & Prompt Design: Structured Data, Assistants, & RAG"
 
SOCIAL AND HISTORICAL CONTEXT - LFTVD.pptx
SOCIAL AND HISTORICAL CONTEXT - LFTVD.pptxSOCIAL AND HISTORICAL CONTEXT - LFTVD.pptx
SOCIAL AND HISTORICAL CONTEXT - LFTVD.pptx
 
Separation of Lanthanides/ Lanthanides and Actinides
Separation of Lanthanides/ Lanthanides and ActinidesSeparation of Lanthanides/ Lanthanides and Actinides
Separation of Lanthanides/ Lanthanides and Actinides
 
Software Engineering Methodologies (overview)
Software Engineering Methodologies (overview)Software Engineering Methodologies (overview)
Software Engineering Methodologies (overview)
 
POINT- BIOCHEMISTRY SEM 2 ENZYMES UNIT 5.pptx
POINT- BIOCHEMISTRY SEM 2 ENZYMES UNIT 5.pptxPOINT- BIOCHEMISTRY SEM 2 ENZYMES UNIT 5.pptx
POINT- BIOCHEMISTRY SEM 2 ENZYMES UNIT 5.pptx
 
Web & Social Media Analytics Previous Year Question Paper.pdf
Web & Social Media Analytics Previous Year Question Paper.pdfWeb & Social Media Analytics Previous Year Question Paper.pdf
Web & Social Media Analytics Previous Year Question Paper.pdf
 
Introduction to AI in Higher Education_draft.pptx
Introduction to AI in Higher Education_draft.pptxIntroduction to AI in Higher Education_draft.pptx
Introduction to AI in Higher Education_draft.pptx
 
Hybridoma Technology ( Production , Purification , and Application )
Hybridoma Technology  ( Production , Purification , and Application  ) Hybridoma Technology  ( Production , Purification , and Application  )
Hybridoma Technology ( Production , Purification , and Application )
 
Z Score,T Score, Percential Rank and Box Plot Graph
Z Score,T Score, Percential Rank and Box Plot GraphZ Score,T Score, Percential Rank and Box Plot Graph
Z Score,T Score, Percential Rank and Box Plot Graph
 
Paris 2024 Olympic Geographies - an activity
Paris 2024 Olympic Geographies - an activityParis 2024 Olympic Geographies - an activity
Paris 2024 Olympic Geographies - an activity
 

Accuracy precision errors

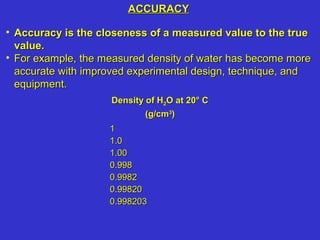
  • 1. • Accuracy is the closeness of a measured value to the trueAccuracy is the closeness of a measured value to the true value.value. • For example, the measured density of water has become moreFor example, the measured density of water has become more accurate with improved experimental design, technique, andaccurate with improved experimental design, technique, and equipment.equipment. ACCURACYACCURACY Density of HDensity of H22O at 20° CO at 20° C (g/cm(g/cm33 )) 11 1.01.0 1.001.00 0.9980.998 0.99820.9982 0.998200.99820 0.9982030.998203
  • 2. • Percent error is used to estimate the accuracy of aPercent error is used to estimate the accuracy of a measurement.measurement. • Percent error will always be a positive.Percent error will always be a positive. • What is the percent error if the measured density of titanium (Ti)What is the percent error if the measured density of titanium (Ti) is 4.45 g/cmis 4.45 g/cm33 and the accepted density of Ti is 4.50 g/cmand the accepted density of Ti is 4.50 g/cm33 ?? ACCURACYACCURACY
  • 3. Average = 15.3 μg/LAverage = 15.3 μg/L Standard Deviation = 2.1 μg/LStandard Deviation = 2.1 μg/L What is the true concentration of As in this experiment?What is the true concentration of As in this experiment? Estimate the accuracy of this method.Estimate the accuracy of this method. How precise is this method?How precise is this method? • Precision is the agreement between repeated measurements of thePrecision is the agreement between repeated measurements of the same sample. Precision is usually expressed as a standard deviation.same sample. Precision is usually expressed as a standard deviation. • For example, the precision of a method for measuring arsenic (As) wasFor example, the precision of a method for measuring arsenic (As) was determined by measuring 7 different solutions each containing 14.3 μg/L ofdetermined by measuring 7 different solutions each containing 14.3 μg/L of As.As. PRECISIONPRECISION MeasuredMeasured ConcentrationConcentration (μg/L)(μg/L) 18.418.4 13.613.6 13.613.6 14.214.2 16.016.0 13.613.6 17.817.8 14.3 μg/L14.3 μg/L 2.1 μg/L2.1 μg/L
  • 4. • Describe the accuracy and precision of these 4 targets.Describe the accuracy and precision of these 4 targets. ACCURACY AND PRECISIONACCURACY AND PRECISION Accurate, andAccurate, and preciseprecise Precise, butPrecise, but not accuratenot accurate Accurate, butAccurate, but not precisenot precise Not accurate,Not accurate, and notand not preciseprecise
  • 5. • Systematic (or determinate) errors are reproducible andSystematic (or determinate) errors are reproducible and cause a bias in the same direction for each measurement.cause a bias in the same direction for each measurement. • For example, a poorly trained operator that consistently makesFor example, a poorly trained operator that consistently makes the same mistake will cause systematic error. Systematic errorthe same mistake will cause systematic error. Systematic error can be corrected.can be corrected. • Random (or indeterminate) errors are caused by the naturalRandom (or indeterminate) errors are caused by the natural uncertainty that occurs with any measurement.uncertainty that occurs with any measurement. • Random errors obey the laws of probability. That is, randomRandom errors obey the laws of probability. That is, random error might cause a value to be over predicted during its firsterror might cause a value to be over predicted during its first measurement and under predicted during its secondmeasurement and under predicted during its second measurement. Random error cannot be corrected.measurement. Random error cannot be corrected. ERRORSERRORS
  • 6. • By convention, a measurement is recorded by writing all exactlyBy convention, a measurement is recorded by writing all exactly known numbers and 1 number which is uncertain, together withknown numbers and 1 number which is uncertain, together with a unit label.a unit label. • All numbers written in this way, including the uncertain digit, areAll numbers written in this way, including the uncertain digit, are called significant figures.called significant figures. • For example, the blue line is 2.73 cm long. This measurementFor example, the blue line is 2.73 cm long. This measurement has 3 significant figures. The first 2 digits (2.7 cm) are exactlyhas 3 significant figures. The first 2 digits (2.7 cm) are exactly known. The third digit (0.03 cm) is uncertain because it wasknown. The third digit (0.03 cm) is uncertain because it was interpolated or estimated 1 digit beyond the smallestinterpolated or estimated 1 digit beyond the smallest graduation.graduation. INTERPOLATION AND SIGNIFICANT FIGURESINTERPOLATION AND SIGNIFICANT FIGURES
  • 7. • What is the volume of water in this graduated cylinder? AlwaysWhat is the volume of water in this graduated cylinder? Always measure the volume of a liquid at the bottom of the meniscus.measure the volume of a liquid at the bottom of the meniscus. The units are mL.The units are mL. • The volume of water is 52.8 mL. The 52 mL are exactly known,The volume of water is 52.8 mL. The 52 mL are exactly known, and the 0.8 mL is uncertain because it was interpolated orand the 0.8 mL is uncertain because it was interpolated or estimated 1 digit beyond the smallest graduation.estimated 1 digit beyond the smallest graduation. INTERPOLATION AND SIGNIFICANT FIGURESINTERPOLATION AND SIGNIFICANT FIGURES
  • 8. • Zeros between nonzero digits are significant. That is, 508 cmZeros between nonzero digits are significant. That is, 508 cm has 3 significant figures.has 3 significant figures. • Leading zeroes merely locate the decimal point and are neverLeading zeroes merely locate the decimal point and are never significant. That is, 0.0497 cm equals 4.97 x 10significant. That is, 0.0497 cm equals 4.97 x 10⁻²-2 cm and has 3cm and has 3 significant figures.significant figures. • Trailing zeros are significant as follows: 50.0 mL has 3Trailing zeros are significant as follows: 50.0 mL has 3 significant figures, 50. mL has 2 significant figures, and 50 mLsignificant figures, 50. mL has 2 significant figures, and 50 mL has 1 significant figure.has 1 significant figure. SIGNIFICANT FIGURES AND ZEROSSIGNIFICANT FIGURES AND ZEROS DatumDatum (grams)(grams) Number ofNumber of SignificantSignificant FiguresFigures DatumDatum (milliliters)(milliliters) Number ofNumber of SignificantSignificant FiguresFigures 10,03410,034 1.9081.908 0.320.32 0.000460.00046 150150 0.00001600.0000160 150.150. 0.7050.705 0.0540.054 5.86 x 105.86 x 10-7-7 30403040 0.00007300.0000730 55 44 22 22 22 33 33 33 22 33 33 33
  • 9. • When adding or subtracting do NOT extend the result beyondWhen adding or subtracting do NOT extend the result beyond the first column with a doubtful figure. For example, …the first column with a doubtful figure. For example, … SIGNIFICANT FIGURES, ADDITION, AND SUBTRACTIONSIGNIFICANT FIGURES, ADDITION, AND SUBTRACTION
  • 10. • What is 16.874 + 2.6?What is 16.874 + 2.6? • What is 16.874 - 2.6?What is 16.874 - 2.6? SIGNIFICANT FIGURES, ADDITION, AND SUBTRACTIONSIGNIFICANT FIGURES, ADDITION, AND SUBTRACTION
  • 11. • When multiplying or dividing the answer will have the sameWhen multiplying or dividing the answer will have the same number of significant digits as the least accurate number usednumber of significant digits as the least accurate number used to get the answer. For example, …to get the answer. For example, … 2.005 g / 4.95 mL = 0.405 g/mL2.005 g / 4.95 mL = 0.405 g/mL • What is 16.874 x 2.6?What is 16.874 x 2.6? • What is 16.874 / 2.6?What is 16.874 / 2.6? SIGNIFICANT FIGURES, MULTIPLICATION, AND DIVISIONSIGNIFICANT FIGURES, MULTIPLICATION, AND DIVISION
  • 12. • AnAn averageaverage is the best estimate of the true value of ais the best estimate of the true value of a parameter.parameter. • AA standard deviationstandard deviation is a measure of precision.is a measure of precision. • Averages and standard deviations require several steps toAverages and standard deviations require several steps to calculate. You must keep track of the number of significantcalculate. You must keep track of the number of significant figures during each step. Dofigures during each step. Do NOTNOT discard or round any figuresdiscard or round any figures until the final number is reported.until the final number is reported. SIGNIFICANT FIGURES AND CALCULATIONS THATSIGNIFICANT FIGURES AND CALCULATIONS THAT REQUIRE MULTIPLE STEPSREQUIRE MULTIPLE STEPS
  • 13. SIGNIFICANT FIGURES AND CALCULATIONS THATSIGNIFICANT FIGURES AND CALCULATIONS THAT REQUIRE MULTIPLE STEPSREQUIRE MULTIPLE STEPS 2 Significant Figures 1 Significant Figure 2 Significant Figures 0 Significant Figures 1 Significant Figure 1 Significant Figure Significant Figures∞
  • 14. • What is average and standard deviation for the following 3What is average and standard deviation for the following 3 measurements of the same sample?measurements of the same sample?
  • 15. • American Public Health Association, American Water Works Association,American Public Health Association, American Water Works Association, Water Environment Federation. 1995. Standard Methods for the ExaminationWater Environment Federation. 1995. Standard Methods for the Examination of Water and Wastewater. 19th ed. Washington, DC: American Public Healthof Water and Wastewater. 19th ed. Washington, DC: American Public Health Association.Association. • Barnes, D.S., J.A. Chandler. 1982. Chemistry 111-112 Workbook andBarnes, D.S., J.A. Chandler. 1982. Chemistry 111-112 Workbook and Laboratory Manual. Amherst, MA: University of Massachusetts.Laboratory Manual. Amherst, MA: University of Massachusetts. • Christian, G.D. 1986. Analytical Chemistry, 3rd ed. New York, NY: JohnChristian, G.D. 1986. Analytical Chemistry, 3rd ed. New York, NY: John Wiley & Sons, Inc.Wiley & Sons, Inc. • Frisbie, S.H., E.J. Mitchell, A.Z. Yusuf, M.Y. Siddiq, R.E. Sanchez, R.Frisbie, S.H., E.J. Mitchell, A.Z. Yusuf, M.Y. Siddiq, R.E. Sanchez, R. Ortega, D.M. Maynard, B. Sarkar. 2005. The development and use of anOrtega, D.M. Maynard, B. Sarkar. 2005. The development and use of an innovative laboratory method for measuring arsenic in drinking water frominnovative laboratory method for measuring arsenic in drinking water from western Bangladesh. Environmental Health Perspectives. 113(9):1196-1204.western Bangladesh. Environmental Health Perspectives. 113(9):1196-1204. • Morrison Laboratories. 2006. Meniscus Madness. Available:Morrison Laboratories. 2006. Meniscus Madness. Available: http://www.morrisonlabs.com/meniscus.htmhttp://www.morrisonlabs.com/meniscus.htm [accessed 25 August 2006].[accessed 25 August 2006]. SOURCESSOURCES