Downloaded 2,302 times
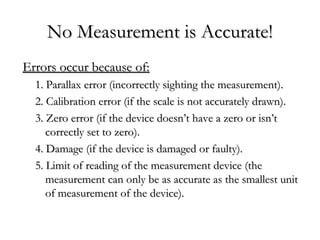
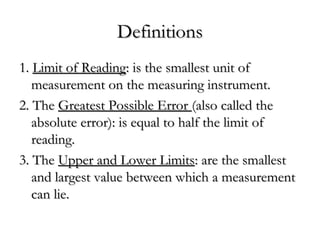
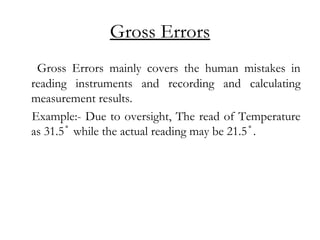
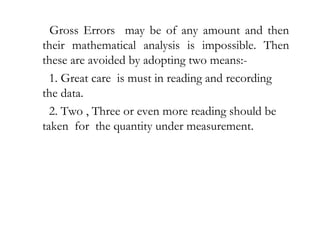
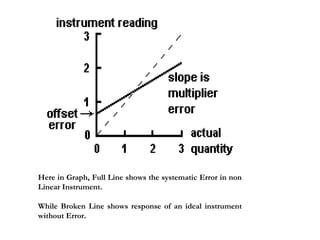
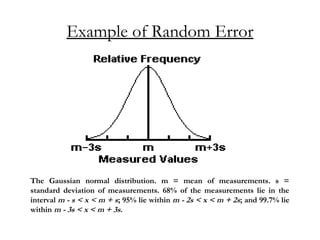
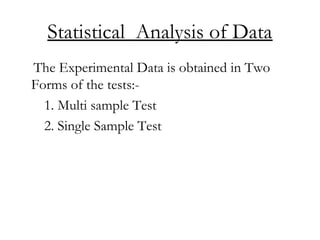

The document discusses different types of errors that can occur in measurement. It describes gross errors, systematic errors like instrumental errors and environmental errors, and random errors. It also defines key terms used to analyze errors like limit of reading, greatest possible error, and discusses analyzing measurement data using statistical methods like the mean, standard deviation, variance and histograms. Measurement errors can occur due to issues like parallax, calibration, limits of the measuring device, and are analyzed statistically.