This document discusses measurement accuracy and precision in engineering. It introduces key concepts such as:
- Accuracy refers to how close a measurement is to the true value, while precision refers to the consistency of repeated measurements.
- Sources of error in measurements include personal errors, instrument errors, and natural errors.
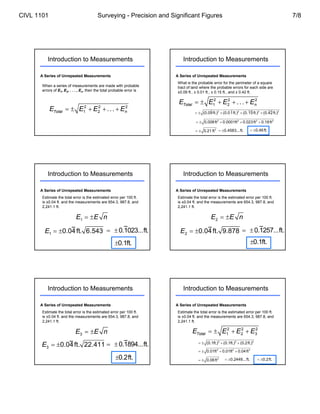
- Significant figures indicate the precision of measurements based on the reliability of each digit. Calculations must be rounded according to the least precise measurement.
- Repeated measurements of the same quantity reduce random errors, following the law of error compensation. Estimating total error involves taking the square root of the number of measurements.


![1.4 Working with Measurements [Compatibility Mode].pdf](https://cdn.slidesharecdn.com/ss_thumbnails/1-250903103143-8ae807fa-thumbnail.jpg?width=640&height=640&fit=bounds)


