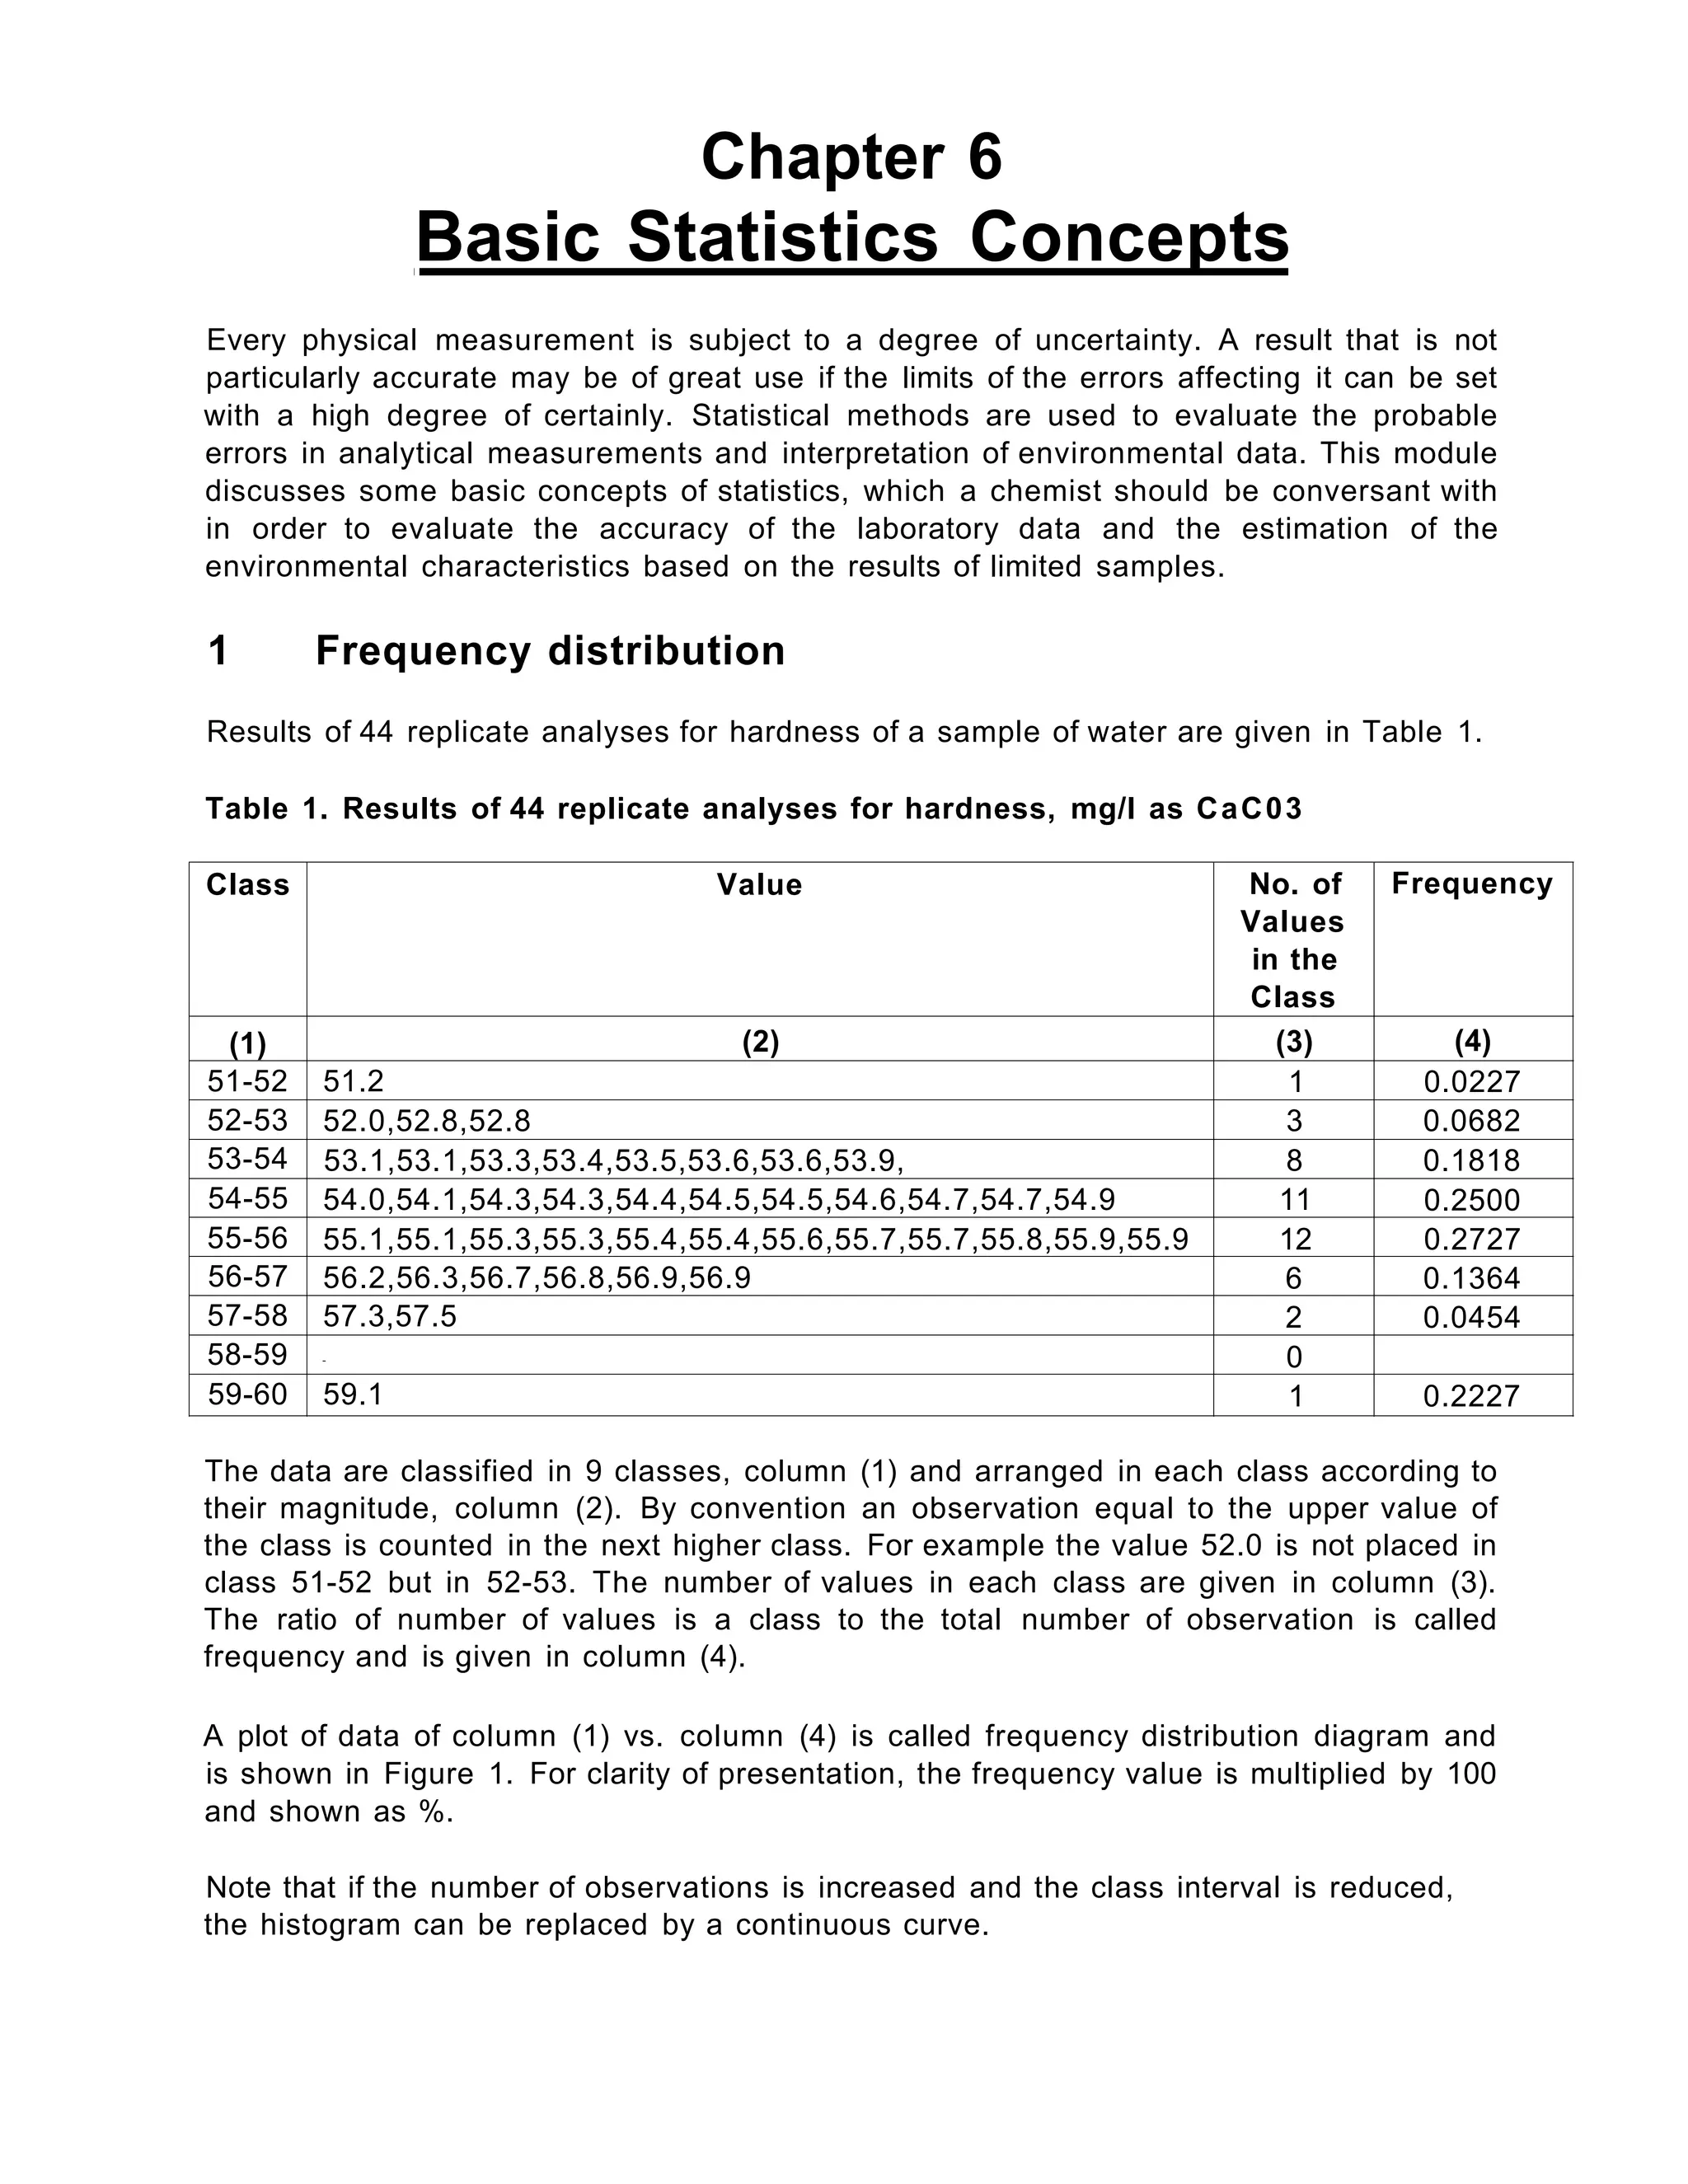
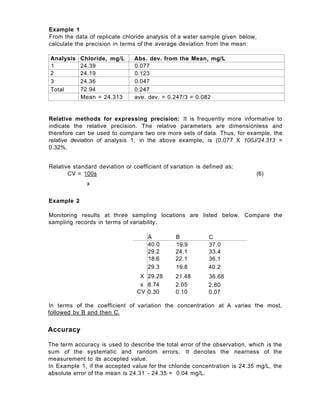
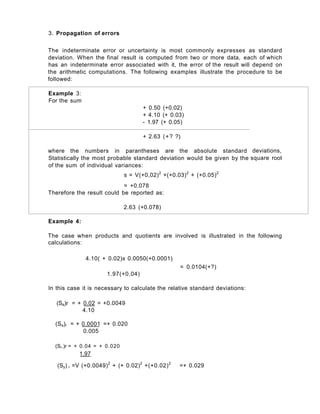
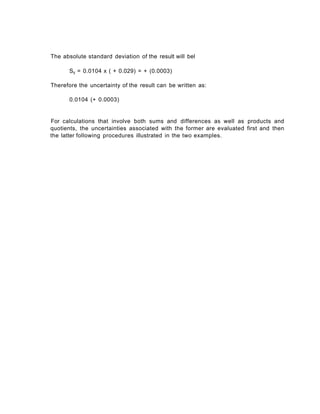
SlideShare a Scribd company logo
1 of 7
Download to read offline
Chapter 6
Basic Statistics Concepts
Every physical measurement is subject to a degree of uncertainty. A result that is not
particularly accurate may be of great use if the limits of the errors affecting it can be set
with a high degree of certainly. Statistical methods are used to evaluate the probable
errors in analytical measurements and interpretation of environmental data. This module
discusses some basic concepts of statistics, which a chemist should be conversant with
in order to evaluate the accuracy of the laboratory data and the estimation of the
environmental characteristics based on the results of limited samples.
1 Frequency distribution
Results of 44 replicate analyses for hardness of a sample of water are given in Table 1.
Table 1. Results of 44 replicate analyses for hardness, mg/l as CaC03
Class Value No. of
Values
in the
Class
Frequency
(1) (2) (3) (4)
51-52 51.2 1 0.0227
52-53 52.0,52.8,52.8 3 0.0682
53-54 53.1,53.1,53.3,53.4,53.5,53.6,53.6,53.9, 8 0.1818
54-55 54.0,54.1,54.3,54.3,54.4,54.5,54.5,54.6,54.7,54.7,54.9 11 0.2500
55-56 55.1,55.1,55.3,55.3,55.4,55.4,55.6,55.7,55.7,55.8,55.9,55.9 12 0.2727
56-57 56.2,56.3,56.7,56.8,56.9,56.9 6 0.1364
57-58 57.3,57.5 2 0.0454
58-59 - 0
59-60 59.1 1 0.2227
The data are classified in 9 classes, column (1) and arranged in each class according to
their magnitude, column (2). By convention an observation equal to the upper value of
the class is counted in the next higher class. For example the value 52.0 is not placed in
class 51-52 but in 52-53. The number of values in each class are given in column (3).
The ratio of number of values is a class to the total number of observation is called
frequency and is given in column (4).
A plot of data of column (1) vs. column (4) is called frequency distribution diagram and
is shown in Figure 1. For clarity of presentation, the frequency value is multiplied by 100
and shown as %.
Note that if the number of observations is increased and the class interval is reduced,
the histogram can be replaced by a continuous curve.
Figurel: Example of a frequency distribution diagram
<m m m. ss -sr BB ®o
Central Tendency
Arithmetic mean: The arithmetic mean, X, of a set of data is calculated by adding all the
observed values of variable (results of analyses) and dividing it by the total number of
observations:
X = ( X 1 + X 2 + Xn)/n (1)
where Xi, X2,... Xn are the observed values and n is the total number of observations.
The arithmetic mean is the most common measure of the central tendency. The mean
value of the data of Table 1 was calculated as 54.9
Geometric mean: When there are a few very high values or very low, such as in the
cases of bacteriological analysis, the arithmetic mean is not necessarily representative
of the central tendency. In such cases the geometric mean, g, is used:
g=Xi x X 2 x X 3 •Xn)
1/n
(2)
Median: The median is the middle value of the set of data. If the sample size n is an
odd number, one-half of the values exceed the median and one-half are less. When n is
even, it is average of the two middle terms. For the data of Table 1, it is 54.8, which is
the average of 54.7 and 54.9, the 22nd and the 23rd terms, when the data are arranged
in ascending order.
Mode: The mode is the most commonly occurring value. It is not widely employed as it
forms a poor basis for any further arithmetic calculations.
Standard deviation
The data of Table 1 show that 52% of observations lie in the range of 54 - 56 and 84%
in the range of 53-57. This tendency of observations to cluster (or not to cluster) around
the mean value, 54.9, is measured by standard deviation, s. Standard deviation is
calculated as:
s=V{X1 -X)2
+ (X2 - X)2
+ (Xn - X)2
}/(n - 1 )s=
or s = VsXi2
- (EXi)2
/N (3)
N
A small value of s signifies that most of the observations are close to the mean value. A
large value indicates that the observed values are spread over a larger range. For
example, if the data of Table 1 has more observations in 52-53 and 57-58 classes and
correspondingly lesser number in the central classes 54-55 and 55-56, the frequency
distribution diagram will be flatter and spread wider at the base and the value of s will be
larger.
The standard deviation has the same units as the quantity measured. The standard
deviation for the data of Table 1 was calculated as 1.545 mg/L.
The square of the standard deviation is called the variance. If the random distribution of
data is due to r different reasons, the total variance is the sum of individual variance.
Normal Distribution
Most frequency distributions for random observations, when the total number of
observations is very large tending to be the same as the population, N, conform to
normal distribution. The distribution is give by the theoretical equation:
where y = frequency of observations /1 = the mean, and cr = standard deviation. Note
the distinction made in the notations for number of observations, mean and standard
deviation for a sample of a limited set of data used earlier.
The standard deviation is given by:
N
For a normal distribution, 68.3 % of the total observations lie in the range jj, +g, 95.5% in
the range i ±2c and 99.7% in the range ju +3a. This is illustrated in Figure 2.
The number of observations between any two limits of the variable can be equated to
the area bounded by the frequency distribution curve, the ordinates at these limits and
the x axis. .
When the data set is small, more often than not, sample mean, X will differ somewhat
from the population mean, Any error in X causes a corresponding error in the
standard deviation calculated with Equation 5. There is a tendency for the standard
deviation value calculated to be small as the number of measurements becomes
smaller. It can be shown that this bias can be largely eliminated by substituting the
degree of freedom as (n-1) in the calculation, Equation (3), which defines the standard
(xi -ji)21 2o2
y = (4)
cW2n
(5)
deviation for a limited set of measurements.
The rationale for using (n-1) is as follows. When jj, is not known, we nnust extract two
quantities, namely, X and s from the set of data. The need to establish X from the data
removes one degree of freedom: that is if their signs are retained, the sum of individual
deviations must total zero; once (n-1) deviations have been established, the final
deviation is necessarily known. Thus only (n-1) deviations provide independent
measures for the standard deviation of the set.
2 Precision and Accuracy of Experimental Data
Classes of errors
The phenomena that are responsible for uncertainties in an analytical measurement can
be divided in two broad categories: determinate or system errors and indeterminate or
random errors. The total error is the sum of the two types of errors.
Determinate errors have assignable causes and are unidirectional. It may be possible to
eliminate some of these, for example, errors because of improper calibration of the
equipment, or presence of interfering substances in the sample. Errors inherent in the
method, such as addition of a reagent in excess of theoretical requirement to cause an
indicator to undergo colour change in a titration, may be difficult to eliminate.
Indeterminate errors are encountered whenever a measuring system is extended to its
maximum sensitivity. The results fluctuate in a random manner about a mean value.
The sources of these fluctuations can never be identified because they are made up of
a myriad of instrumental, personal and method uncertainties that are individually so
small that they can never be detected. For example, in he case of addition of an exact
volume of reagent in an analysis through a pipette the uncertainties could be the time
allowed for draining the pipette, the angle at which the pipette is held during delivery,
temperature of the reagent, visual judgement of water level with respect to the
graduation mark, etc. What is observed in the final result is then a summation of a very
large number of minute unobservable uncertainties. The cumulative effect is likewise
variable. Ordinarily they tend to cancel one other and thus exert a minimal effect.
Occasionally, however, they act in concert to produce a relatively large positive or
negative error.
Precision
The term precision is employed to describe the reproducibility of results. It can be
defined as the agreement between the numerical values of two or more measurements
that have been made in an identical fashion.
Absolute methods for expressing precision: The absolute average deviation from
the mean is a common method for describing precision. The spread or range of a set of
data is also a measure of precision and is simply the numerical difference of the highest
and the lowest result. Standard deviation, described earlier, is a more significant
measure of precision.
Example 1
From the data of replicate chloride analysis of a water sample given below,
calculate the precision in terms of the average deviation from the mean:
Analysis Chloride, mg/L Abs. dev. from the Mean, mg/L
1 24.39 0.077
2 24.19 0.123
3 24.36 0.047
Total 72.94 0.247
Mean = 24.313 ave. dev. = 0.247/3 = 0.082
Relative methods for expressing precision: It is frequently more informative to
indicate the relative precision. The relative parameters are dimensionless and
therefore can be used to compare two ore more sets of data. Thus, for example, the
relative deviation of analysis 1, in the above example, is (0.077 X 100J/24.313 =
0.32%.
Relative standard deviation or coefficient of variation is defined as:
CV = 100s (6)
x
Example 2
Monitoring results at three sampling locations are listed below. Compare the
sampling records in terms of variability.
A B C
40.0 19.9 37.0
29.2 24.1 33.4
18.6 22.1 36.1
29.3 19.8 40.2
X 29.28 21.48 36.68
s 8.74 2.05 2.80
CV 0.30 0.10 0.07
In terms of the coefficient of variation the concentration at A varies the most,
followed by B and then C.
Accuracy
The term accuracy is used to describe the total error of the observation, which is the
sum of the systematic and random errors. It denotes the nearness of the
measurement to its accepted value.
In Example 1, if the accepted value for the chloride concentration is 24.35 mg/L, the
absolute error of the mean is 24.31 - 24.35 = 0.04 mg/L.
3. Propagation of errors
The indeterminate error or uncertainty is most commonly expresses as standard
deviation. When the final result is computed from two or more data, each of which
has an indeterminate error associated with it, the error of the result will depend on
the arithmetic computations. The following examples illustrate the procedure to be
followed:
Example 3:
For the sum
+ 0.50 (+0.02)
+ 4.10 (+ 0.03)
- 1.97 (+ 0.05)
+ 2.63 (+? ?)
where the numbers in parantheses are the absolute standard
Statistically the most probable standard deviation would be given by the
of the sum of individual variances:
s = V(+0,02)2
+(+0.03)2
+ (+0.05)2
deviations,
square root
= +0.078
Therefore the result could be reported as:
2.63 (+0.078)
Example 4:
The case when products and quotients are involved is illustrated in the following
calculations:
4.10( + 0.02)x 0.0050(+0.0001)
= 0.0104(+?)
1.97(+0.04)
In this case it is necessary to calculate the relative standard deviations:
(Sa)r = + 0.02 = +0.0049
4.10
(Sa)r = + 0.0001 =+ 0.020
0.005
(Sr.)r = + 0.04 = + 0.020
1.97
(Sy) r =V (+0.0049)2
+ (+ 0.02)2
+(+0.02)2
=+ 0.029
The absolute standard deviation of the result will bel
Sy = 0.0104 x ( + 0.029) = + (0.0003)
Therefore the uncertainty of the result can be written as:
0.0104 (+ 0.0003)
For calculations that involve both sums and differences as well as products and
quotients, the uncertainties associated with the former are evaluated first and then
the latter following procedures illustrated in the two examples.

More Related Content

What's hot

Normal distribution
Normal distributionNormal distribution
Normal distributionGlobal Polis
 
Statistics
StatisticsStatistics
Statisticsitutor
 
Z score presnetation
Z score presnetationZ score presnetation
Z score presnetationCarlo Magno
 
Decimals, fractions, and percents
Decimals, fractions, and percentsDecimals, fractions, and percents
Decimals, fractions, and percentsjoannahstevens
 
Standard Deviation
Standard DeviationStandard Deviation
Standard Deviationpwheeles
 
2.1 frequency distributions for organizing and summarizing data
2.1 frequency distributions for organizing and summarizing data2.1 frequency distributions for organizing and summarizing data
2.1 frequency distributions for organizing and summarizing dataLong Beach City College
 
Theory of estimation
Theory of estimationTheory of estimation
Theory of estimationTech_MX
 
Descriptive statistics
Descriptive statisticsDescriptive statistics
Descriptive statisticsAttaullah Khan
 
SCOPE, IMPORTANCE & USES OF STATISTICS
SCOPE, IMPORTANCE & USES OF STATISTICS      SCOPE, IMPORTANCE & USES OF STATISTICS
SCOPE, IMPORTANCE & USES OF STATISTICS Muhammad Yousaf
 
3.1 measures of central tendency
3.1 measures of central tendency3.1 measures of central tendency
3.1 measures of central tendencyleblance
 
Estimation in statistics
Estimation in statisticsEstimation in statistics
Estimation in statisticsRabea Jamal
 
Probability and Samples: The Distribution of Sample Means
Probability and Samples: The Distribution of Sample MeansProbability and Samples: The Distribution of Sample Means
Probability and Samples: The Distribution of Sample Meansjasondroesch
 

What's hot (20)

Estimation
EstimationEstimation
Estimation
 
Sampling techniques
Sampling techniquesSampling techniques
Sampling techniques
 
Chap07 interval estimation
Chap07 interval estimationChap07 interval estimation
Chap07 interval estimation
 
normal distribution
normal distributionnormal distribution
normal distribution
 
TEST OF HYPOTHESIS
TEST OF HYPOTHESISTEST OF HYPOTHESIS
TEST OF HYPOTHESIS
 
Normal distribution
Normal distributionNormal distribution
Normal distribution
 
Statistics
StatisticsStatistics
Statistics
 
Z score presnetation
Z score presnetationZ score presnetation
Z score presnetation
 
Decimals, fractions, and percents
Decimals, fractions, and percentsDecimals, fractions, and percents
Decimals, fractions, and percents
 
Standard Deviation
Standard DeviationStandard Deviation
Standard Deviation
 
2.1 frequency distributions for organizing and summarizing data
2.1 frequency distributions for organizing and summarizing data2.1 frequency distributions for organizing and summarizing data
2.1 frequency distributions for organizing and summarizing data
 
Rejection Region.ppt.ppt
Rejection Region.ppt.pptRejection Region.ppt.ppt
Rejection Region.ppt.ppt
 
Theory of estimation
Theory of estimationTheory of estimation
Theory of estimation
 
Descriptive statistics
Descriptive statisticsDescriptive statistics
Descriptive statistics
 
SCOPE, IMPORTANCE & USES OF STATISTICS
SCOPE, IMPORTANCE & USES OF STATISTICS      SCOPE, IMPORTANCE & USES OF STATISTICS
SCOPE, IMPORTANCE & USES OF STATISTICS
 
Estimating a Population Mean
Estimating a Population MeanEstimating a Population Mean
Estimating a Population Mean
 
3.1 measures of central tendency
3.1 measures of central tendency3.1 measures of central tendency
3.1 measures of central tendency
 
Estimation in statistics
Estimation in statisticsEstimation in statistics
Estimation in statistics
 
Practice Test 2 Solutions
Practice Test 2  SolutionsPractice Test 2  Solutions
Practice Test 2 Solutions
 
Probability and Samples: The Distribution of Sample Means
Probability and Samples: The Distribution of Sample MeansProbability and Samples: The Distribution of Sample Means
Probability and Samples: The Distribution of Sample Means
 

Similar to Basic statistics concepts

Chapter 4(1).pptx
Chapter 4(1).pptxChapter 4(1).pptx
Chapter 4(1).pptxmahamoh6
 
Measures of Dispersion
Measures of DispersionMeasures of Dispersion
Measures of DispersionKainatIqbal7
 
Statistical techniques used in measurement
Statistical techniques used in measurementStatistical techniques used in measurement
Statistical techniques used in measurementShivamKhajuria3
 
Application of Statistical and mathematical equations in Chemistry Part 2
Application of Statistical and mathematical equations in Chemistry Part 2Application of Statistical and mathematical equations in Chemistry Part 2
Application of Statistical and mathematical equations in Chemistry Part 2Awad Albalwi
 
Presentation1group b
Presentation1group bPresentation1group b
Presentation1group bAbhishekDas15
 
METHOD OF DISPERSION to upload.pptx
METHOD OF DISPERSION to upload.pptxMETHOD OF DISPERSION to upload.pptx
METHOD OF DISPERSION to upload.pptxSreeLatha98
 
Basics of biostatistic
Basics of biostatisticBasics of biostatistic
Basics of biostatisticNeurologyKota
 
statistics-for-analytical-chemistry (1).ppt
statistics-for-analytical-chemistry (1).pptstatistics-for-analytical-chemistry (1).ppt
statistics-for-analytical-chemistry (1).pptHalilIbrahimUlusoy
 
1 lab basicstatisticsfall2013
1 lab basicstatisticsfall20131 lab basicstatisticsfall2013
1 lab basicstatisticsfall2013TAMUK
 
Quantitative Analysis for Emperical Research
Quantitative Analysis for Emperical ResearchQuantitative Analysis for Emperical Research
Quantitative Analysis for Emperical ResearchAmit Kamble
 
Overview of Advance Marketing Research
Overview of Advance Marketing ResearchOverview of Advance Marketing Research
Overview of Advance Marketing ResearchEnamul Islam
 
Errors in Chemical Analysis and Sampling
Errors in Chemical Analysis and SamplingErrors in Chemical Analysis and Sampling
Errors in Chemical Analysis and SamplingUmer Ali
 
Measures of Dispersion.pptx
Measures of Dispersion.pptxMeasures of Dispersion.pptx
Measures of Dispersion.pptxVanmala Buchke
 

Similar to Basic statistics concepts (20)

Chapter 4(1).pptx
Chapter 4(1).pptxChapter 4(1).pptx
Chapter 4(1).pptx
 
9618821.pdf
9618821.pdf9618821.pdf
9618821.pdf
 
9618821.ppt
9618821.ppt9618821.ppt
9618821.ppt
 
Measures of Dispersion
Measures of DispersionMeasures of Dispersion
Measures of Dispersion
 
lecture-2.ppt
lecture-2.pptlecture-2.ppt
lecture-2.ppt
 
Statistical techniques used in measurement
Statistical techniques used in measurementStatistical techniques used in measurement
Statistical techniques used in measurement
 
Application of Statistical and mathematical equations in Chemistry Part 2
Application of Statistical and mathematical equations in Chemistry Part 2Application of Statistical and mathematical equations in Chemistry Part 2
Application of Statistical and mathematical equations in Chemistry Part 2
 
Presentation1group b
Presentation1group bPresentation1group b
Presentation1group b
 
Measures of Variation
Measures of Variation Measures of Variation
Measures of Variation
 
METHOD OF DISPERSION to upload.pptx
METHOD OF DISPERSION to upload.pptxMETHOD OF DISPERSION to upload.pptx
METHOD OF DISPERSION to upload.pptx
 
Basics of biostatistic
Basics of biostatisticBasics of biostatistic
Basics of biostatistic
 
Errors2
Errors2Errors2
Errors2
 
statistics-for-analytical-chemistry (1).ppt
statistics-for-analytical-chemistry (1).pptstatistics-for-analytical-chemistry (1).ppt
statistics-for-analytical-chemistry (1).ppt
 
Statistics
StatisticsStatistics
Statistics
 
1 lab basicstatisticsfall2013
1 lab basicstatisticsfall20131 lab basicstatisticsfall2013
1 lab basicstatisticsfall2013
 
Quantitative Analysis for Emperical Research
Quantitative Analysis for Emperical ResearchQuantitative Analysis for Emperical Research
Quantitative Analysis for Emperical Research
 
Overview of Advance Marketing Research
Overview of Advance Marketing ResearchOverview of Advance Marketing Research
Overview of Advance Marketing Research
 
Errors in Chemical Analysis and Sampling
Errors in Chemical Analysis and SamplingErrors in Chemical Analysis and Sampling
Errors in Chemical Analysis and Sampling
 
Measures of Dispersion.pptx
Measures of Dispersion.pptxMeasures of Dispersion.pptx
Measures of Dispersion.pptx
 
1.1 STATISTICS
1.1 STATISTICS1.1 STATISTICS
1.1 STATISTICS
 

More from ECRD2015

Pollution control in small and medium scale industry
Pollution control in small and medium scale industryPollution control in small and medium scale industry
Pollution control in small and medium scale industryECRD2015
 
Indoor air quality
Indoor air qualityIndoor air quality
Indoor air qualityECRD2015
 
Air pollution control
Air pollution controlAir pollution control
Air pollution controlECRD2015
 
Vehicular Pollution Management
Vehicular Pollution ManagementVehicular Pollution Management
Vehicular Pollution ManagementECRD2015
 
Strategy of control of urban air pollution
Strategy of control of urban air pollutionStrategy of control of urban air pollution
Strategy of control of urban air pollutionECRD2015
 
Spectrophotometer meter
Spectrophotometer meterSpectrophotometer meter
Spectrophotometer meterECRD2015
 
Some critical facets in air pollution
Some critical facets in air pollutionSome critical facets in air pollution
Some critical facets in air pollutionECRD2015
 
Shop floor monitoring
Shop floor monitoringShop floor monitoring
Shop floor monitoringECRD2015
 
Quality assurance and quality control
Quality assurance and quality controlQuality assurance and quality control
Quality assurance and quality controlECRD2015
 
Preventive measures for occupational
Preventive measures for occupationalPreventive measures for occupational
Preventive measures for occupationalECRD2015
 
Pm10 measmnt
Pm10 measmntPm10 measmnt
Pm10 measmntECRD2015
 
Nitrogen oxide monitoring
Nitrogen oxide monitoringNitrogen oxide monitoring
Nitrogen oxide monitoringECRD2015
 
Monitoring of inorganic ions
Monitoring of inorganic ionsMonitoring of inorganic ions
Monitoring of inorganic ionsECRD2015
 
Minutes of brain storming session on air pollution load carrying capacity of ...
Minutes of brain storming session on air pollution load carrying capacity of ...Minutes of brain storming session on air pollution load carrying capacity of ...
Minutes of brain storming session on air pollution load carrying capacity of ...ECRD2015
 
Measurement of respirable suspended pm10
Measurement of respirable suspended pm10Measurement of respirable suspended pm10
Measurement of respirable suspended pm10ECRD2015
 
Measurement of hydrogen ion concentration (p h)
Measurement of hydrogen ion concentration (p h)Measurement of hydrogen ion concentration (p h)
Measurement of hydrogen ion concentration (p h)ECRD2015
 
Maintenance
MaintenanceMaintenance
MaintenanceECRD2015
 
Maintenance of high volume
Maintenance of high volumeMaintenance of high volume
Maintenance of high volumeECRD2015
 

More from ECRD2015 (20)

Pollution control in small and medium scale industry
Pollution control in small and medium scale industryPollution control in small and medium scale industry
Pollution control in small and medium scale industry
 
Indoor air quality
Indoor air qualityIndoor air quality
Indoor air quality
 
Air pollution control
Air pollution controlAir pollution control
Air pollution control
 
Vehicular Pollution Management
Vehicular Pollution ManagementVehicular Pollution Management
Vehicular Pollution Management
 
Strategy of control of urban air pollution
Strategy of control of urban air pollutionStrategy of control of urban air pollution
Strategy of control of urban air pollution
 
Spectrophotometer meter
Spectrophotometer meterSpectrophotometer meter
Spectrophotometer meter
 
Some critical facets in air pollution
Some critical facets in air pollutionSome critical facets in air pollution
Some critical facets in air pollution
 
Slm_1
Slm_1Slm_1
Slm_1
 
Shop floor monitoring
Shop floor monitoringShop floor monitoring
Shop floor monitoring
 
Quality assurance and quality control
Quality assurance and quality controlQuality assurance and quality control
Quality assurance and quality control
 
Preventive measures for occupational
Preventive measures for occupationalPreventive measures for occupational
Preventive measures for occupational
 
Pm10 measmnt
Pm10 measmntPm10 measmnt
Pm10 measmnt
 
Ozone
OzoneOzone
Ozone
 
Nitrogen oxide monitoring
Nitrogen oxide monitoringNitrogen oxide monitoring
Nitrogen oxide monitoring
 
Monitoring of inorganic ions
Monitoring of inorganic ionsMonitoring of inorganic ions
Monitoring of inorganic ions
 
Minutes of brain storming session on air pollution load carrying capacity of ...
Minutes of brain storming session on air pollution load carrying capacity of ...Minutes of brain storming session on air pollution load carrying capacity of ...
Minutes of brain storming session on air pollution load carrying capacity of ...
 
Measurement of respirable suspended pm10
Measurement of respirable suspended pm10Measurement of respirable suspended pm10
Measurement of respirable suspended pm10
 
Measurement of hydrogen ion concentration (p h)
Measurement of hydrogen ion concentration (p h)Measurement of hydrogen ion concentration (p h)
Measurement of hydrogen ion concentration (p h)
 
Maintenance
MaintenanceMaintenance
Maintenance
 
Maintenance of high volume
Maintenance of high volumeMaintenance of high volume
Maintenance of high volume
 

Recently uploaded

See How do animals kill their prey for food
See How do animals kill their prey for foodSee How do animals kill their prey for food
See How do animals kill their prey for fooddrsk203
 
ENVIRONMENTAL LAW ppt on laws of environmental law
ENVIRONMENTAL LAW ppt on laws of environmental lawENVIRONMENTAL LAW ppt on laws of environmental law
ENVIRONMENTAL LAW ppt on laws of environmental lawnitinraj1000000
 
Soil pollution causes effects remedial measures
Soil pollution causes effects remedial measuresSoil pollution causes effects remedial measures
Soil pollution causes effects remedial measuresvasubhanot1234
 
Spiders by Slidesgo - an introduction to arachnids
Spiders by Slidesgo - an introduction to arachnidsSpiders by Slidesgo - an introduction to arachnids
Spiders by Slidesgo - an introduction to arachnidsprasan26
 
webinaire-green-mirror-episode-2-Smart contracts and virtual purchase agreeme...
webinaire-green-mirror-episode-2-Smart contracts and virtual purchase agreeme...webinaire-green-mirror-episode-2-Smart contracts and virtual purchase agreeme...
webinaire-green-mirror-episode-2-Smart contracts and virtual purchase agreeme...Cluster TWEED
 
VIP Call Girls Service Bandlaguda Hyderabad Call +91-8250192130
VIP Call Girls Service Bandlaguda Hyderabad Call +91-8250192130VIP Call Girls Service Bandlaguda Hyderabad Call +91-8250192130
VIP Call Girls Service Bandlaguda Hyderabad Call +91-8250192130Suhani Kapoor
 
Philippines-Native-Chicken.pptx file copy
Philippines-Native-Chicken.pptx file copyPhilippines-Native-Chicken.pptx file copy
Philippines-Native-Chicken.pptx file copyKristineRoseCorrales
 
Species composition, diversity and community structure of mangroves in Barang...
Species composition, diversity and community structure of mangroves in Barang...Species composition, diversity and community structure of mangroves in Barang...
Species composition, diversity and community structure of mangroves in Barang...Open Access Research Paper
 
办理(Victoria毕业证书)维多利亚大学毕业证成绩单原版一比一
办理(Victoria毕业证书)维多利亚大学毕业证成绩单原版一比一办理(Victoria毕业证书)维多利亚大学毕业证成绩单原版一比一
办理(Victoria毕业证书)维多利亚大学毕业证成绩单原版一比一z xss
 
Air pollution soli pollution water pollution noise pollution land pollution
Air pollution soli pollution water pollution noise pollution land pollutionAir pollution soli pollution water pollution noise pollution land pollution
Air pollution soli pollution water pollution noise pollution land pollutionrgxv72jrgc
 
VIP Kolkata Call Girl Kalighat 👉 8250192130 Available With Room
VIP Kolkata Call Girl Kalighat 👉 8250192130  Available With RoomVIP Kolkata Call Girl Kalighat 👉 8250192130  Available With Room
VIP Kolkata Call Girl Kalighat 👉 8250192130 Available With Roomdivyansh0kumar0
 
Abu Dhabi Sea Beach Visitor Community pp
Abu Dhabi Sea Beach Visitor Community ppAbu Dhabi Sea Beach Visitor Community pp
Abu Dhabi Sea Beach Visitor Community pp202215407
 
Along the Lakefront, "Menacing Unknown"s
Along the Lakefront, "Menacing Unknown"sAlong the Lakefront, "Menacing Unknown"s
Along the Lakefront, "Menacing Unknown"syalehistoricalreview
 

Recently uploaded (20)

See How do animals kill their prey for food
See How do animals kill their prey for foodSee How do animals kill their prey for food
See How do animals kill their prey for food
 
ENVIRONMENTAL LAW ppt on laws of environmental law
ENVIRONMENTAL LAW ppt on laws of environmental lawENVIRONMENTAL LAW ppt on laws of environmental law
ENVIRONMENTAL LAW ppt on laws of environmental law
 
Soil pollution causes effects remedial measures
Soil pollution causes effects remedial measuresSoil pollution causes effects remedial measures
Soil pollution causes effects remedial measures
 
Spiders by Slidesgo - an introduction to arachnids
Spiders by Slidesgo - an introduction to arachnidsSpiders by Slidesgo - an introduction to arachnids
Spiders by Slidesgo - an introduction to arachnids
 
webinaire-green-mirror-episode-2-Smart contracts and virtual purchase agreeme...
webinaire-green-mirror-episode-2-Smart contracts and virtual purchase agreeme...webinaire-green-mirror-episode-2-Smart contracts and virtual purchase agreeme...
webinaire-green-mirror-episode-2-Smart contracts and virtual purchase agreeme...
 
VIP Call Girls Service Bandlaguda Hyderabad Call +91-8250192130
VIP Call Girls Service Bandlaguda Hyderabad Call +91-8250192130VIP Call Girls Service Bandlaguda Hyderabad Call +91-8250192130
VIP Call Girls Service Bandlaguda Hyderabad Call +91-8250192130
 
Philippines-Native-Chicken.pptx file copy
Philippines-Native-Chicken.pptx file copyPhilippines-Native-Chicken.pptx file copy
Philippines-Native-Chicken.pptx file copy
 
Call Girls In R.K. Puram 9953056974 Escorts ServiCe In Delhi Ncr
Call Girls In R.K. Puram 9953056974 Escorts ServiCe In Delhi NcrCall Girls In R.K. Puram 9953056974 Escorts ServiCe In Delhi Ncr
Call Girls In R.K. Puram 9953056974 Escorts ServiCe In Delhi Ncr
 
Species composition, diversity and community structure of mangroves in Barang...
Species composition, diversity and community structure of mangroves in Barang...Species composition, diversity and community structure of mangroves in Barang...
Species composition, diversity and community structure of mangroves in Barang...
 
办理(Victoria毕业证书)维多利亚大学毕业证成绩单原版一比一
办理(Victoria毕业证书)维多利亚大学毕业证成绩单原版一比一办理(Victoria毕业证书)维多利亚大学毕业证成绩单原版一比一
办理(Victoria毕业证书)维多利亚大学毕业证成绩单原版一比一
 
Escort Service Call Girls In Shakti Nagar, 99530°56974 Delhi NCR
Escort Service Call Girls In Shakti Nagar, 99530°56974 Delhi NCREscort Service Call Girls In Shakti Nagar, 99530°56974 Delhi NCR
Escort Service Call Girls In Shakti Nagar, 99530°56974 Delhi NCR
 
Model Call Girl in Rajiv Chowk Delhi reach out to us at 🔝9953056974🔝
Model Call Girl in Rajiv Chowk Delhi reach out to us at 🔝9953056974🔝Model Call Girl in Rajiv Chowk Delhi reach out to us at 🔝9953056974🔝
Model Call Girl in Rajiv Chowk Delhi reach out to us at 🔝9953056974🔝
 
Gandhi Nagar (Delhi) 9953330565 Escorts, Call Girls Services
Gandhi Nagar (Delhi) 9953330565 Escorts, Call Girls ServicesGandhi Nagar (Delhi) 9953330565 Escorts, Call Girls Services
Gandhi Nagar (Delhi) 9953330565 Escorts, Call Girls Services
 
Hot Sexy call girls in Nehru Place, 🔝 9953056974 🔝 escort Service
Hot Sexy call girls in Nehru Place, 🔝 9953056974 🔝 escort ServiceHot Sexy call girls in Nehru Place, 🔝 9953056974 🔝 escort Service
Hot Sexy call girls in Nehru Place, 🔝 9953056974 🔝 escort Service
 
Air pollution soli pollution water pollution noise pollution land pollution
Air pollution soli pollution water pollution noise pollution land pollutionAir pollution soli pollution water pollution noise pollution land pollution
Air pollution soli pollution water pollution noise pollution land pollution
 
Sexy Call Girls Patel Nagar New Delhi +918448380779 Call Girls Service in Del...
Sexy Call Girls Patel Nagar New Delhi +918448380779 Call Girls Service in Del...Sexy Call Girls Patel Nagar New Delhi +918448380779 Call Girls Service in Del...
Sexy Call Girls Patel Nagar New Delhi +918448380779 Call Girls Service in Del...
 
VIP Kolkata Call Girl Kalighat 👉 8250192130 Available With Room
VIP Kolkata Call Girl Kalighat 👉 8250192130  Available With RoomVIP Kolkata Call Girl Kalighat 👉 8250192130  Available With Room
VIP Kolkata Call Girl Kalighat 👉 8250192130 Available With Room
 
E-Waste Management
E-Waste ManagementE-Waste Management
E-Waste Management
 
Abu Dhabi Sea Beach Visitor Community pp
Abu Dhabi Sea Beach Visitor Community ppAbu Dhabi Sea Beach Visitor Community pp
Abu Dhabi Sea Beach Visitor Community pp
 
Along the Lakefront, "Menacing Unknown"s
Along the Lakefront, "Menacing Unknown"sAlong the Lakefront, "Menacing Unknown"s
Along the Lakefront, "Menacing Unknown"s
 

Basic statistics concepts

  • 1. Chapter 6 Basic Statistics Concepts Every physical measurement is subject to a degree of uncertainty. A result that is not particularly accurate may be of great use if the limits of the errors affecting it can be set with a high degree of certainly. Statistical methods are used to evaluate the probable errors in analytical measurements and interpretation of environmental data. This module discusses some basic concepts of statistics, which a chemist should be conversant with in order to evaluate the accuracy of the laboratory data and the estimation of the environmental characteristics based on the results of limited samples. 1 Frequency distribution Results of 44 replicate analyses for hardness of a sample of water are given in Table 1. Table 1. Results of 44 replicate analyses for hardness, mg/l as CaC03 Class Value No. of Values in the Class Frequency (1) (2) (3) (4) 51-52 51.2 1 0.0227 52-53 52.0,52.8,52.8 3 0.0682 53-54 53.1,53.1,53.3,53.4,53.5,53.6,53.6,53.9, 8 0.1818 54-55 54.0,54.1,54.3,54.3,54.4,54.5,54.5,54.6,54.7,54.7,54.9 11 0.2500 55-56 55.1,55.1,55.3,55.3,55.4,55.4,55.6,55.7,55.7,55.8,55.9,55.9 12 0.2727 56-57 56.2,56.3,56.7,56.8,56.9,56.9 6 0.1364 57-58 57.3,57.5 2 0.0454 58-59 - 0 59-60 59.1 1 0.2227 The data are classified in 9 classes, column (1) and arranged in each class according to their magnitude, column (2). By convention an observation equal to the upper value of the class is counted in the next higher class. For example the value 52.0 is not placed in class 51-52 but in 52-53. The number of values in each class are given in column (3). The ratio of number of values is a class to the total number of observation is called frequency and is given in column (4). A plot of data of column (1) vs. column (4) is called frequency distribution diagram and is shown in Figure 1. For clarity of presentation, the frequency value is multiplied by 100 and shown as %. Note that if the number of observations is increased and the class interval is reduced, the histogram can be replaced by a continuous curve.
  • 2. Figurel: Example of a frequency distribution diagram <m m m. ss -sr BB ®o Central Tendency Arithmetic mean: The arithmetic mean, X, of a set of data is calculated by adding all the observed values of variable (results of analyses) and dividing it by the total number of observations: X = ( X 1 + X 2 + Xn)/n (1) where Xi, X2,... Xn are the observed values and n is the total number of observations. The arithmetic mean is the most common measure of the central tendency. The mean value of the data of Table 1 was calculated as 54.9 Geometric mean: When there are a few very high values or very low, such as in the cases of bacteriological analysis, the arithmetic mean is not necessarily representative of the central tendency. In such cases the geometric mean, g, is used: g=Xi x X 2 x X 3 •Xn) 1/n (2) Median: The median is the middle value of the set of data. If the sample size n is an odd number, one-half of the values exceed the median and one-half are less. When n is even, it is average of the two middle terms. For the data of Table 1, it is 54.8, which is the average of 54.7 and 54.9, the 22nd and the 23rd terms, when the data are arranged in ascending order. Mode: The mode is the most commonly occurring value. It is not widely employed as it forms a poor basis for any further arithmetic calculations. Standard deviation The data of Table 1 show that 52% of observations lie in the range of 54 - 56 and 84% in the range of 53-57. This tendency of observations to cluster (or not to cluster) around the mean value, 54.9, is measured by standard deviation, s. Standard deviation is calculated as:
  • 3. s=V{X1 -X)2 + (X2 - X)2 + (Xn - X)2 }/(n - 1 )s= or s = VsXi2 - (EXi)2 /N (3) N A small value of s signifies that most of the observations are close to the mean value. A large value indicates that the observed values are spread over a larger range. For example, if the data of Table 1 has more observations in 52-53 and 57-58 classes and correspondingly lesser number in the central classes 54-55 and 55-56, the frequency distribution diagram will be flatter and spread wider at the base and the value of s will be larger. The standard deviation has the same units as the quantity measured. The standard deviation for the data of Table 1 was calculated as 1.545 mg/L. The square of the standard deviation is called the variance. If the random distribution of data is due to r different reasons, the total variance is the sum of individual variance. Normal Distribution Most frequency distributions for random observations, when the total number of observations is very large tending to be the same as the population, N, conform to normal distribution. The distribution is give by the theoretical equation: where y = frequency of observations /1 = the mean, and cr = standard deviation. Note the distinction made in the notations for number of observations, mean and standard deviation for a sample of a limited set of data used earlier. The standard deviation is given by: N For a normal distribution, 68.3 % of the total observations lie in the range jj, +g, 95.5% in the range i ±2c and 99.7% in the range ju +3a. This is illustrated in Figure 2. The number of observations between any two limits of the variable can be equated to the area bounded by the frequency distribution curve, the ordinates at these limits and the x axis. . When the data set is small, more often than not, sample mean, X will differ somewhat from the population mean, Any error in X causes a corresponding error in the standard deviation calculated with Equation 5. There is a tendency for the standard deviation value calculated to be small as the number of measurements becomes smaller. It can be shown that this bias can be largely eliminated by substituting the degree of freedom as (n-1) in the calculation, Equation (3), which defines the standard (xi -ji)21 2o2 y = (4) cW2n (5)
  • 4. deviation for a limited set of measurements. The rationale for using (n-1) is as follows. When jj, is not known, we nnust extract two quantities, namely, X and s from the set of data. The need to establish X from the data removes one degree of freedom: that is if their signs are retained, the sum of individual deviations must total zero; once (n-1) deviations have been established, the final deviation is necessarily known. Thus only (n-1) deviations provide independent measures for the standard deviation of the set. 2 Precision and Accuracy of Experimental Data Classes of errors The phenomena that are responsible for uncertainties in an analytical measurement can be divided in two broad categories: determinate or system errors and indeterminate or random errors. The total error is the sum of the two types of errors. Determinate errors have assignable causes and are unidirectional. It may be possible to eliminate some of these, for example, errors because of improper calibration of the equipment, or presence of interfering substances in the sample. Errors inherent in the method, such as addition of a reagent in excess of theoretical requirement to cause an indicator to undergo colour change in a titration, may be difficult to eliminate. Indeterminate errors are encountered whenever a measuring system is extended to its maximum sensitivity. The results fluctuate in a random manner about a mean value. The sources of these fluctuations can never be identified because they are made up of a myriad of instrumental, personal and method uncertainties that are individually so small that they can never be detected. For example, in he case of addition of an exact volume of reagent in an analysis through a pipette the uncertainties could be the time allowed for draining the pipette, the angle at which the pipette is held during delivery, temperature of the reagent, visual judgement of water level with respect to the graduation mark, etc. What is observed in the final result is then a summation of a very large number of minute unobservable uncertainties. The cumulative effect is likewise variable. Ordinarily they tend to cancel one other and thus exert a minimal effect. Occasionally, however, they act in concert to produce a relatively large positive or negative error. Precision The term precision is employed to describe the reproducibility of results. It can be defined as the agreement between the numerical values of two or more measurements that have been made in an identical fashion. Absolute methods for expressing precision: The absolute average deviation from the mean is a common method for describing precision. The spread or range of a set of data is also a measure of precision and is simply the numerical difference of the highest and the lowest result. Standard deviation, described earlier, is a more significant measure of precision.
  • 5. Example 1 From the data of replicate chloride analysis of a water sample given below, calculate the precision in terms of the average deviation from the mean: Analysis Chloride, mg/L Abs. dev. from the Mean, mg/L 1 24.39 0.077 2 24.19 0.123 3 24.36 0.047 Total 72.94 0.247 Mean = 24.313 ave. dev. = 0.247/3 = 0.082 Relative methods for expressing precision: It is frequently more informative to indicate the relative precision. The relative parameters are dimensionless and therefore can be used to compare two ore more sets of data. Thus, for example, the relative deviation of analysis 1, in the above example, is (0.077 X 100J/24.313 = 0.32%. Relative standard deviation or coefficient of variation is defined as: CV = 100s (6) x Example 2 Monitoring results at three sampling locations are listed below. Compare the sampling records in terms of variability. A B C 40.0 19.9 37.0 29.2 24.1 33.4 18.6 22.1 36.1 29.3 19.8 40.2 X 29.28 21.48 36.68 s 8.74 2.05 2.80 CV 0.30 0.10 0.07 In terms of the coefficient of variation the concentration at A varies the most, followed by B and then C. Accuracy The term accuracy is used to describe the total error of the observation, which is the sum of the systematic and random errors. It denotes the nearness of the measurement to its accepted value. In Example 1, if the accepted value for the chloride concentration is 24.35 mg/L, the absolute error of the mean is 24.31 - 24.35 = 0.04 mg/L.
  • 6. 3. Propagation of errors The indeterminate error or uncertainty is most commonly expresses as standard deviation. When the final result is computed from two or more data, each of which has an indeterminate error associated with it, the error of the result will depend on the arithmetic computations. The following examples illustrate the procedure to be followed: Example 3: For the sum + 0.50 (+0.02) + 4.10 (+ 0.03) - 1.97 (+ 0.05) + 2.63 (+? ?) where the numbers in parantheses are the absolute standard Statistically the most probable standard deviation would be given by the of the sum of individual variances: s = V(+0,02)2 +(+0.03)2 + (+0.05)2 deviations, square root = +0.078 Therefore the result could be reported as: 2.63 (+0.078) Example 4: The case when products and quotients are involved is illustrated in the following calculations: 4.10( + 0.02)x 0.0050(+0.0001) = 0.0104(+?) 1.97(+0.04) In this case it is necessary to calculate the relative standard deviations: (Sa)r = + 0.02 = +0.0049 4.10 (Sa)r = + 0.0001 =+ 0.020 0.005 (Sr.)r = + 0.04 = + 0.020 1.97 (Sy) r =V (+0.0049)2 + (+ 0.02)2 +(+0.02)2 =+ 0.029
  • 7. The absolute standard deviation of the result will bel Sy = 0.0104 x ( + 0.029) = + (0.0003) Therefore the uncertainty of the result can be written as: 0.0104 (+ 0.0003) For calculations that involve both sums and differences as well as products and quotients, the uncertainties associated with the former are evaluated first and then the latter following procedures illustrated in the two examples.