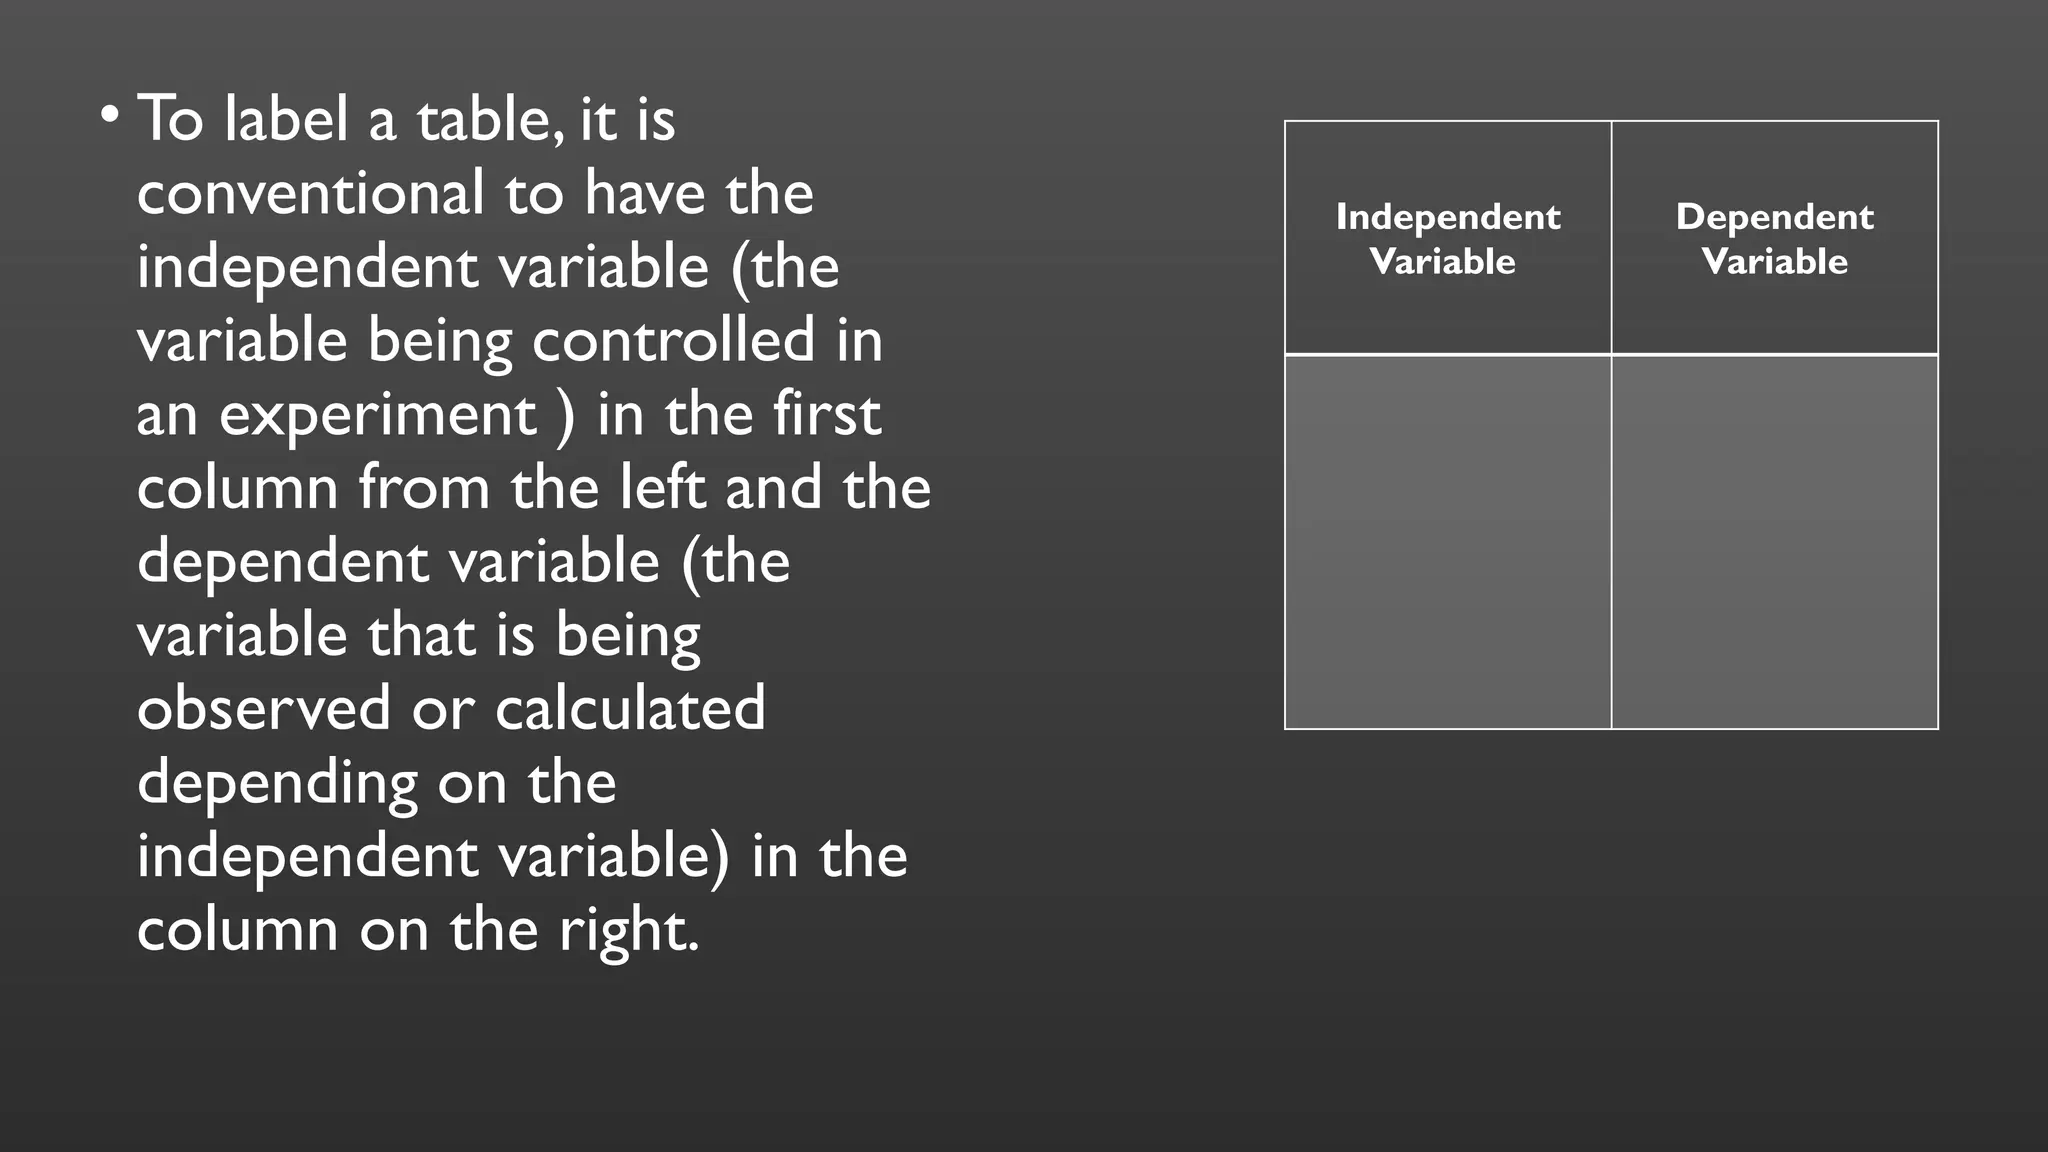
• To labela table, it is
conventional to have the
independent variable (the
variable being controlled in
an experiment ) in the first
column from the left and the
dependent variable (the
variable that is being
observed or calculated
depending on the
independent variable) in the
column on the right.
Independent
Variable
Dependent
Variable
3.
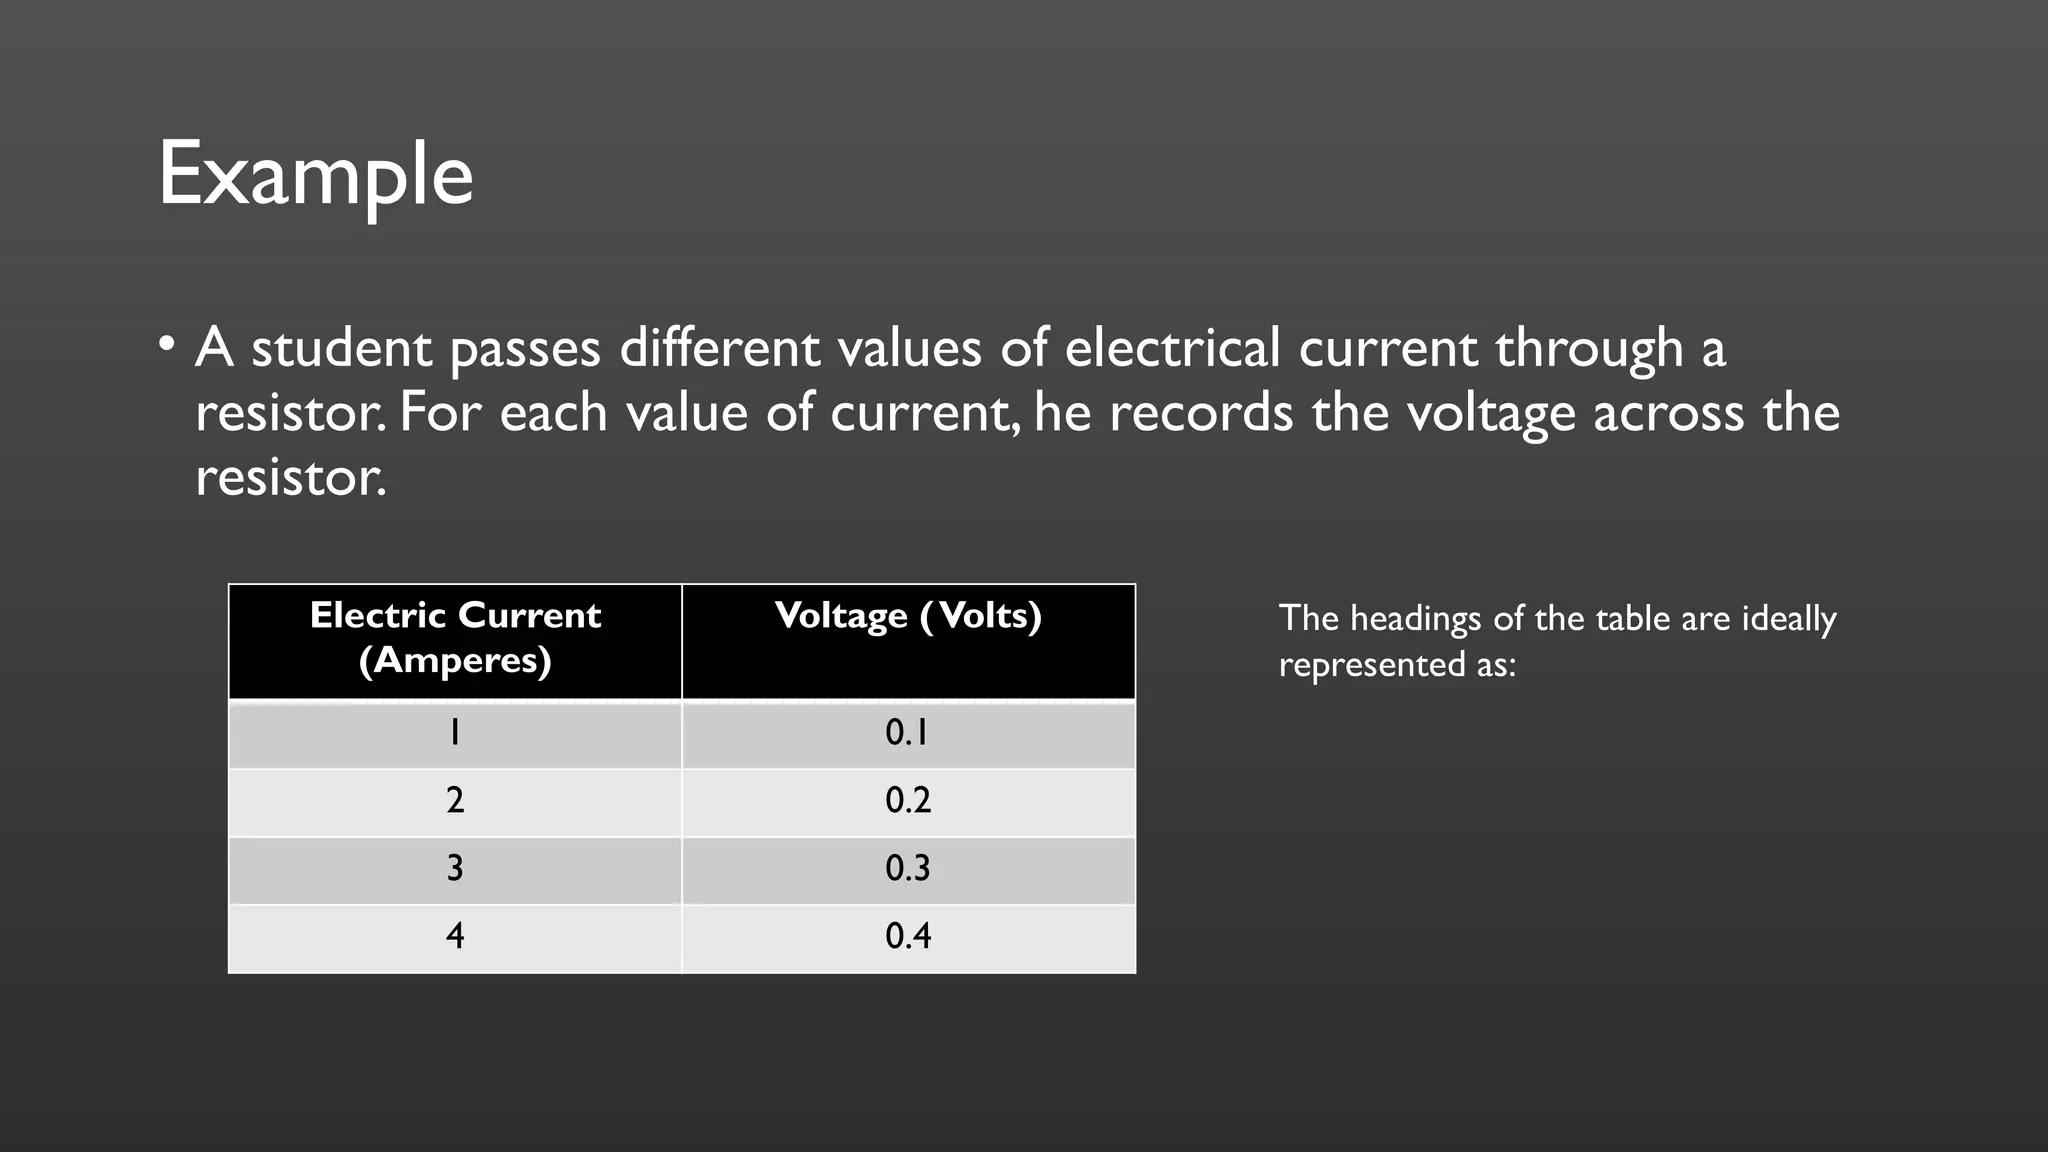
Example
• A studentpasses different values of electrical current through a
resistor. For each value of current, he records the voltage across the
resistor.
Electric Current
(Amperes)
Voltage (Volts)
1 0.1
2 0.2
3 0.3
4 0.4
The headings of the table are ideally
represented as:
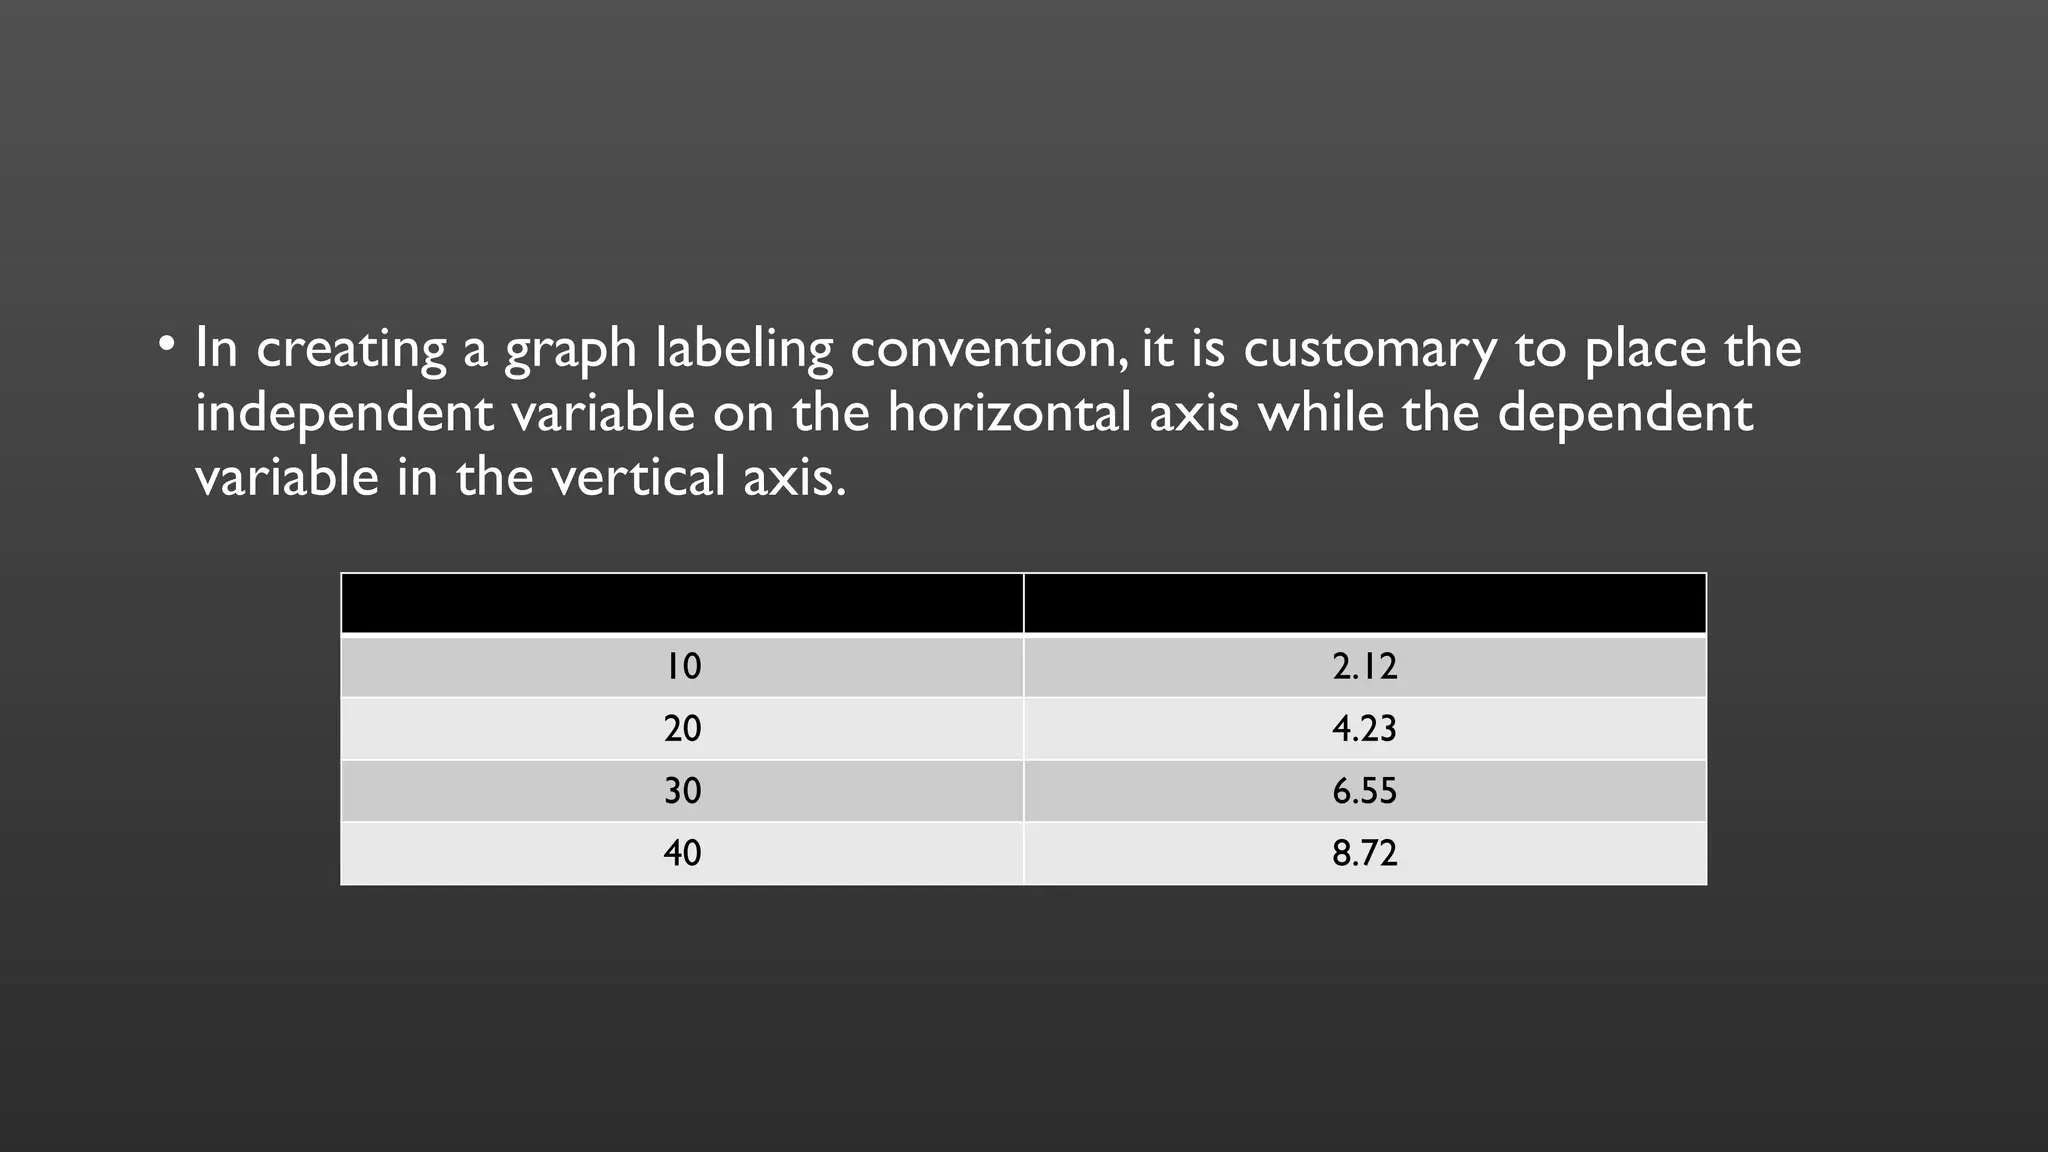
• In creatinga graph labeling convention, it is customary to place the
independent variable on the horizontal axis while the dependent
variable in the vertical axis.
10 2.12
20 4.23
30 6.55
40 8.72
6.
10 20 3040
0
1
2
3
4
5
6
7
8
9
10
Time, t (seconds)
Speed
,v
(m/s)
In the figure, the graph labeling convention of the independent variable time,
t, is placed on the x-axis while the dependent variable speed, v, is placed on
the y-axis.
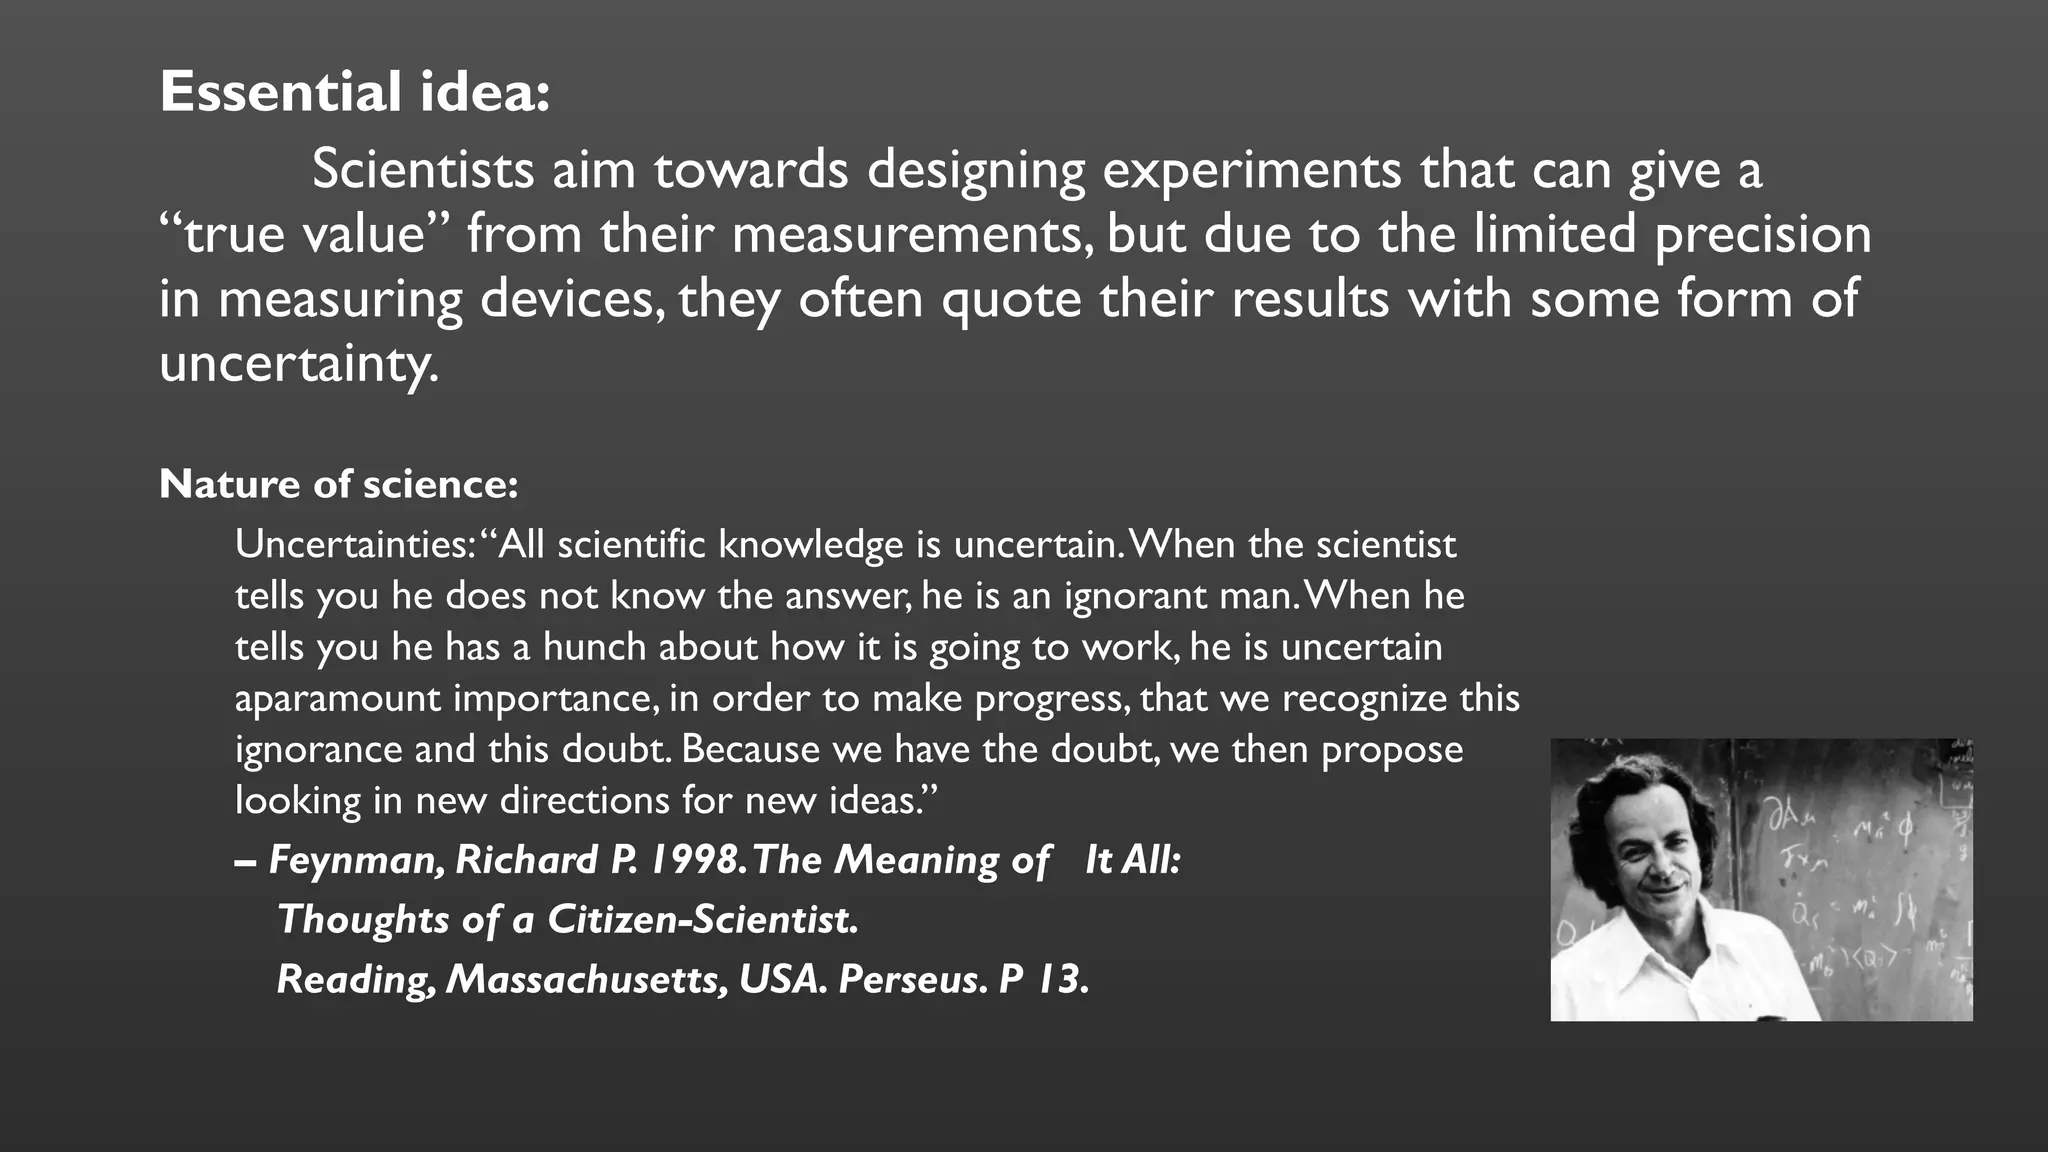
Essential idea:
Scientists aimtowards designing experiments that can give a
“true value” from their measurements, but due to the limited precision
in measuring devices, they often quote their results with some form of
uncertainty.
Nature of science:
Uncertainties:“All scientific knowledge is uncertain.When the scientist
tells you he does not know the answer, he is an ignorant man.When he
tells you he has a hunch about how it is going to work, he is uncertain
aparamount importance, in order to make progress, that we recognize this
ignorance and this doubt. Because we have the doubt, we then propose
looking in new directions for new ideas.”
– Feynman, Richard P. 1998.The Meaning of It All:
Thoughts of a Citizen-Scientist.
Reading, Massachusetts, USA. Perseus. P 13.
9.
• Measurements havea degree of uncertainty that comes from different
sources.
• Uncertainty analysis or Error analysis is used to calculate
uncertainty
• A value that is measured should have an estimate together with the
uncertainty value.
10.
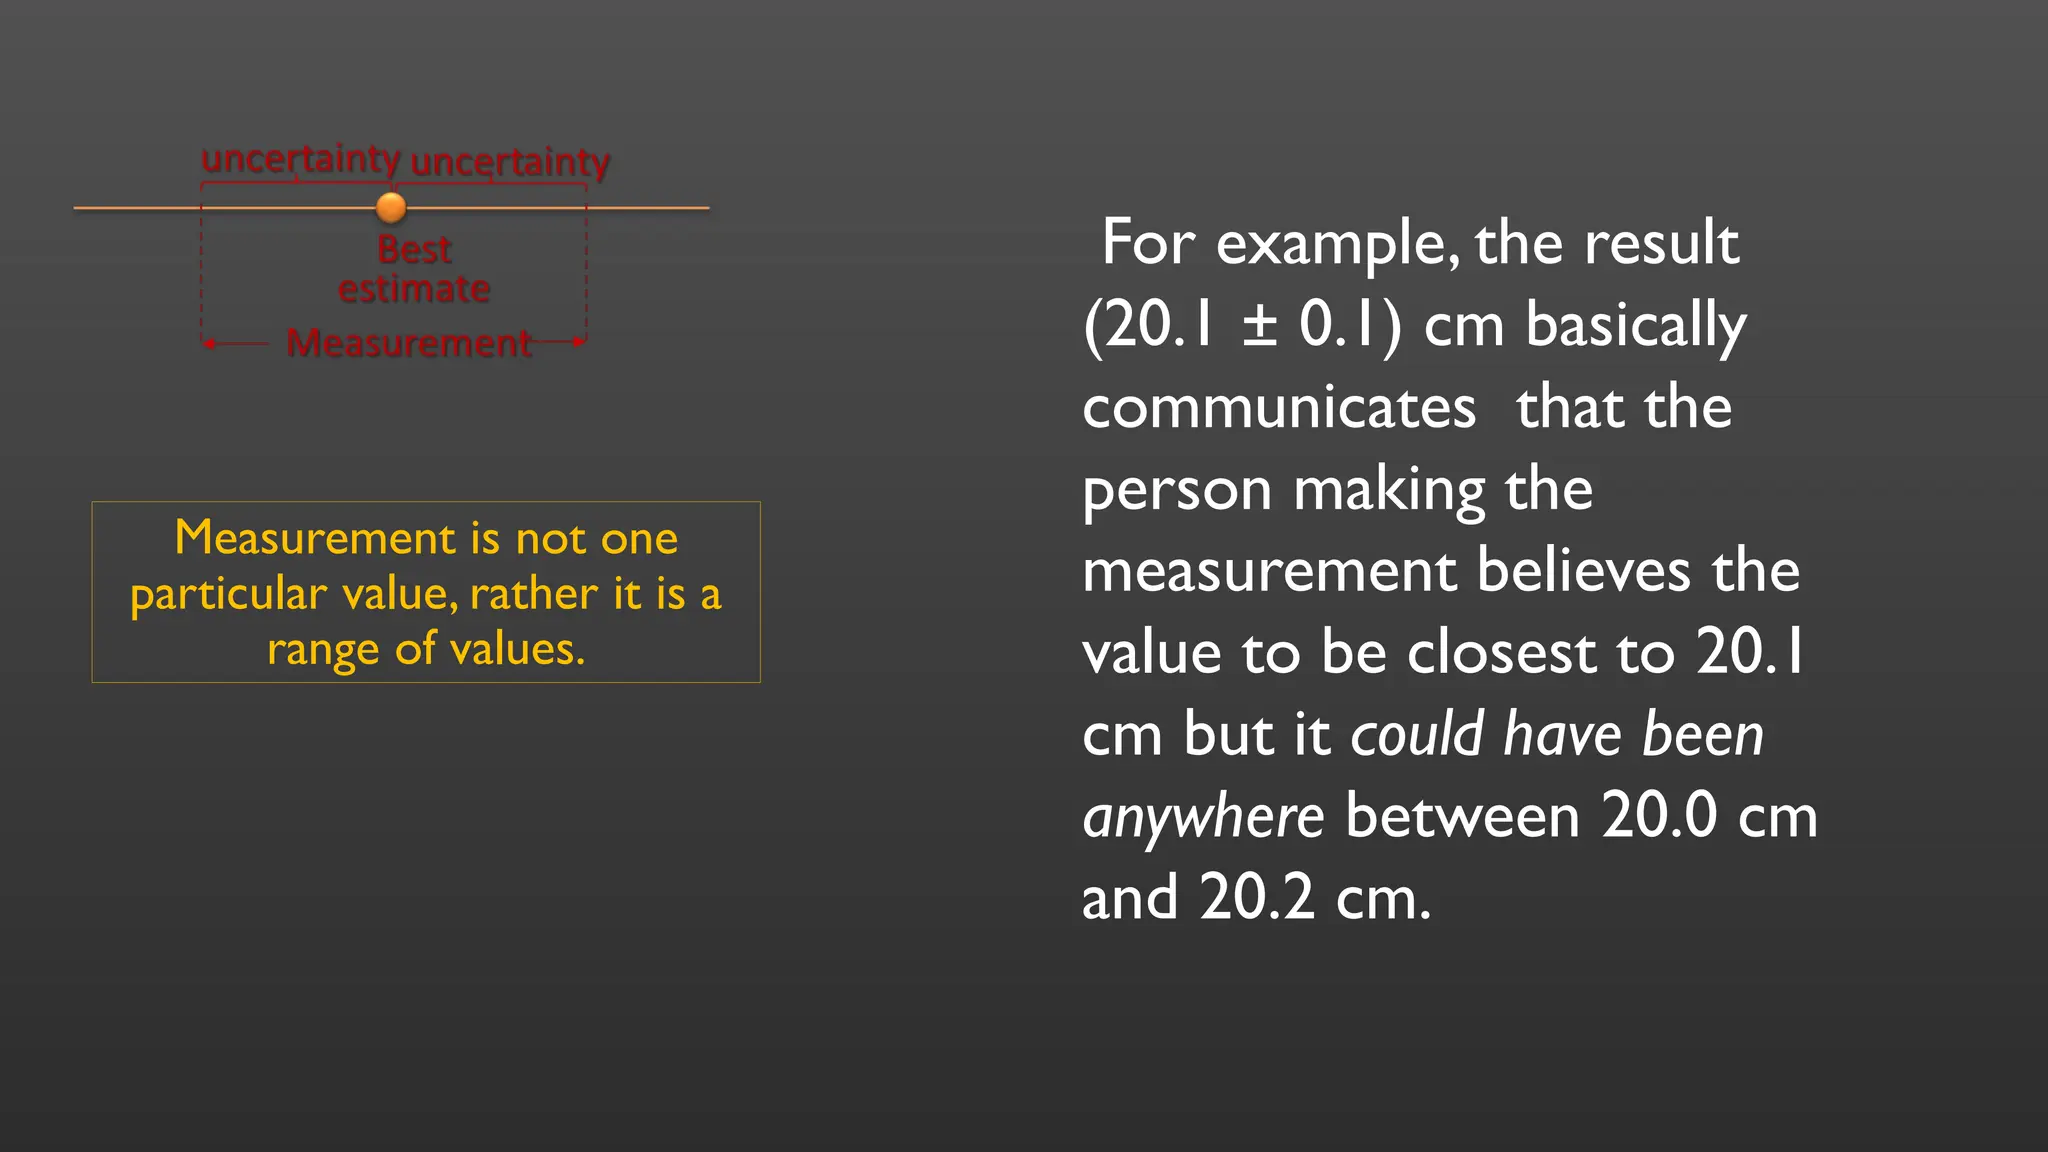
Measurement is notone
particular value, rather it is a
range of values.
For example, the result
(20.1 ± 0.1) cm basically
communicates that the
person making the
measurement believes the
value to be closest to 20.1
cm but it could have been
anywhere between 20.0 cm
and 20.2 cm.
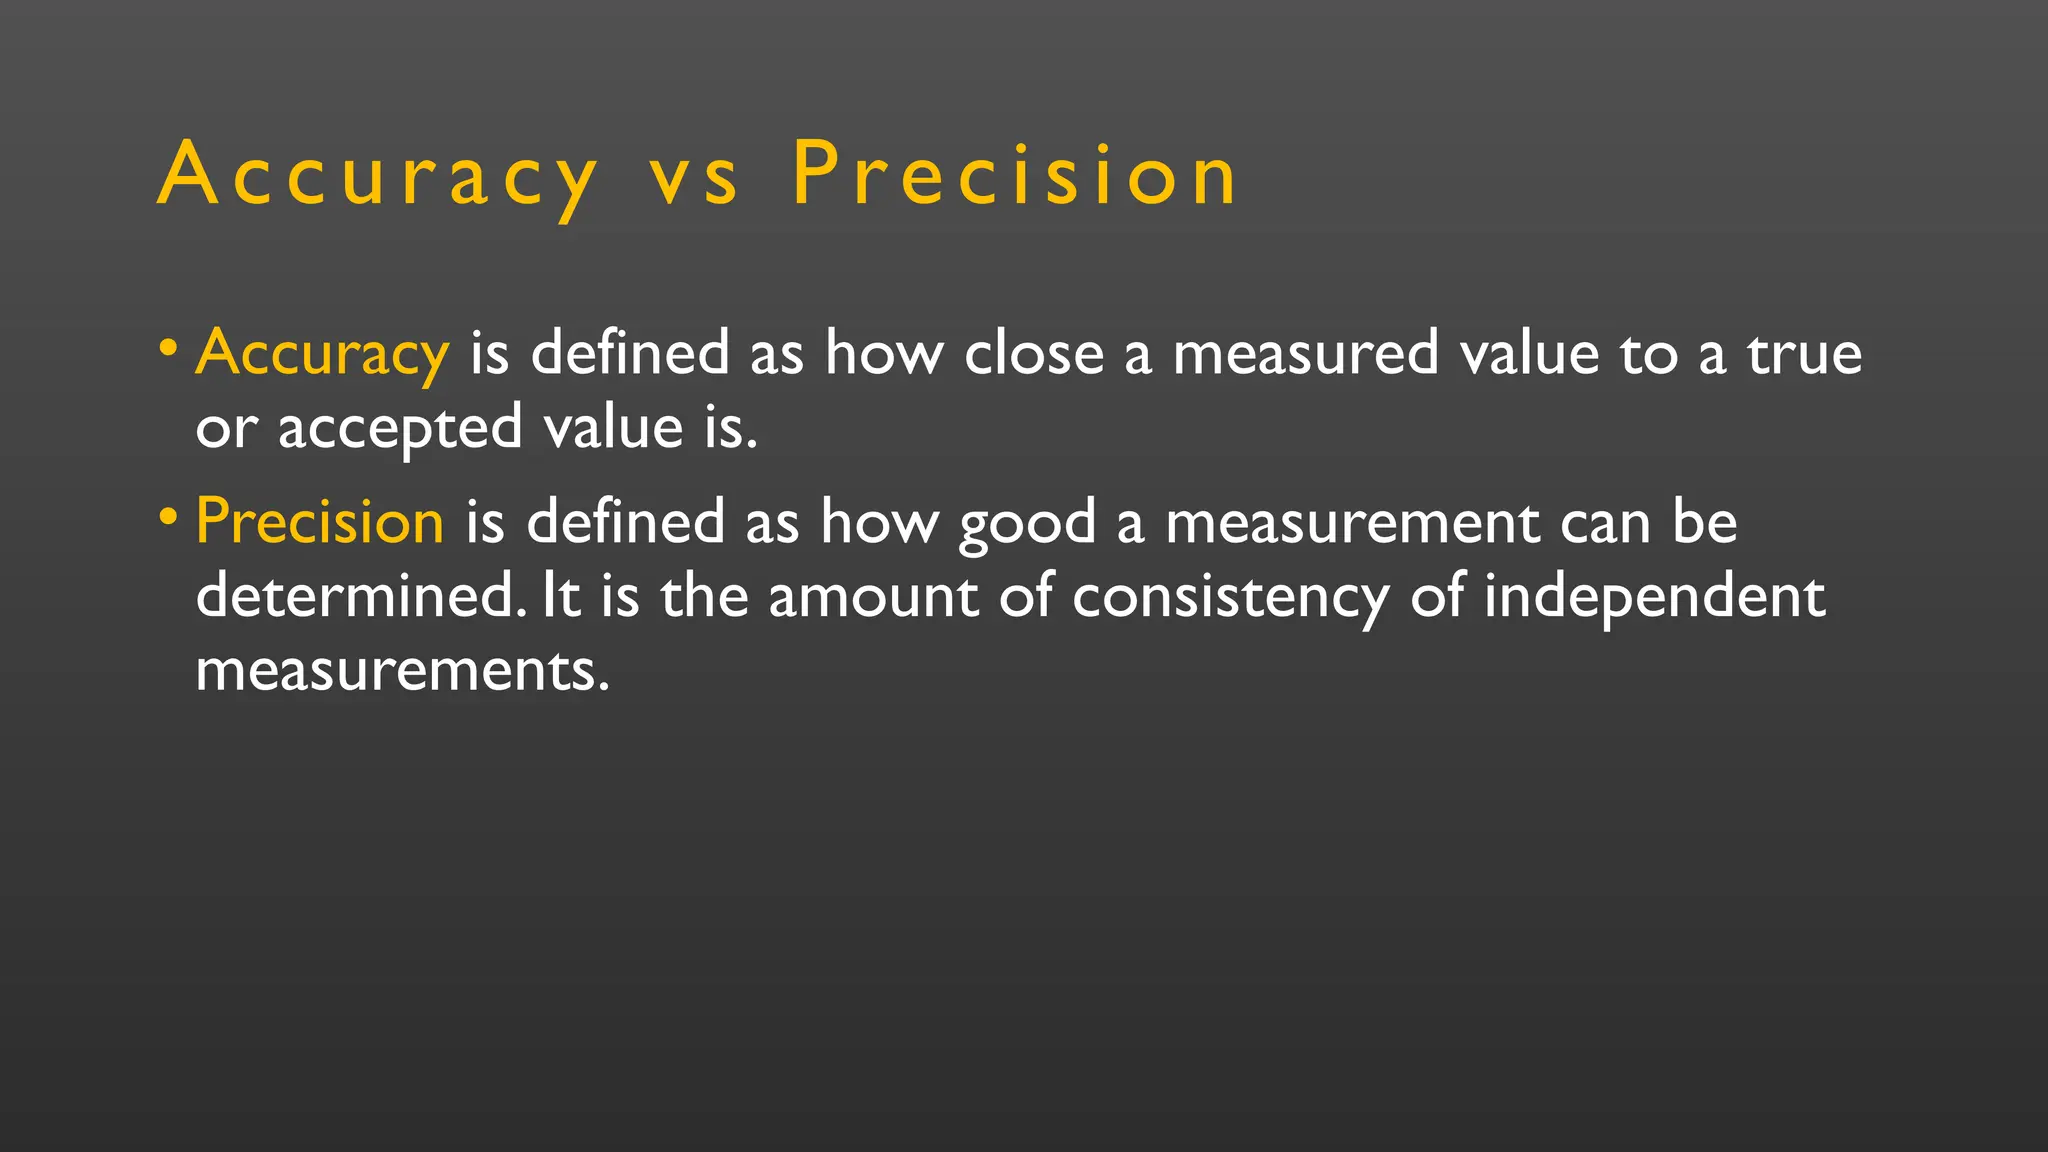
Accuracy vs Precision
•Accuracy is defined as how close a measured value to a true
or accepted value is.
• Precision is defined as how good a measurement can be
determined. It is the amount of consistency of independent
measurements.
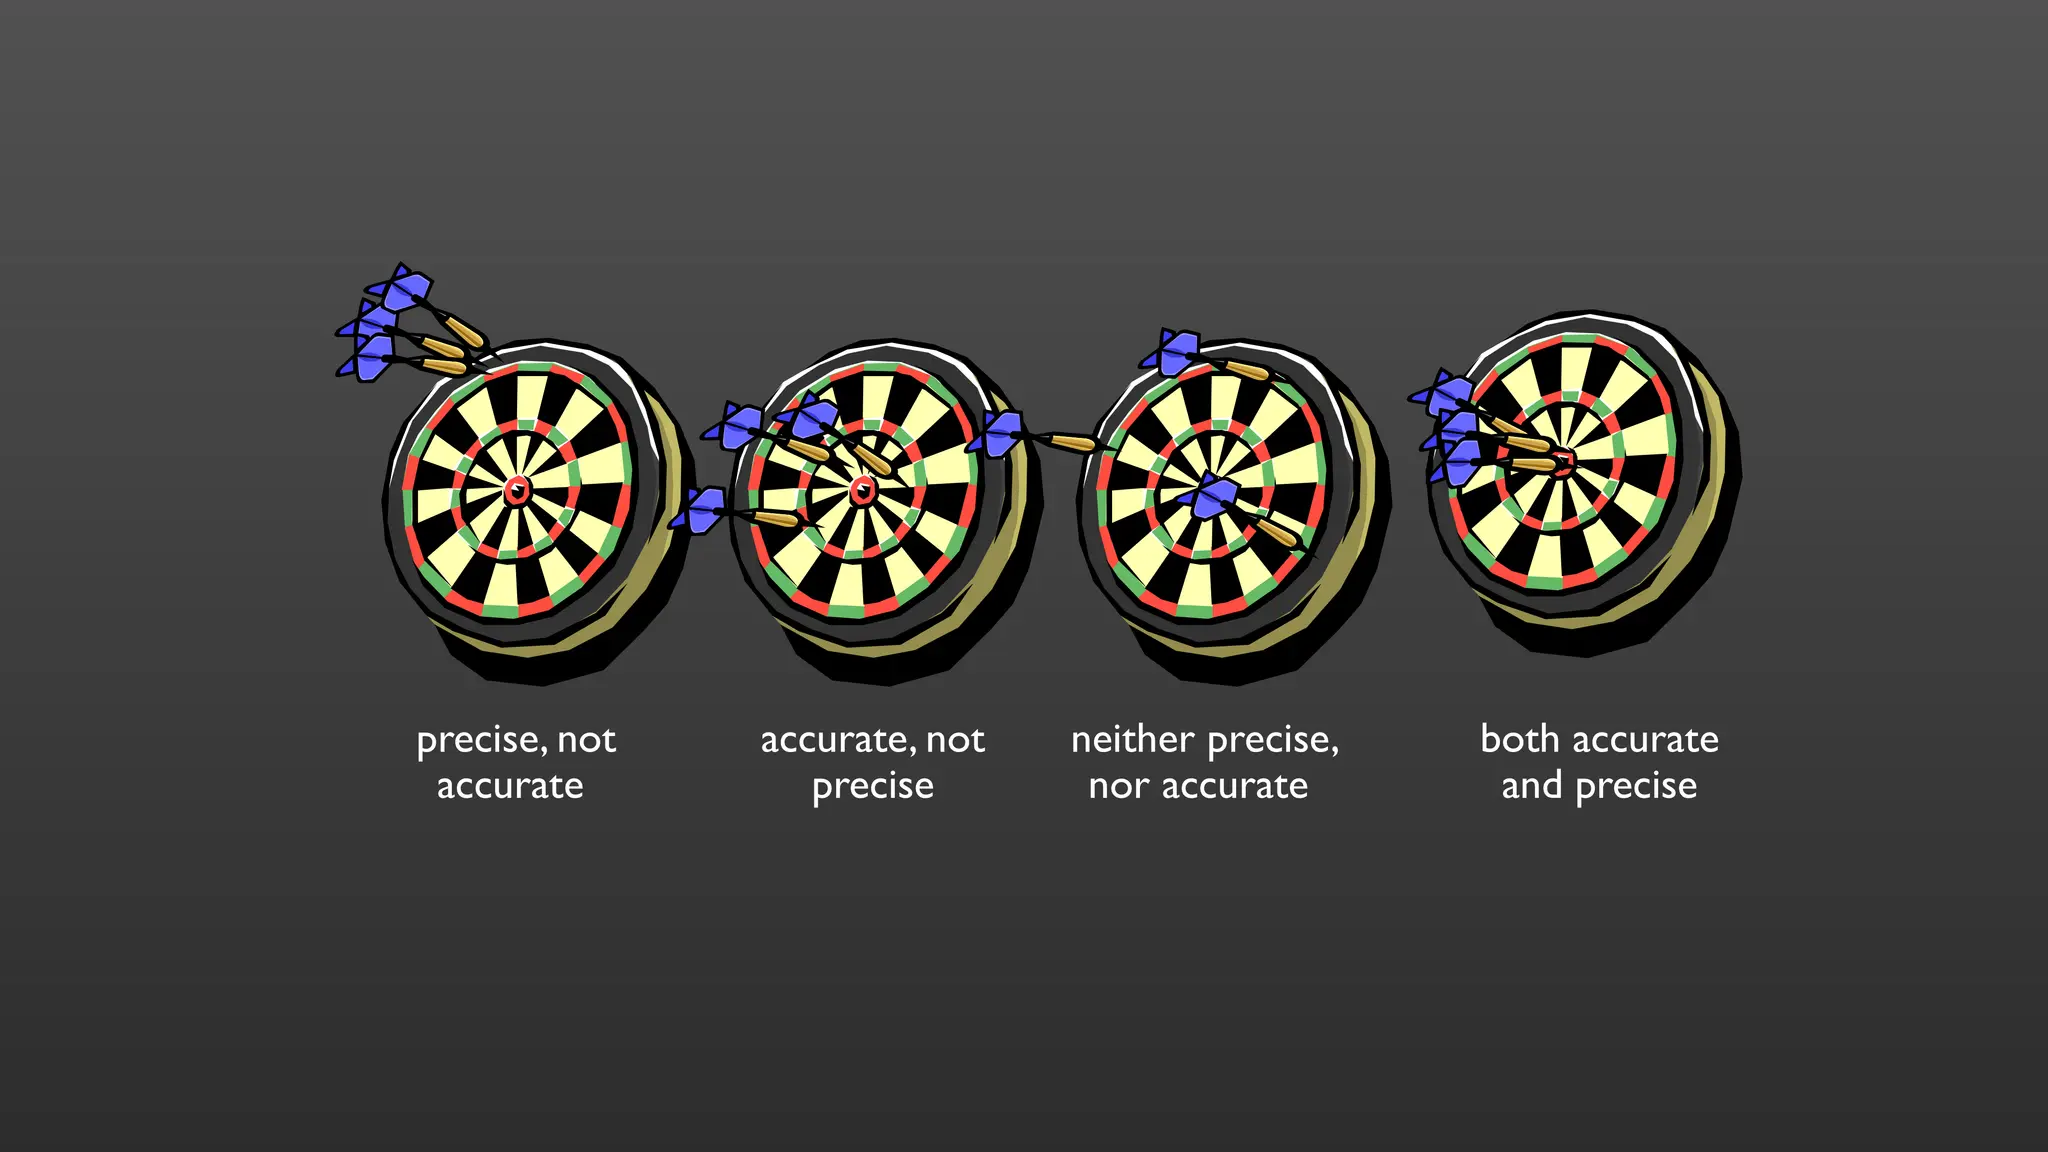
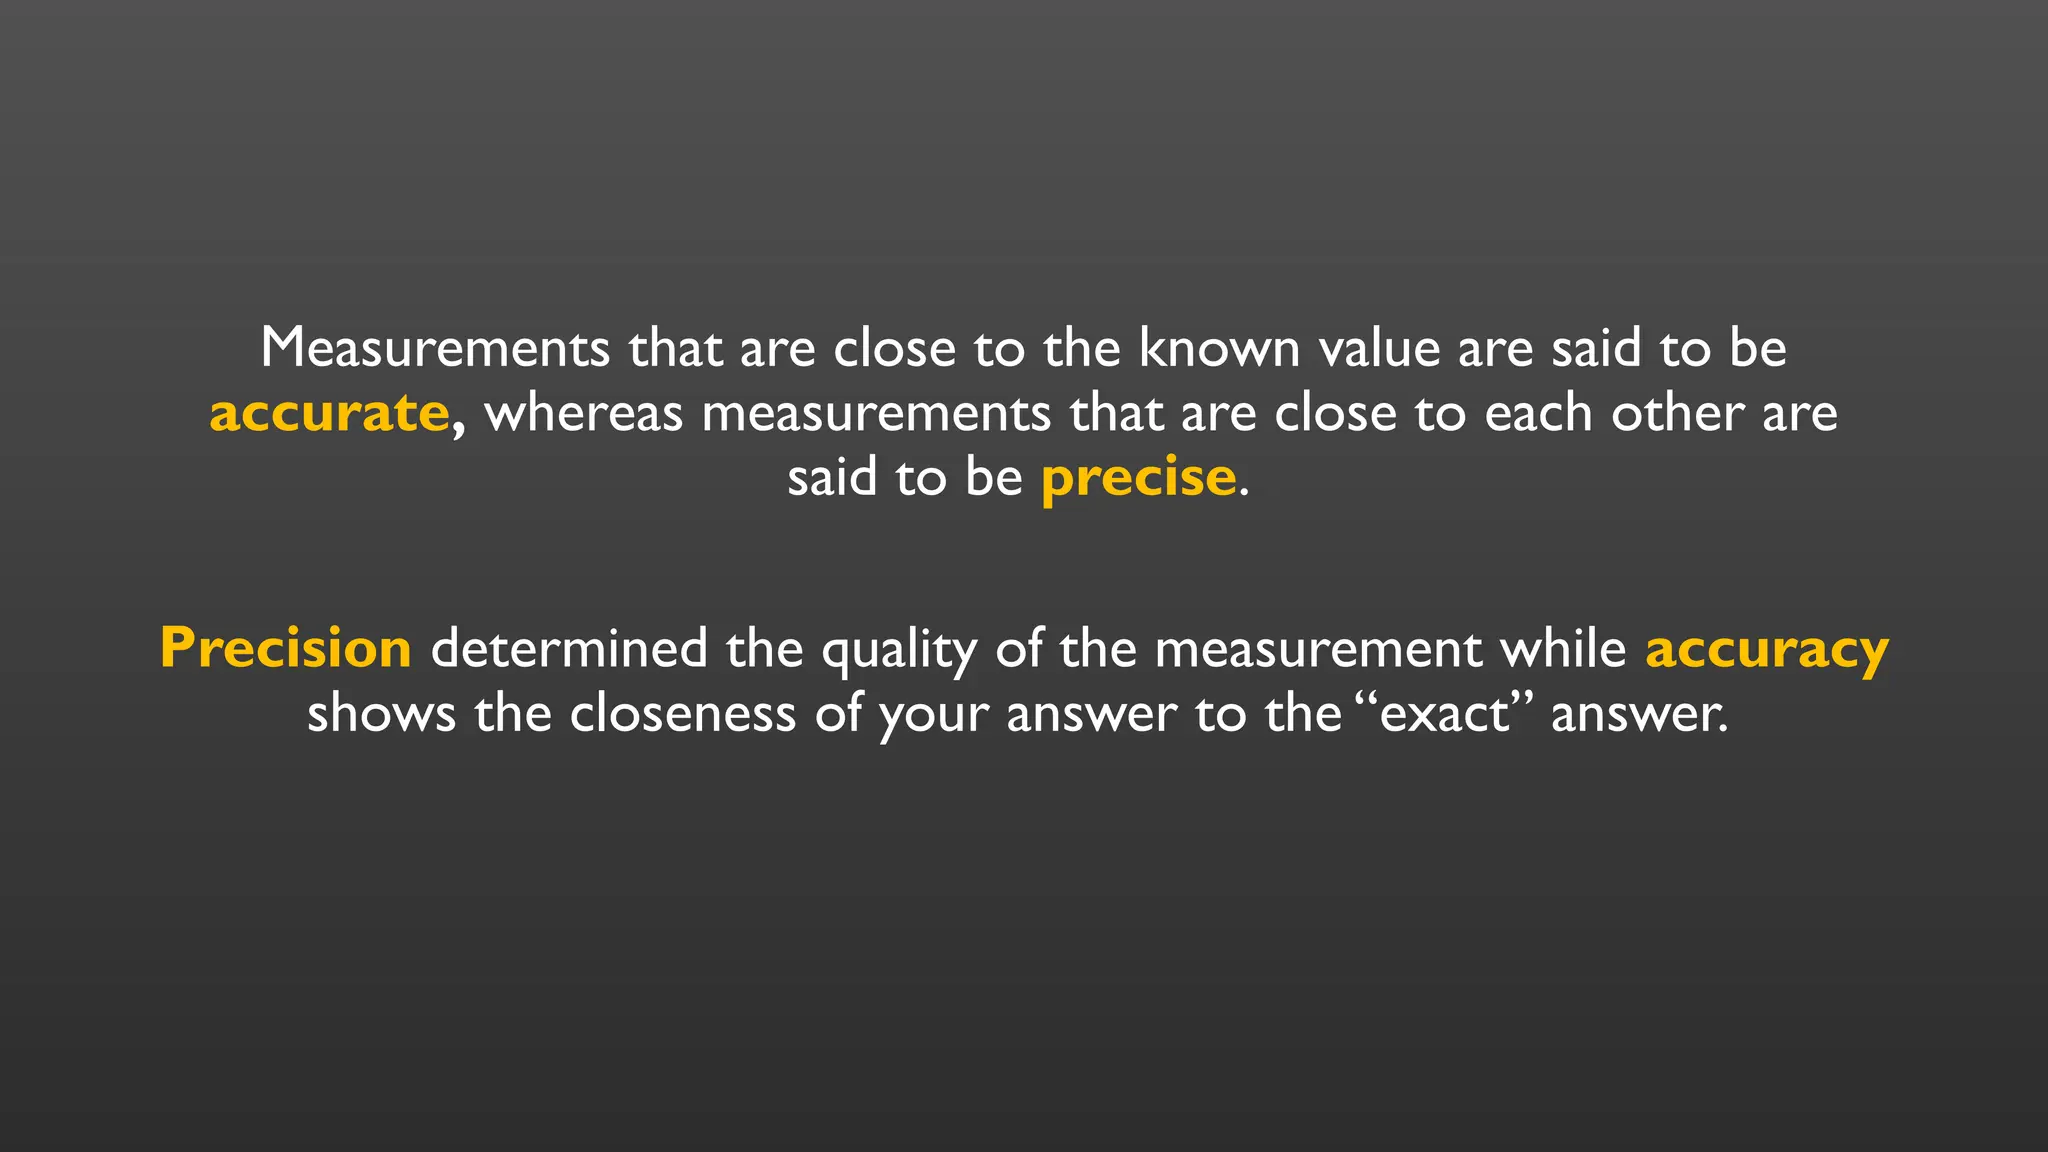
Measurements that areclose to the known value are said to be
accurate, whereas measurements that are close to each other are
said to be precise.
Precision determined the quality of the measurement while accuracy
shows the closeness of your answer to the “exact” answer.
16.
• Precision isexpressed as a relative or fractional uncertainty:
Example:
If mass (m) = 75.5 ± 0.5 g, the relative or fractional uncertainty is
obtained as:
17.
A student measuresthe mass of a rock and
records it as 120.0 g ± 1.5 g. What is the
relative uncertainty of the measurement?
Tr y This!
18.
A thermometer readsthe temperature of a
liquid as 78.6°C with an uncertainty of ±0.3 °C.
What is the relative uncertainty of the
temperature reading?
Tr y This!
19.
• Accuracy isexpressed using relative error.
For example, if the expected value for mass = 80.0 g, the
relative error is:
20.
A student usesa digital scale to measure sugar
for an experiment.The scale reads 120.0 g with
an uncertainty of ±1.5 g.The expected amount
of sugar based on the recipe is 125.0 g.
a.What is the relative uncertainty of the
measurement?
b.What is the relative error compared to the
expected value?
PRACTICE PROBLEM1
21.
A thermometer showsa patient's temperature
as 37.2°C with an uncertainty of ±0.2 °C.The
standard healthy body temperature is 37.0 °C.
a.What is the relative uncertainty of the
thermometer reading?
b.What is the relative error from the expected
value?
PRACTICE PROBLEM2
22.
A student measuresthe volume of water in a
beaker and gets 250.0 mL with an uncertainty
of ±1.0 mL.The volume was supposed to be
exactly 255.0 mL.
a. Calculate the relative uncertainty of the
measurement.
b. Find the relative error compared to the
expected volume.
PRACTICE PROBLEM3
23.
A physics studentuses a ruler to measure a
metal rod and gets 40.0 cm, with an uncertainty
of ±0.4 cm.According to the manual, the actual
length should be 39.5 cm.
a.What is the relative uncertainty of the
measurement?
b.What is the relative error from the expected
length?
PRACTICE PROBLEM4
Forms of Error
•Inperforming measurements, errors are sometimes
committed.
•They are classified as either random or systematic
depending on the situation on how the measurement
was obtained
26.
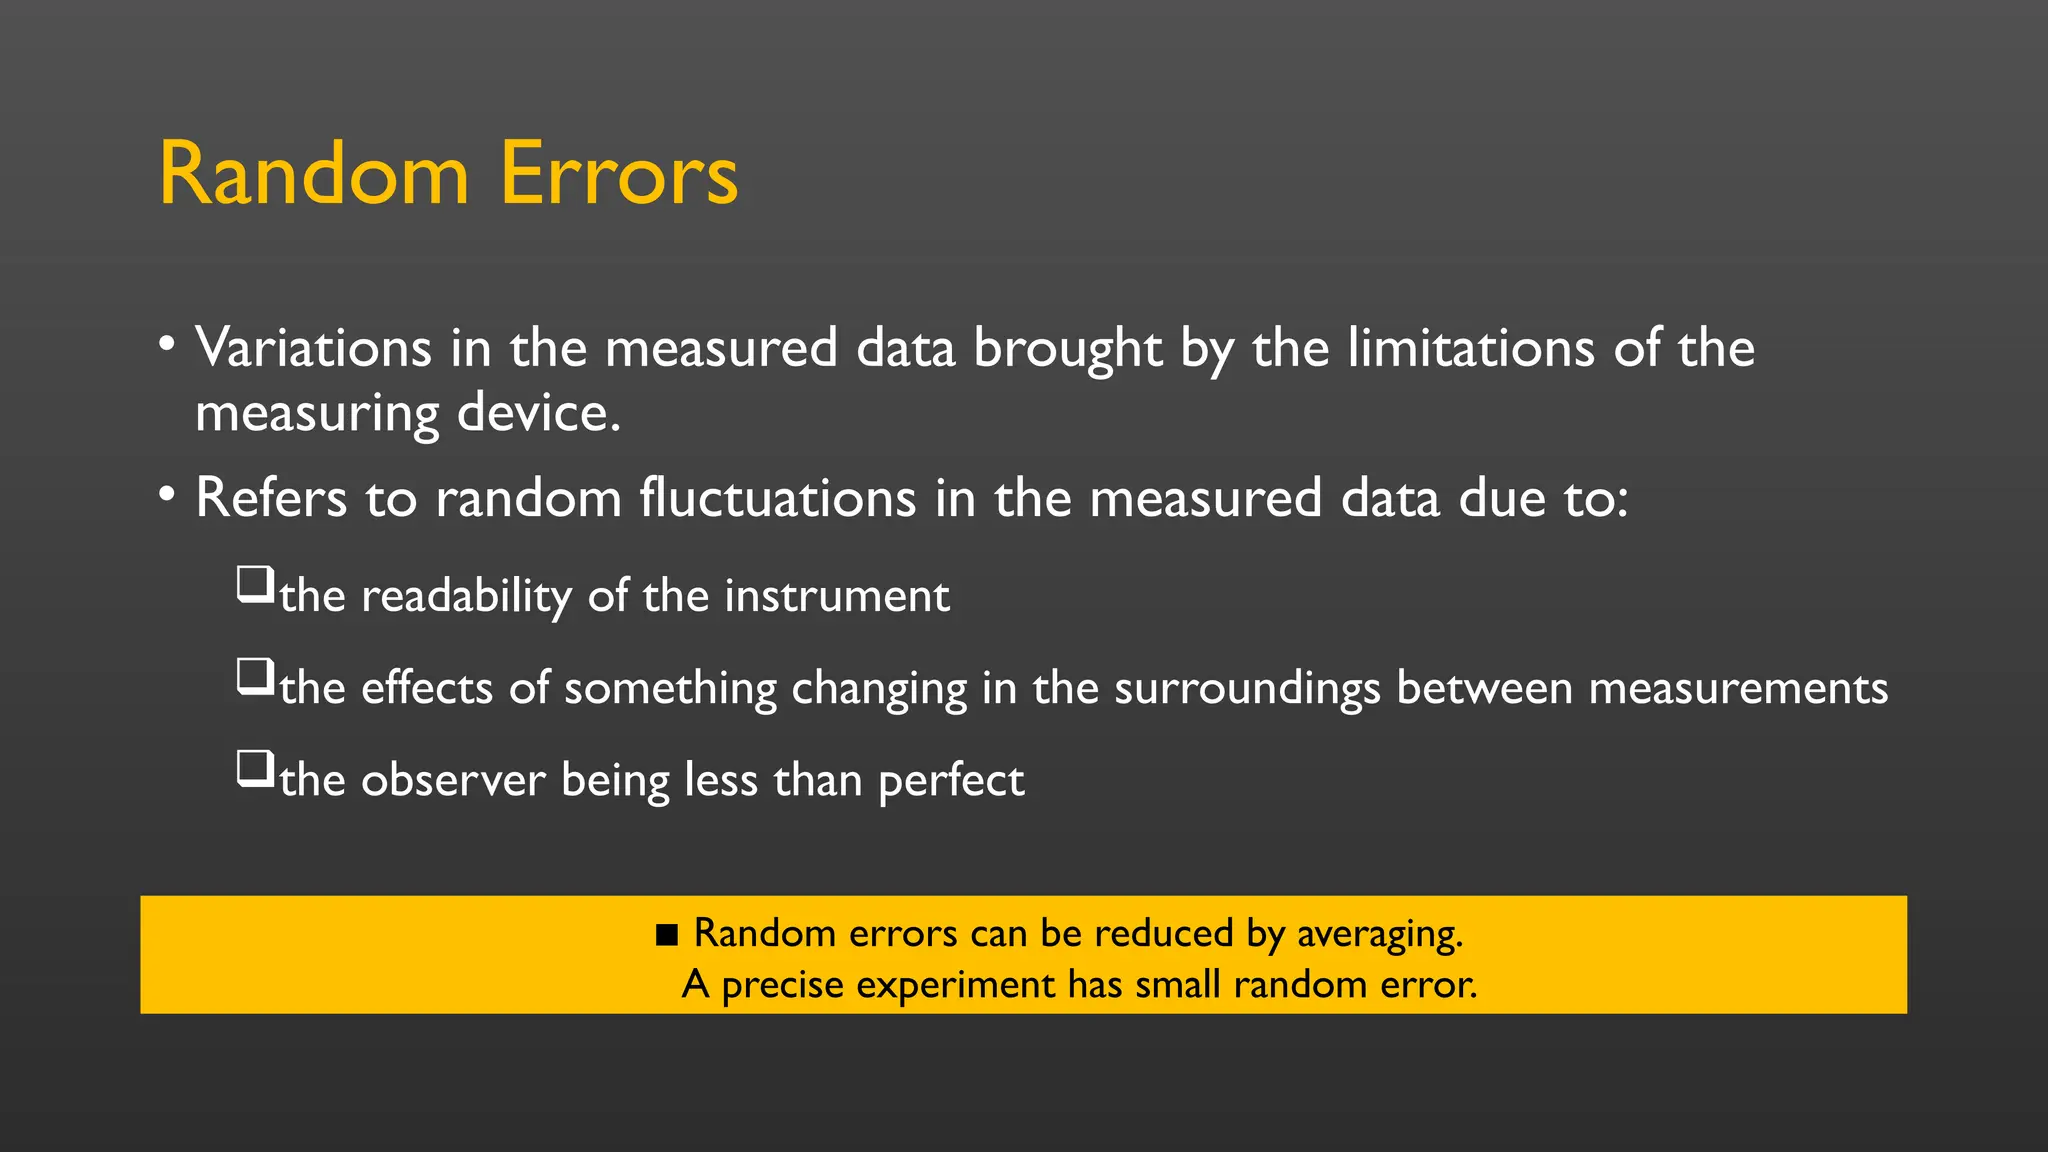
Random Errors
• Variationsin the measured data brought by the limitations of the
measuring device.
• Refers to random fluctuations in the measured data due to:
the readability of the instrument
the effects of something changing in the surroundings between measurements
the observer being less than perfect
▪ Random errors can be reduced by averaging.
A precise experiment has small random error.
27.
Systemic Error
•Reproducible inaccuratedata that are constantly in
the same direction.
• Example:
if a systematic error is identified due to calibration of
a measuring instrument based on standard, applying a
correction factor to compensate the effect can reduce the
favored measurement.
28.
Systemic Error
• errordue to the instrument being “out of adjustment.”
• An instrument with a zero offset error.
• A meter stick might be worn off or rounded at one end
• An instrument that is improperly calibrated
▪ Systematic errors are usually difficult to detect.
▪ Systematic errors can be detected using
different methods of measurement
29.
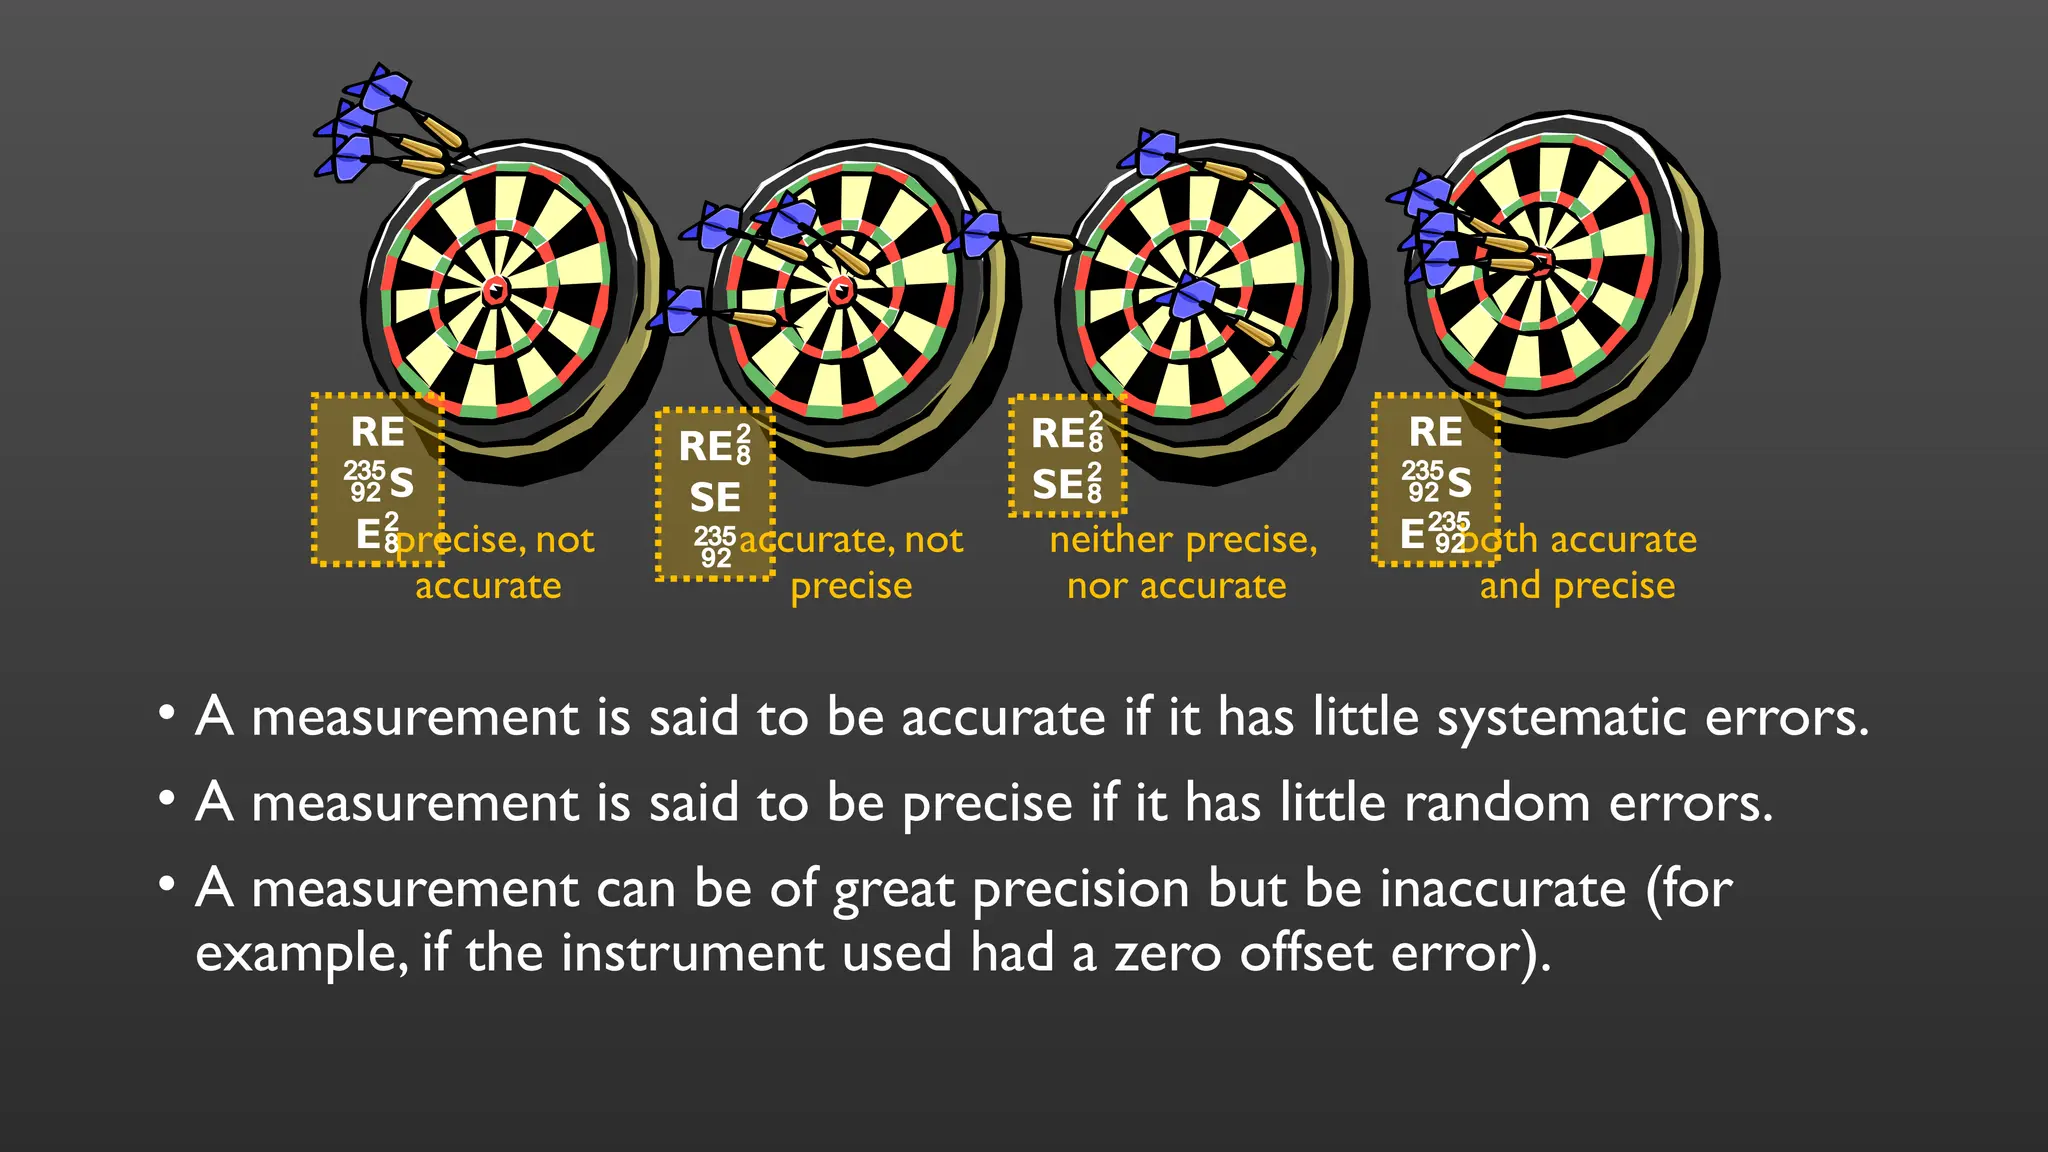
• A measurementis said to be accurate if it has little systematic errors.
• A measurement is said to be precise if it has little random errors.
• A measurement can be of great precision but be inaccurate (for
example, if the instrument used had a zero offset error).
precise, not
accurate
accurate, not
precise
neither precise,
nor accurate
both accurate
and precise
RE
S
E
RE
SE
RE
SE
RE
S
E
30.
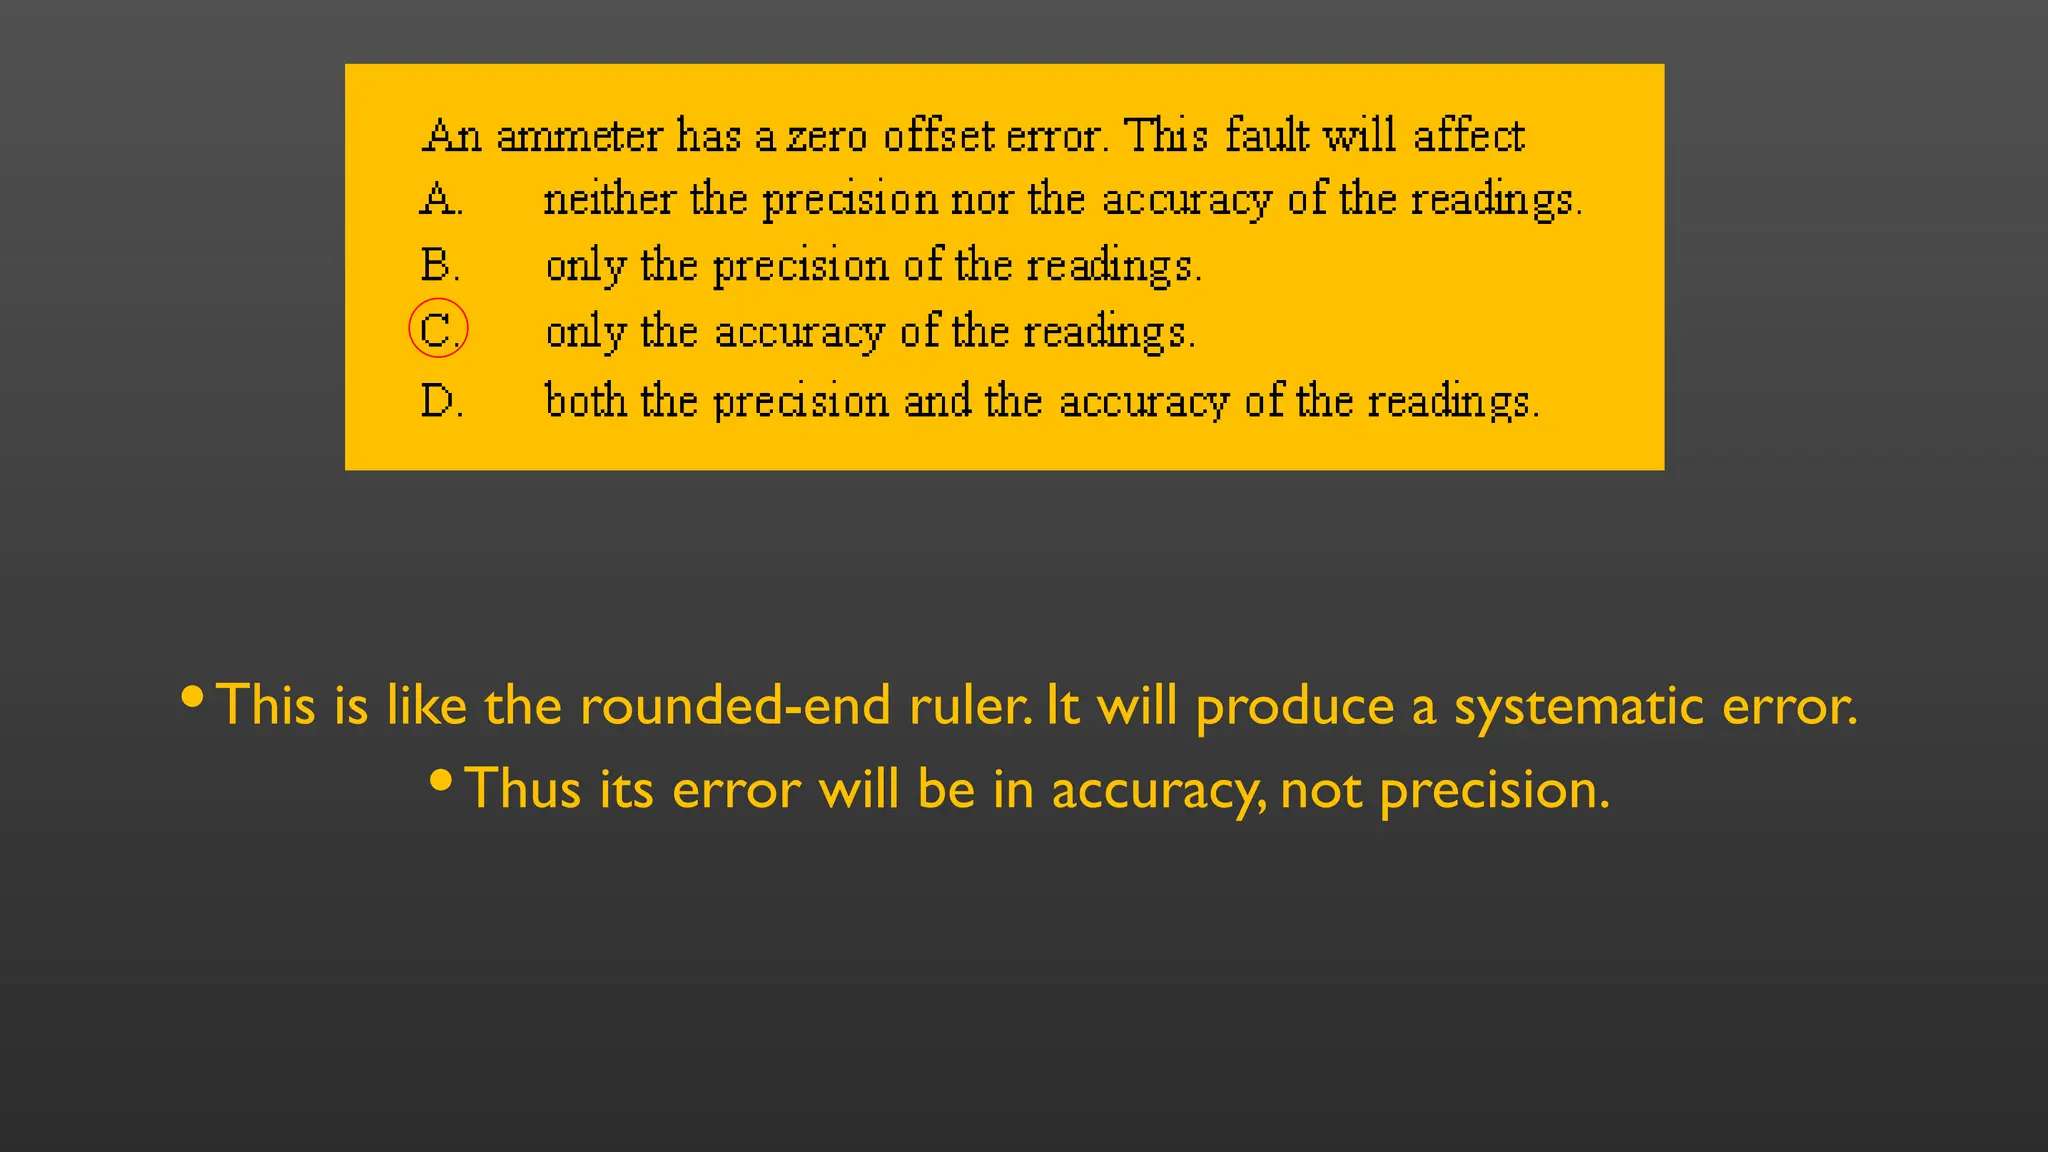
·This is likethe rounded-end ruler. It will produce a systematic error.
·Thus its error will be in accuracy, not precision.
Inadequate Definition
•Either Systematicor Random
•For example, if two students measure the length of a
rope, they possible get different results because either
one may stretch the rope with a different force
33.
Unable to Includea Factor
•Systematic
•For example, when measuring free fall, air resistance
was not considered.
•A good way to analyze this source of error is to
discuss all aspects that could probably affect the result
before doing the experiment so that considerations
can be made before doing the measurements.
34.
Factors Due tothe Environment
•Either systematic or random
•Errors brought by the environment such as vibration,
temperature, noise, or other conditions that may
affect the measuring instrument.
35.
Limited Scale ofthe Instrument
•Random
•For example a meter cannot measure exactly in the
smallest scale division.
36.
Unable to Calibrateor Check
Zero Scale of the Instrument
•Systematic
•If possible, always check the calibration of the
instrument before taking measurements
37.
Variation in thePhysical
Environment
•Take several measurements over a whole range that is
being explored.This will reveal variations in the
experiment that might not be noticed.
38.
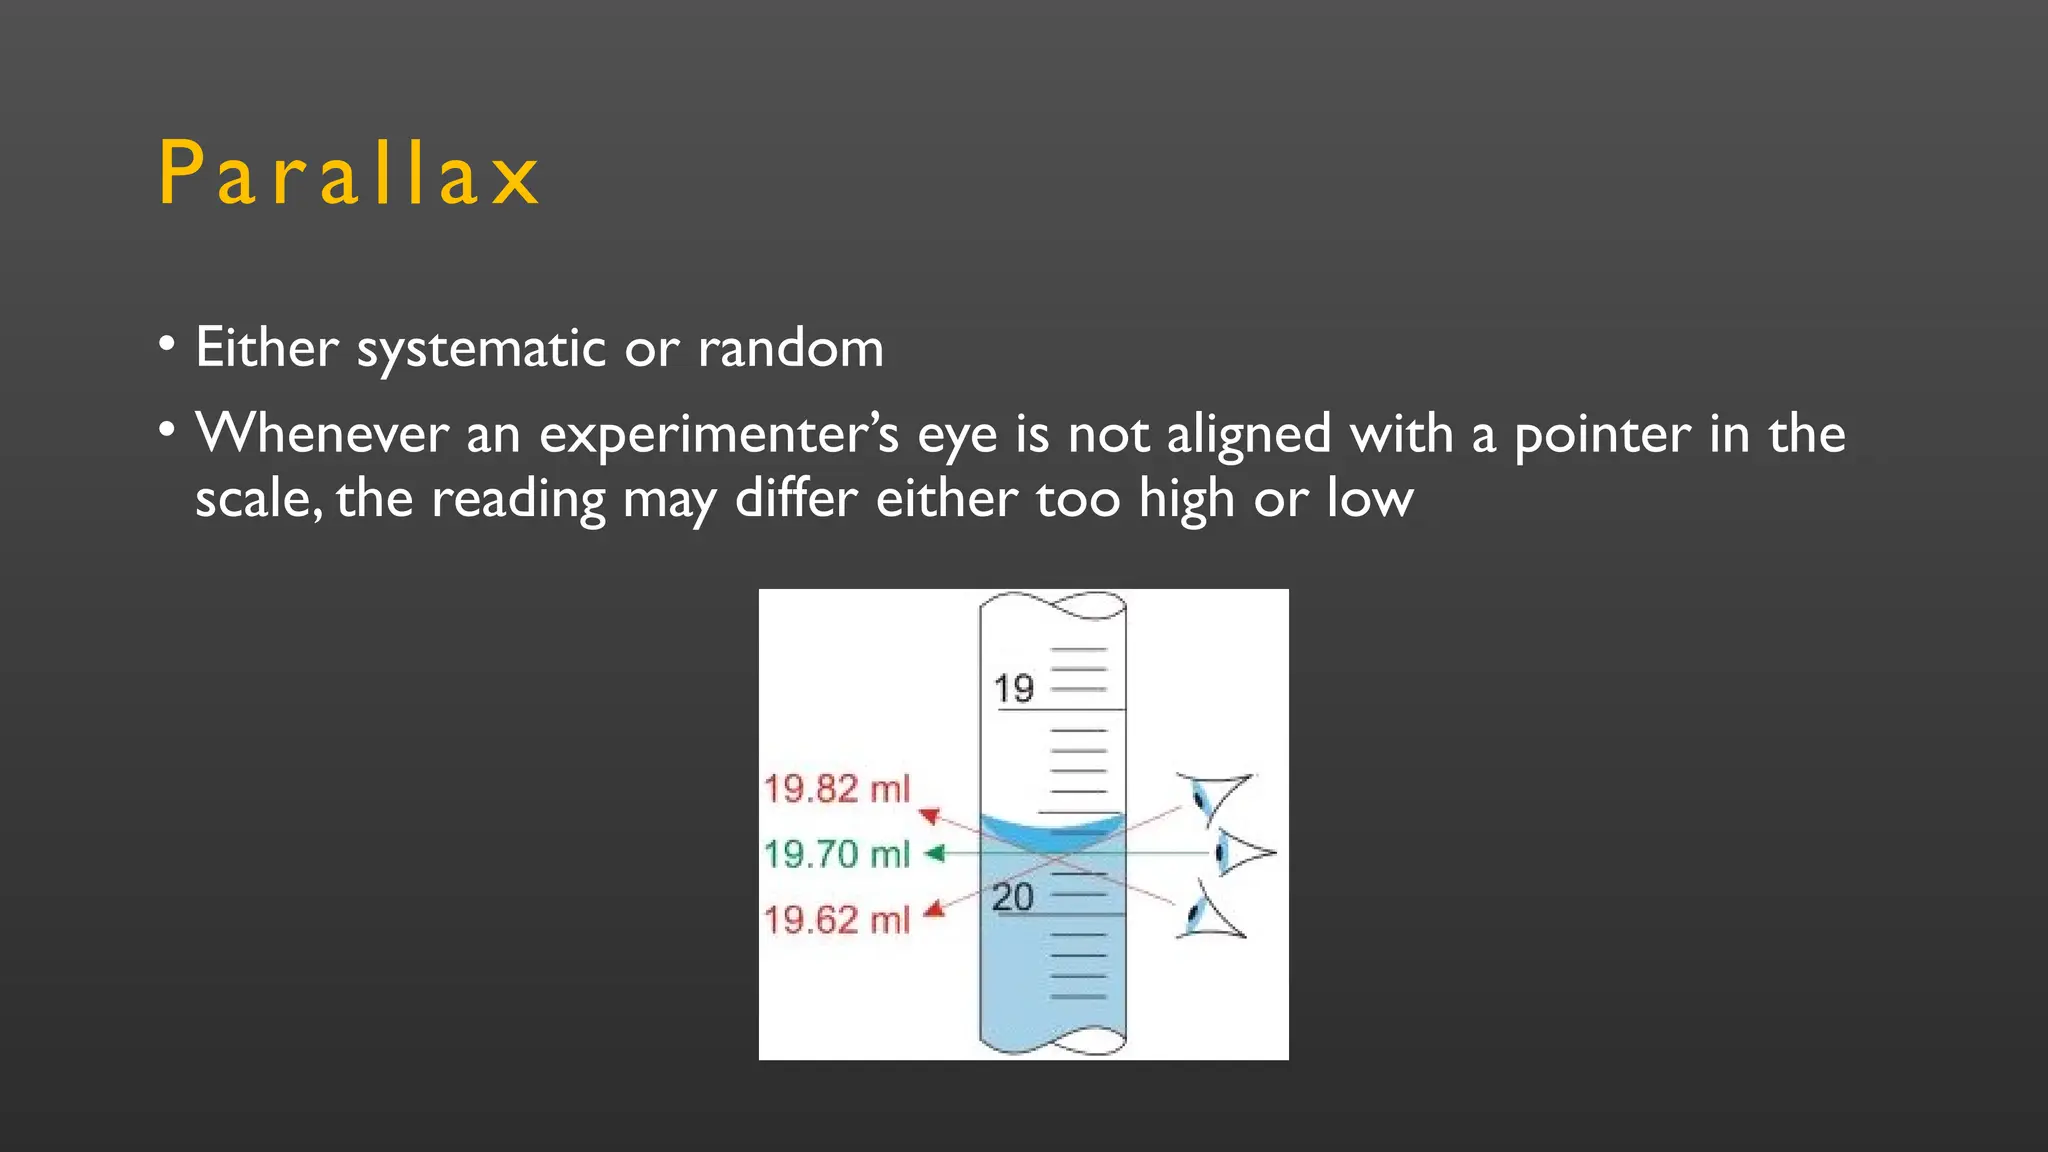
Parallax
• Either systematicor random
• Whenever an experimenter’s eye is not aligned with a pointer in the
scale, the reading may differ either too high or low
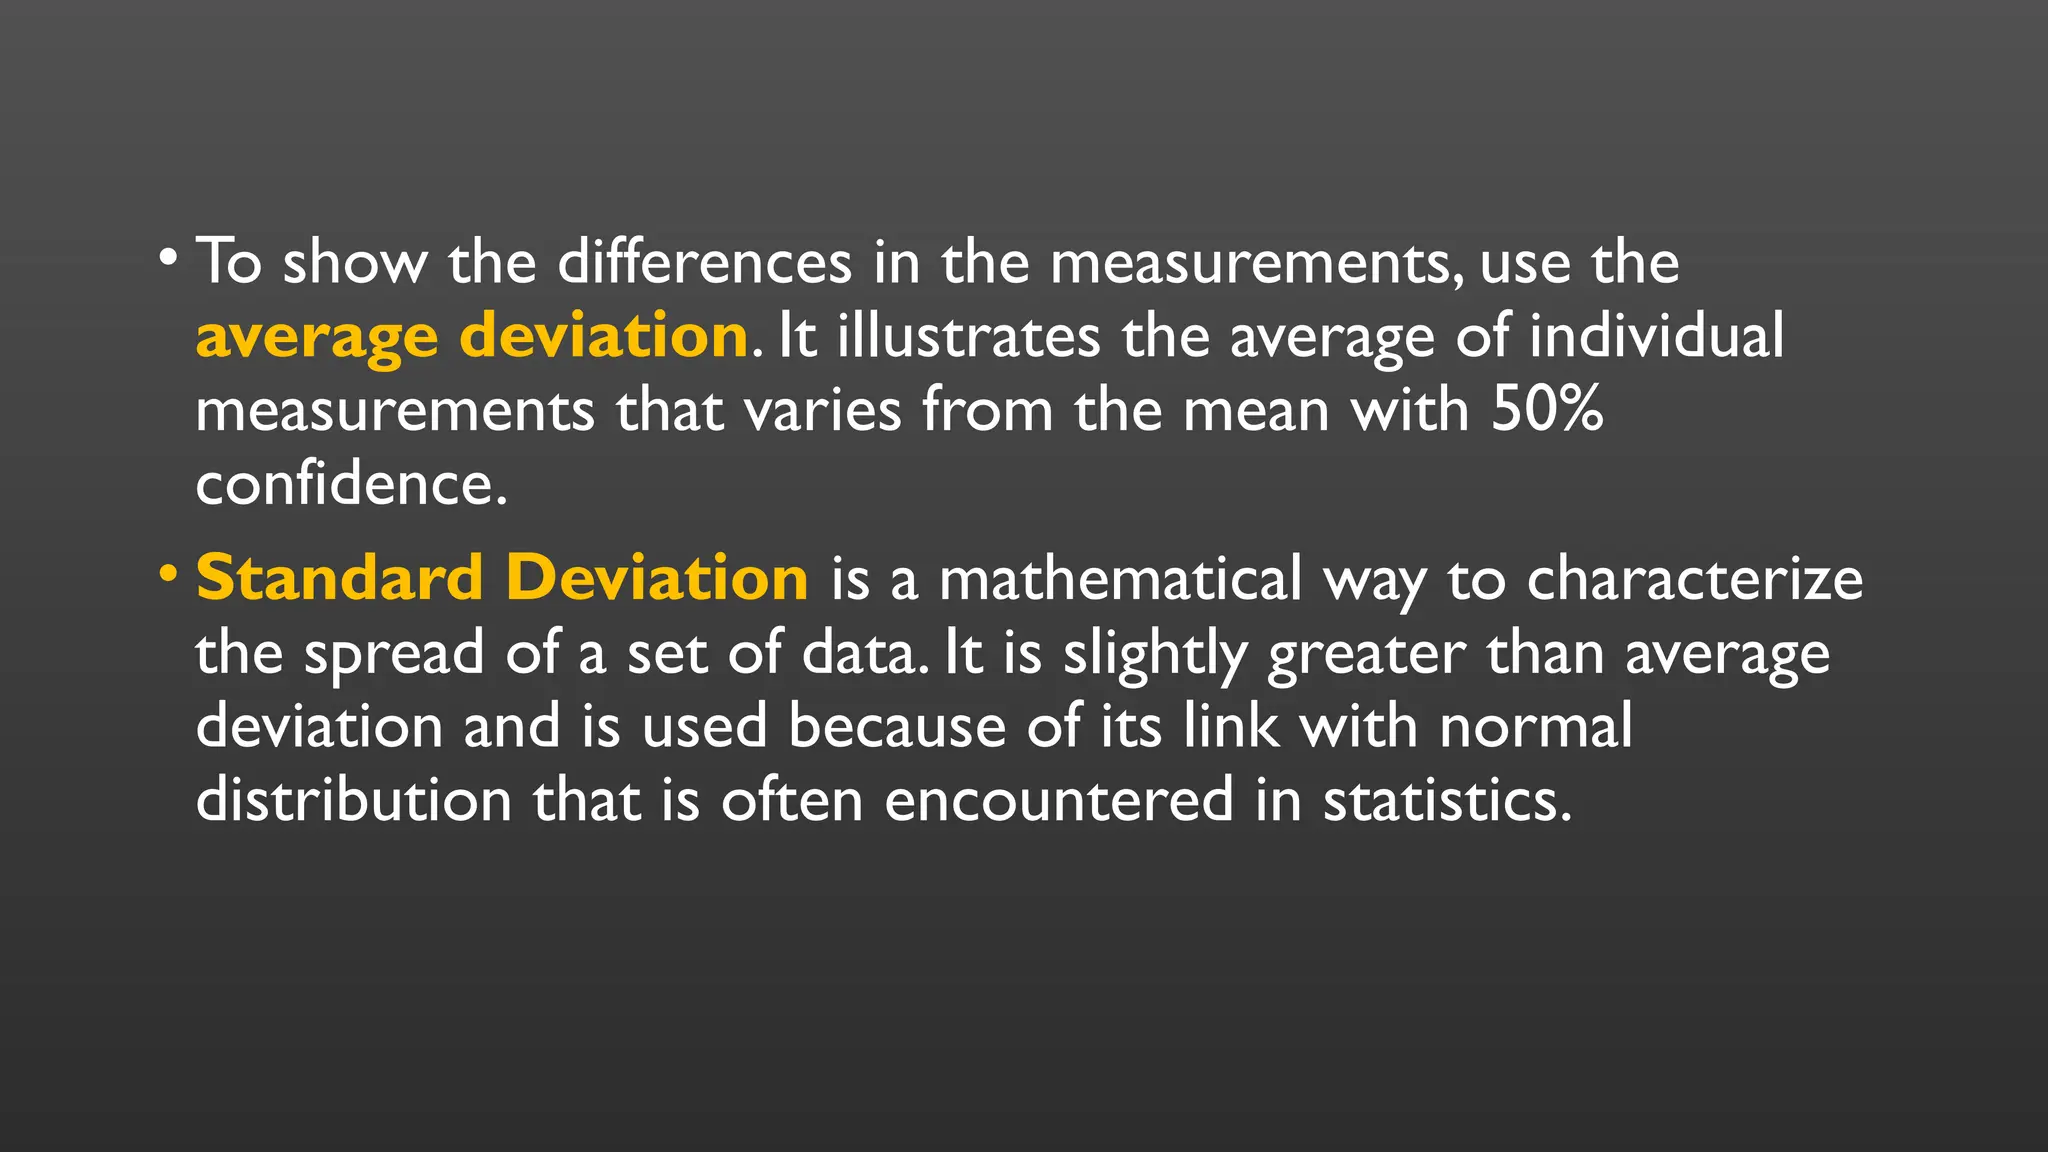
• To showthe differences in the measurements, use the
average deviation. It illustrates the average of individual
measurements that varies from the mean with 50%
confidence.
• Standard Deviation is a mathematical way to characterize
the spread of a set of data. It is slightly greater than average
deviation and is used because of its link with normal
distribution that is often encountered in statistics.
42.
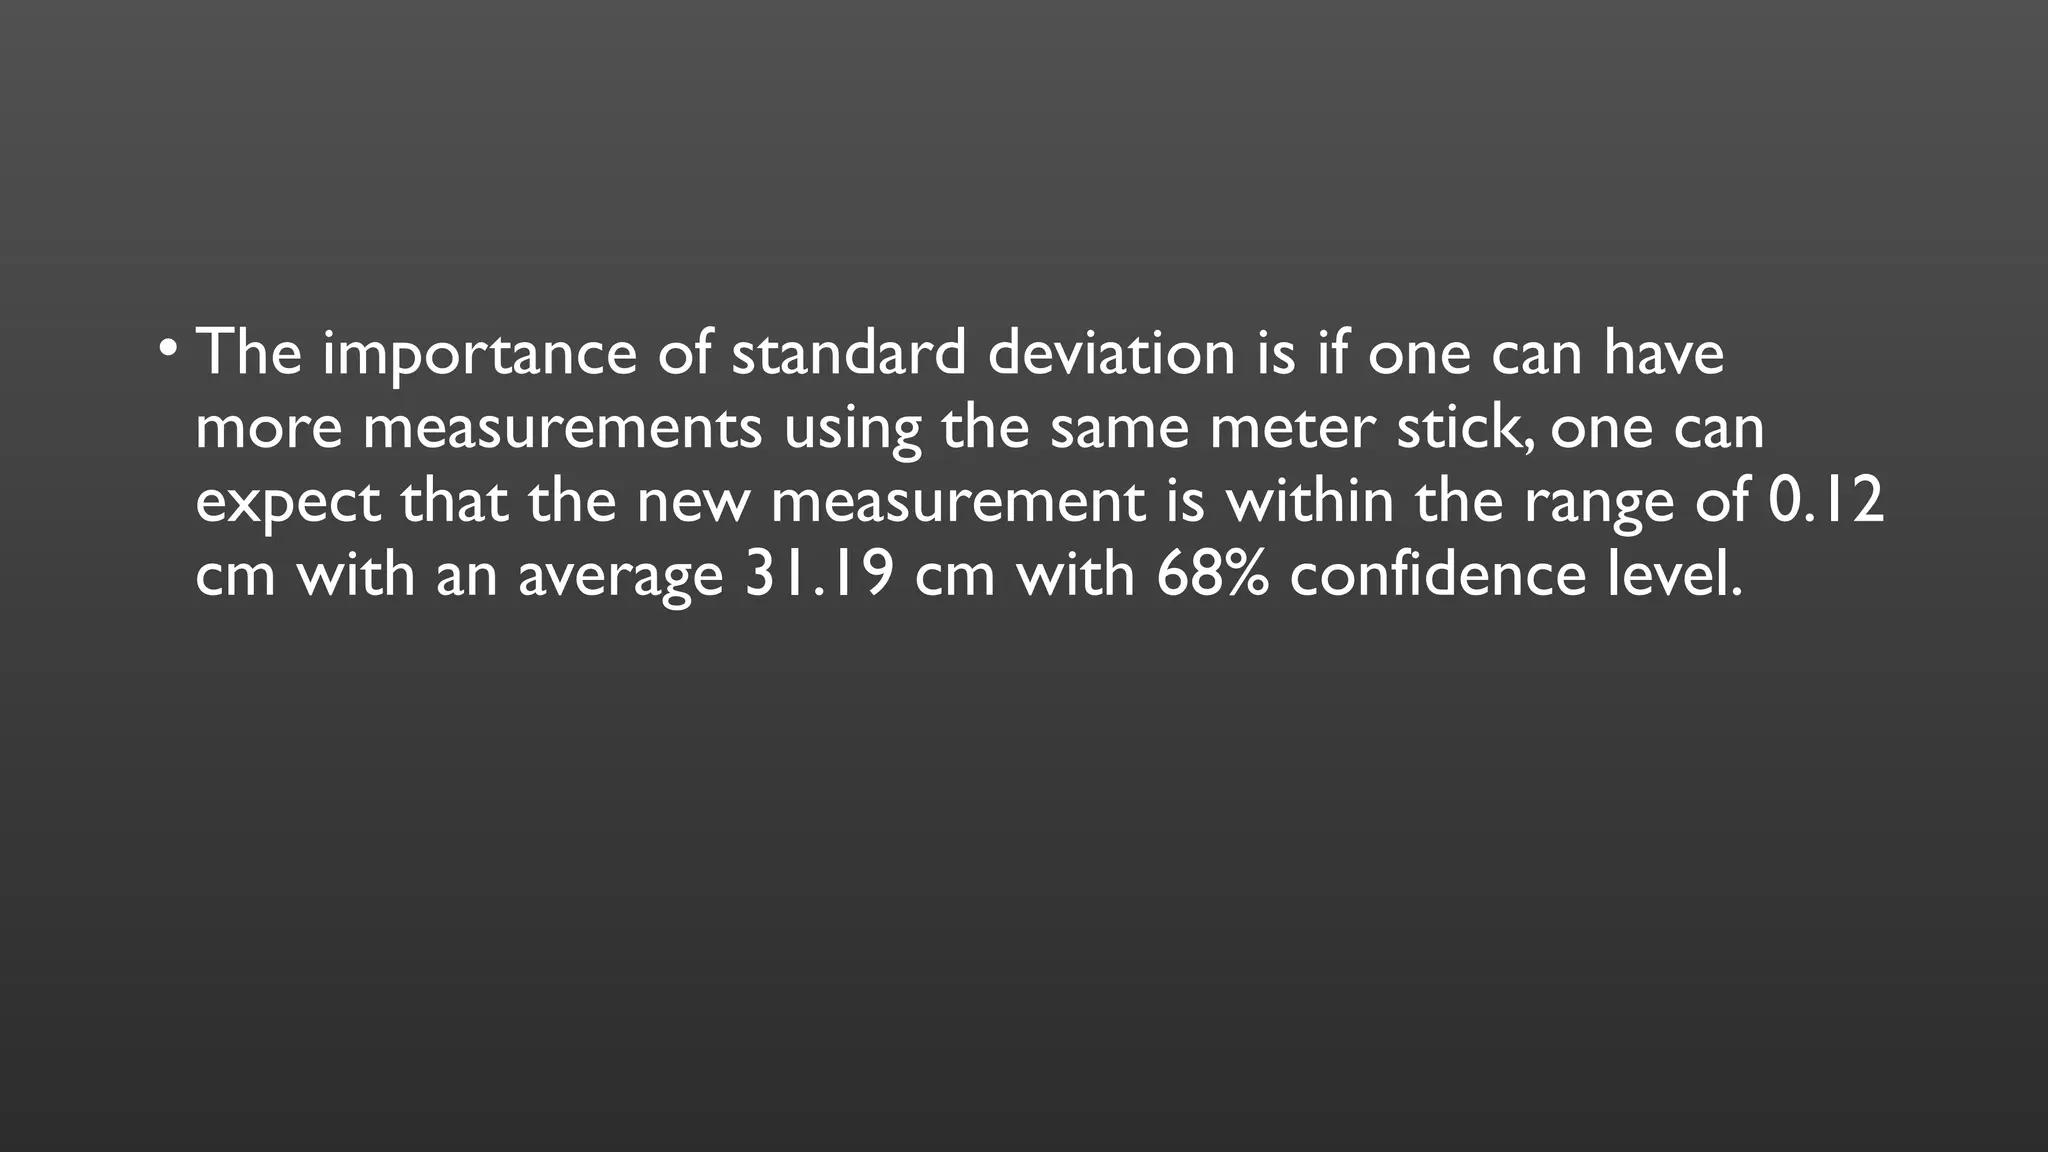
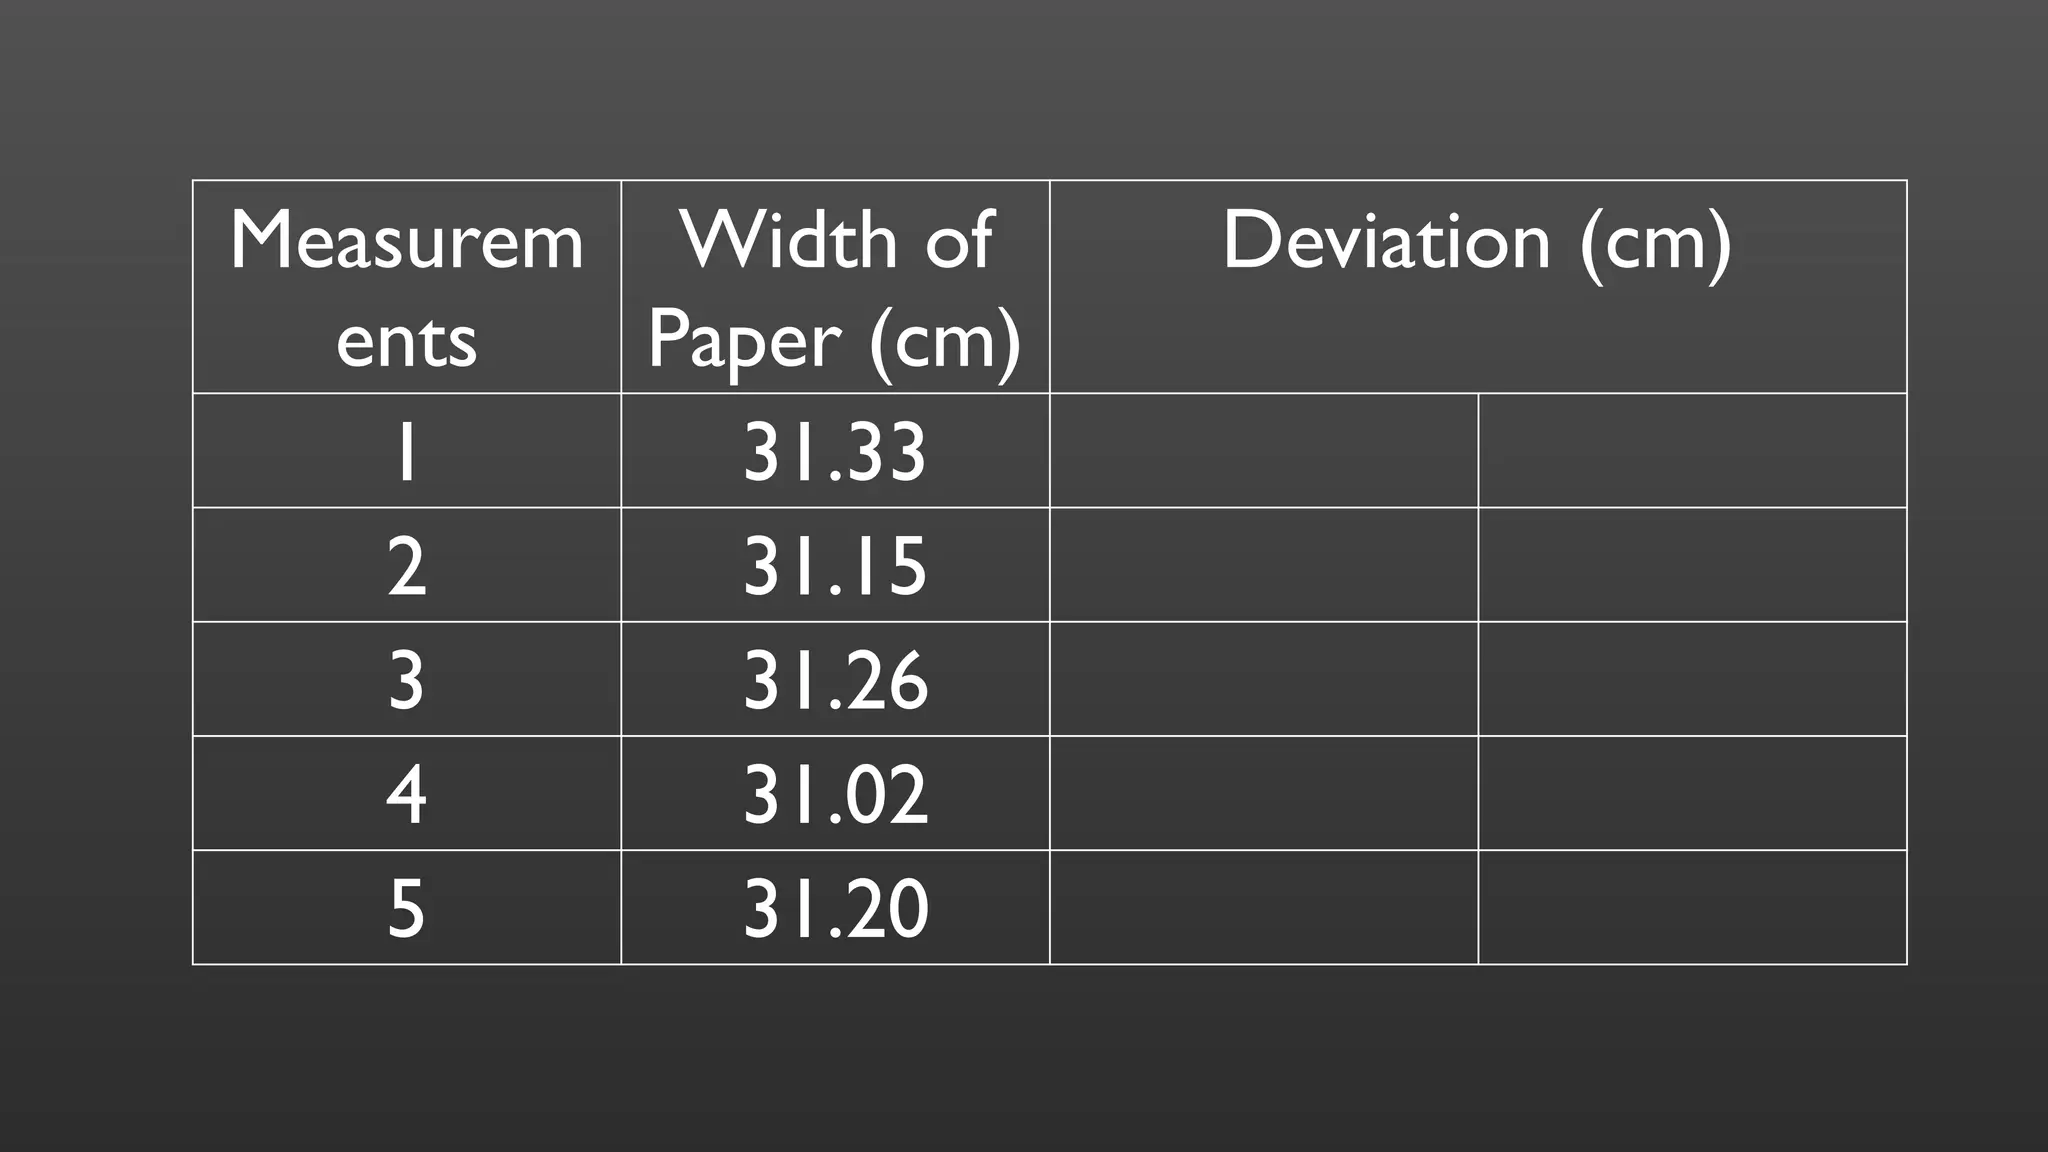
• The importanceof standard deviation is if one can have
more measurements using the same meter stick, one can
expect that the new measurement is within the range of 0.12
cm with an average 31.19 cm with 68% confidence level.
43.
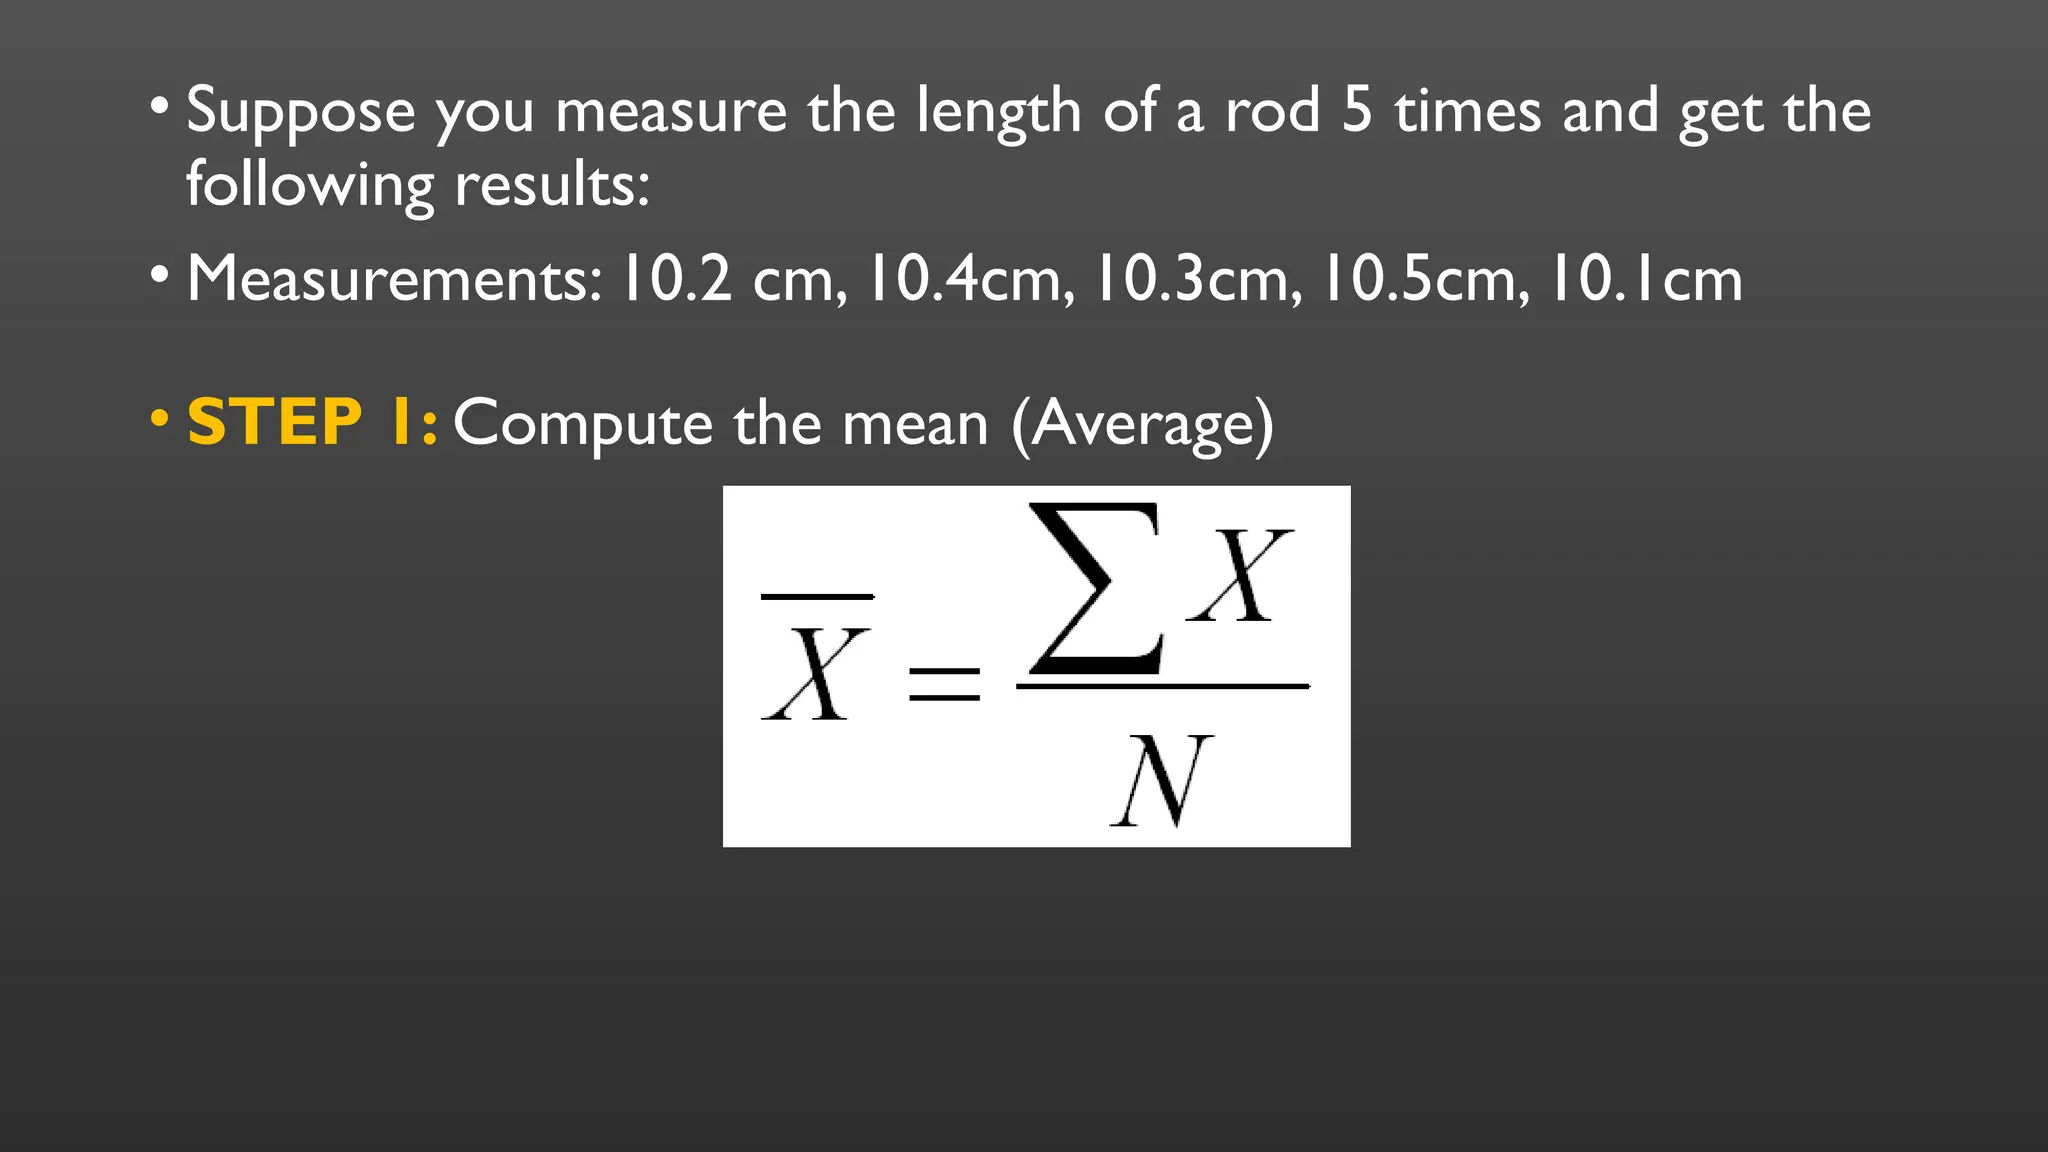
• Suppose youmeasure the length of a rod 5 times and get the
following results:
• Measurements: 10.2 cm, 10.4cm, 10.3cm, 10.5cm, 10.1cm
• STEP 1: Compute the mean (Average)
44.
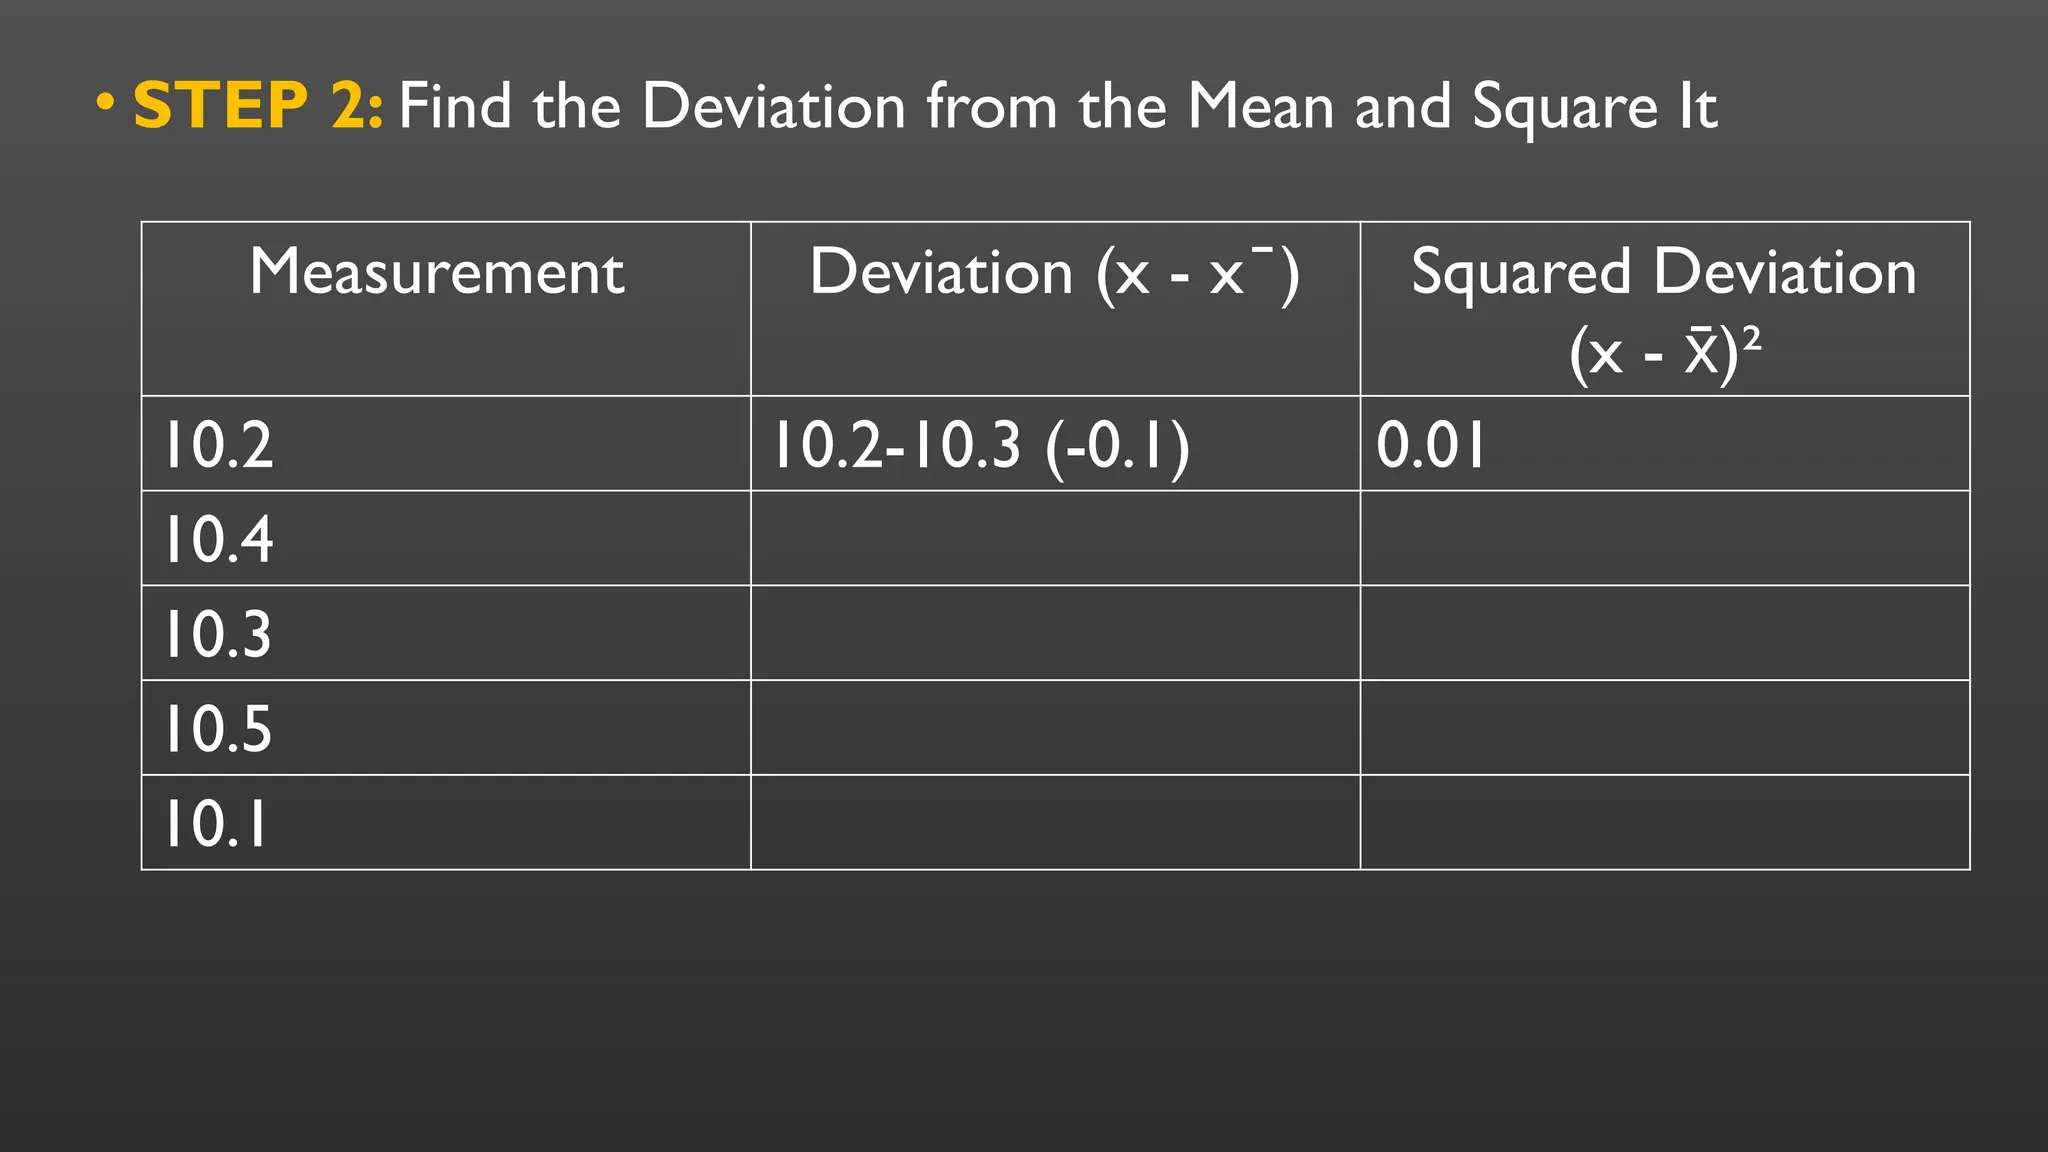
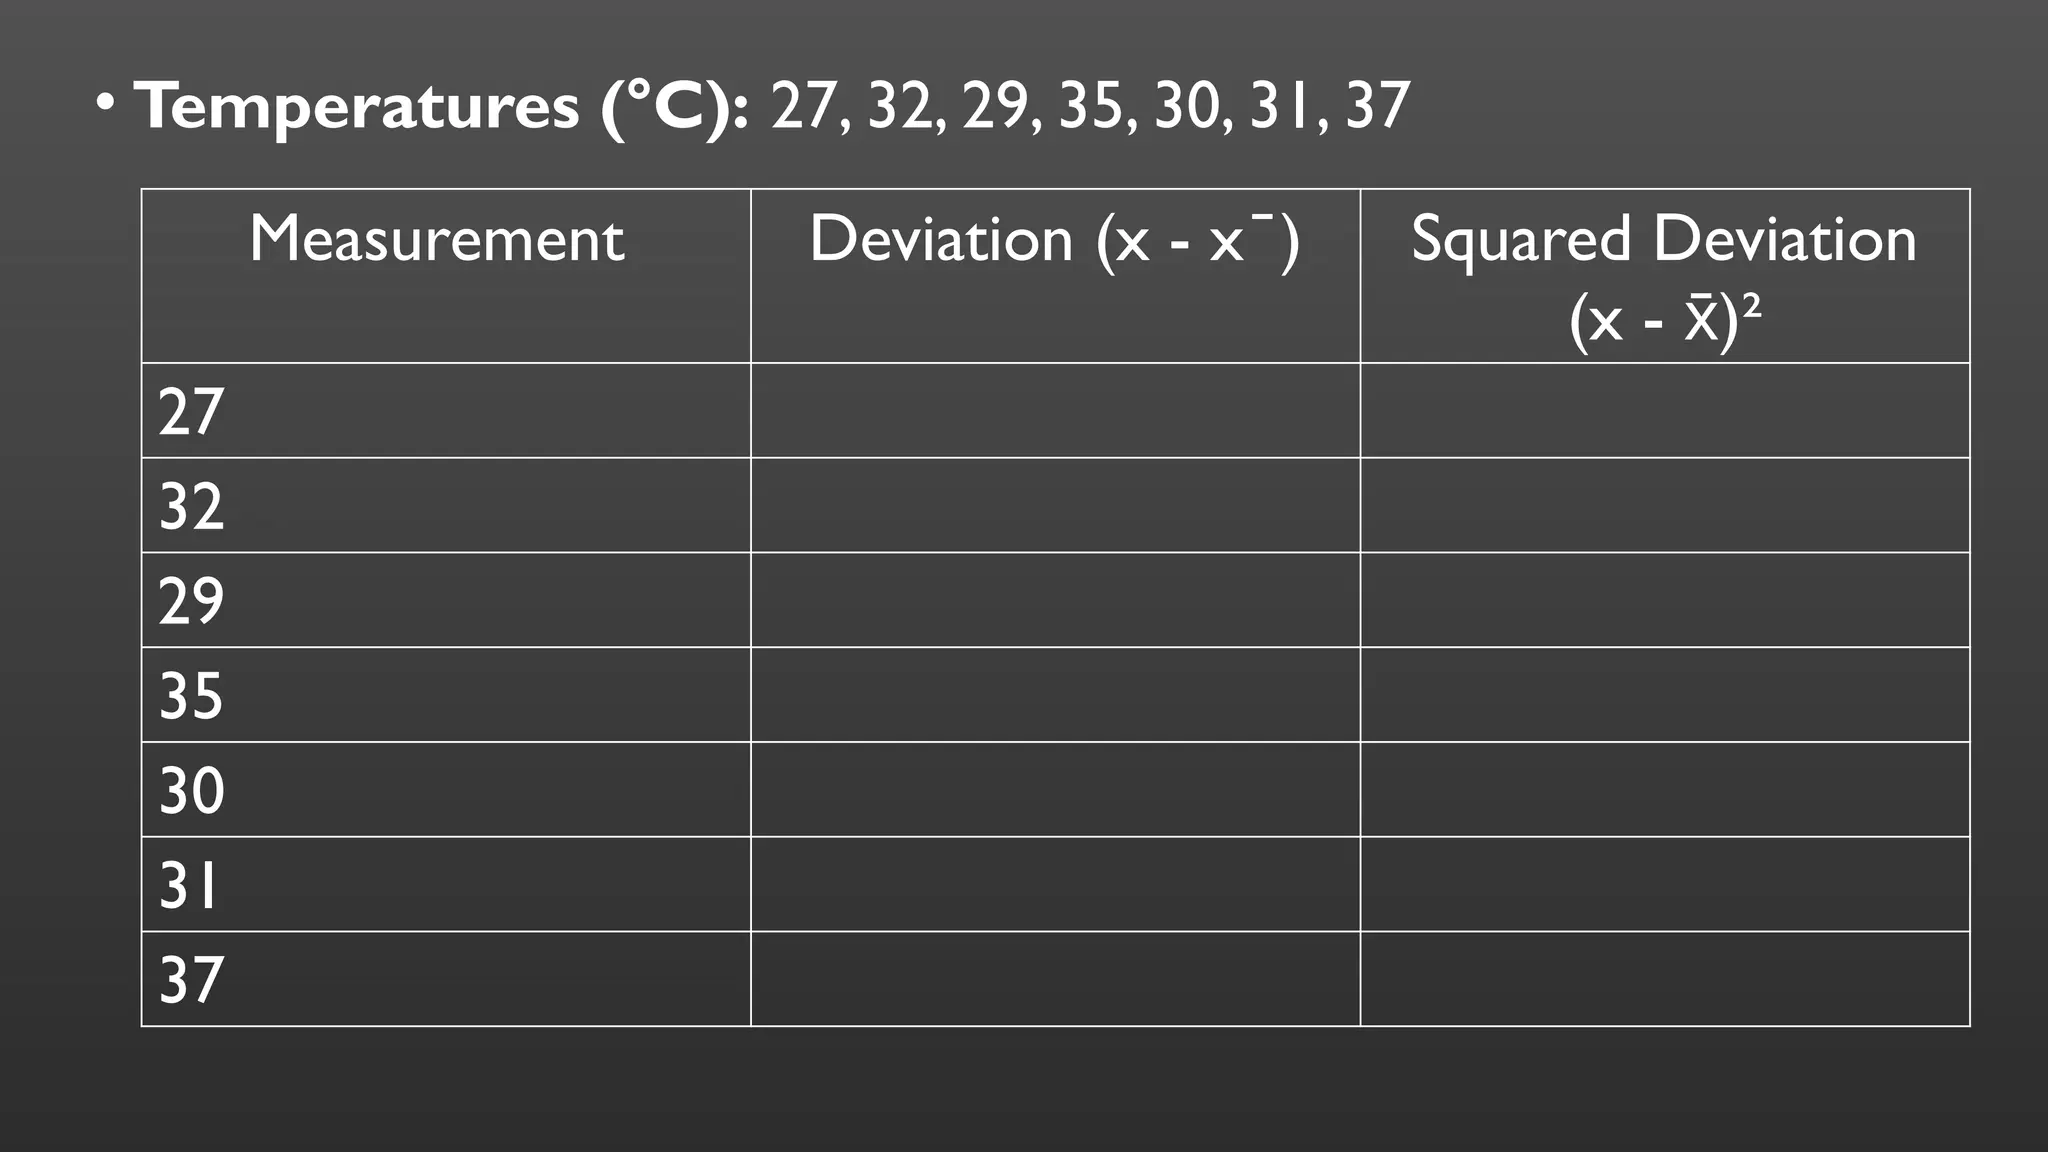
• STEP 2:Find the Deviation from the Mean and Square It
Measurement Deviation (x - x )
̄ Squared Deviation
(x - )²
x
̄
10.2 10.2-10.3 (-0.1) 0.01
10.4
10.3
10.5
10.1
45.
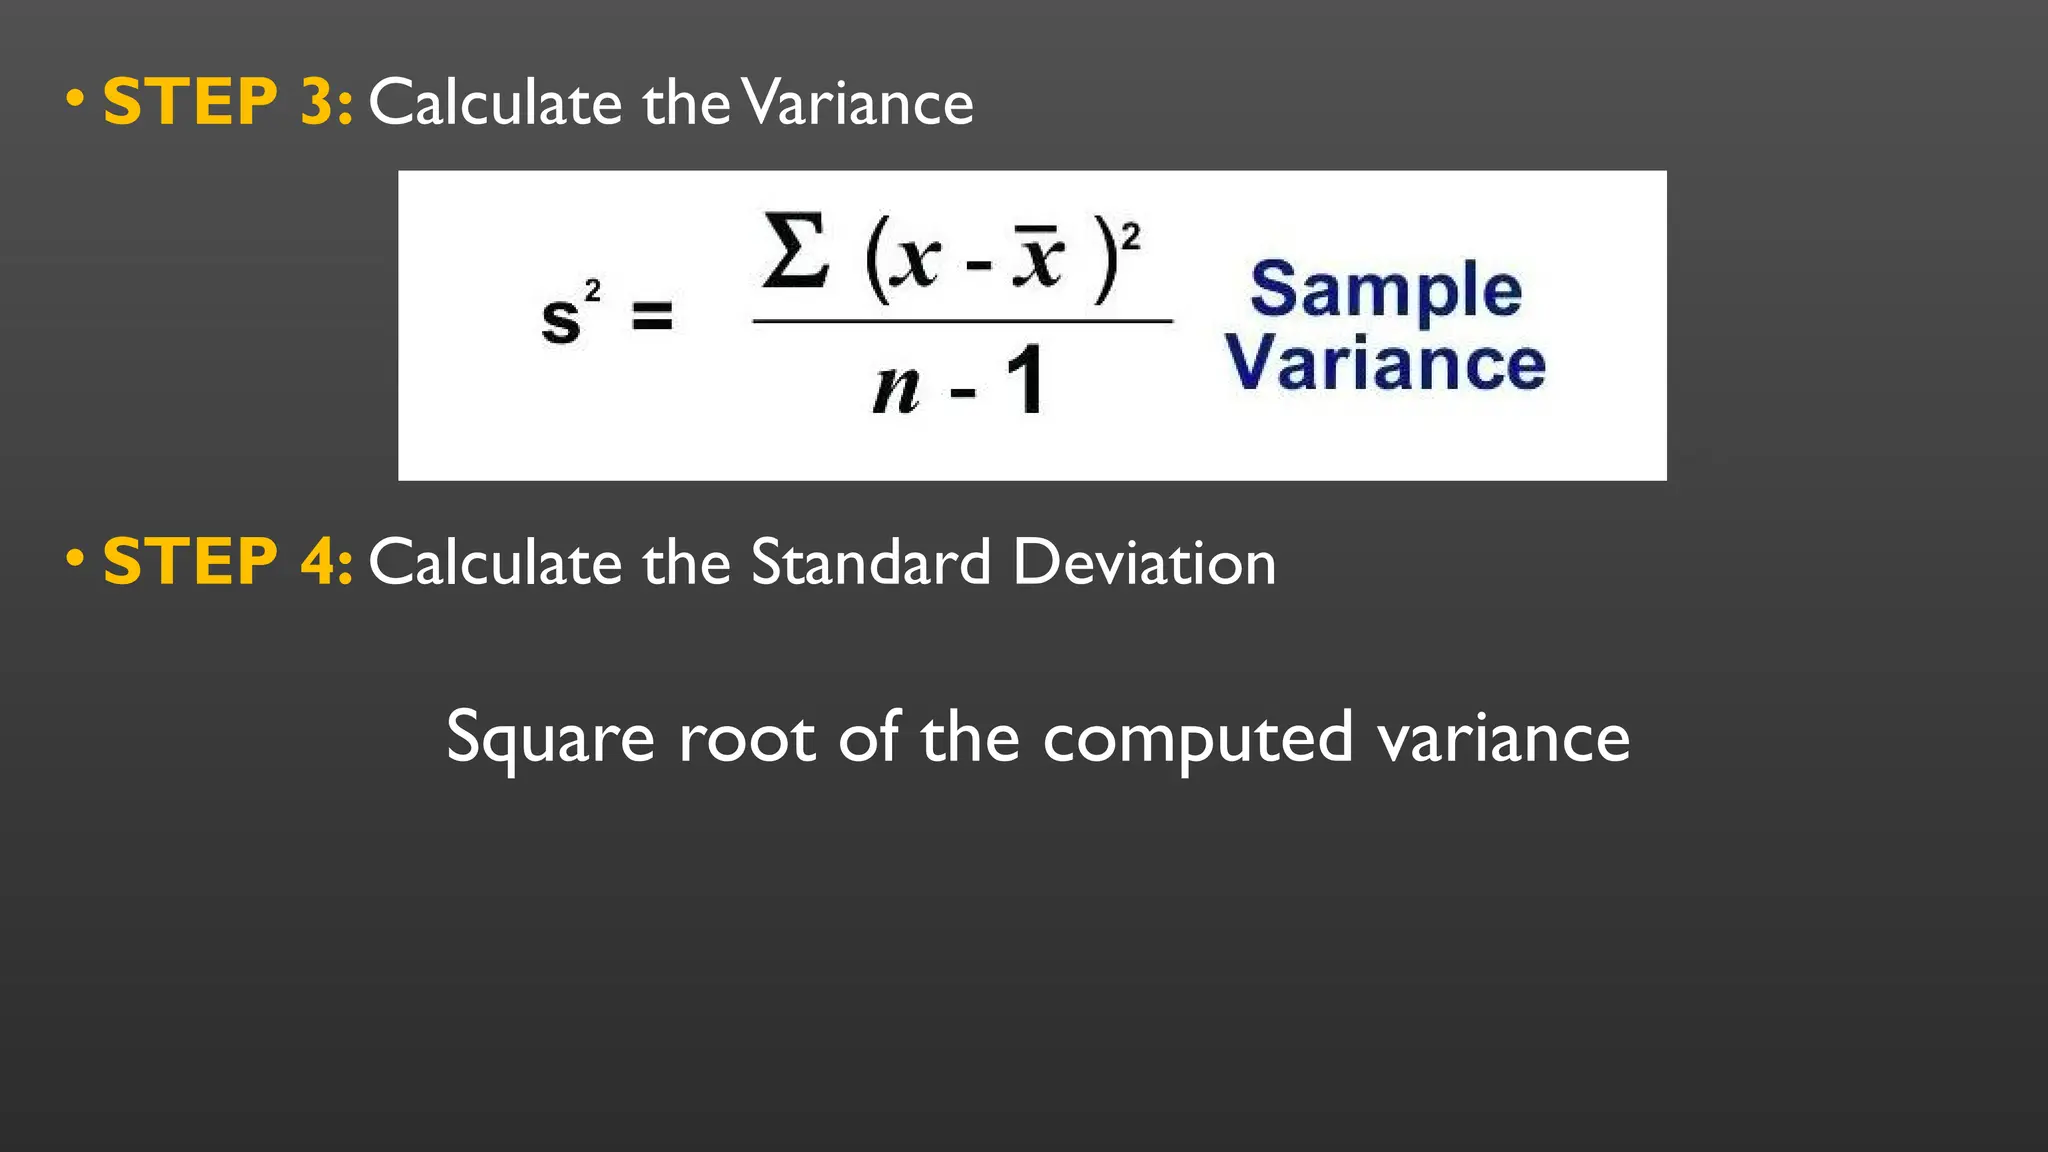
• STEP 4:Calculate the Standard Deviation
• STEP 3: Calculate theVariance
Square root of the computed variance
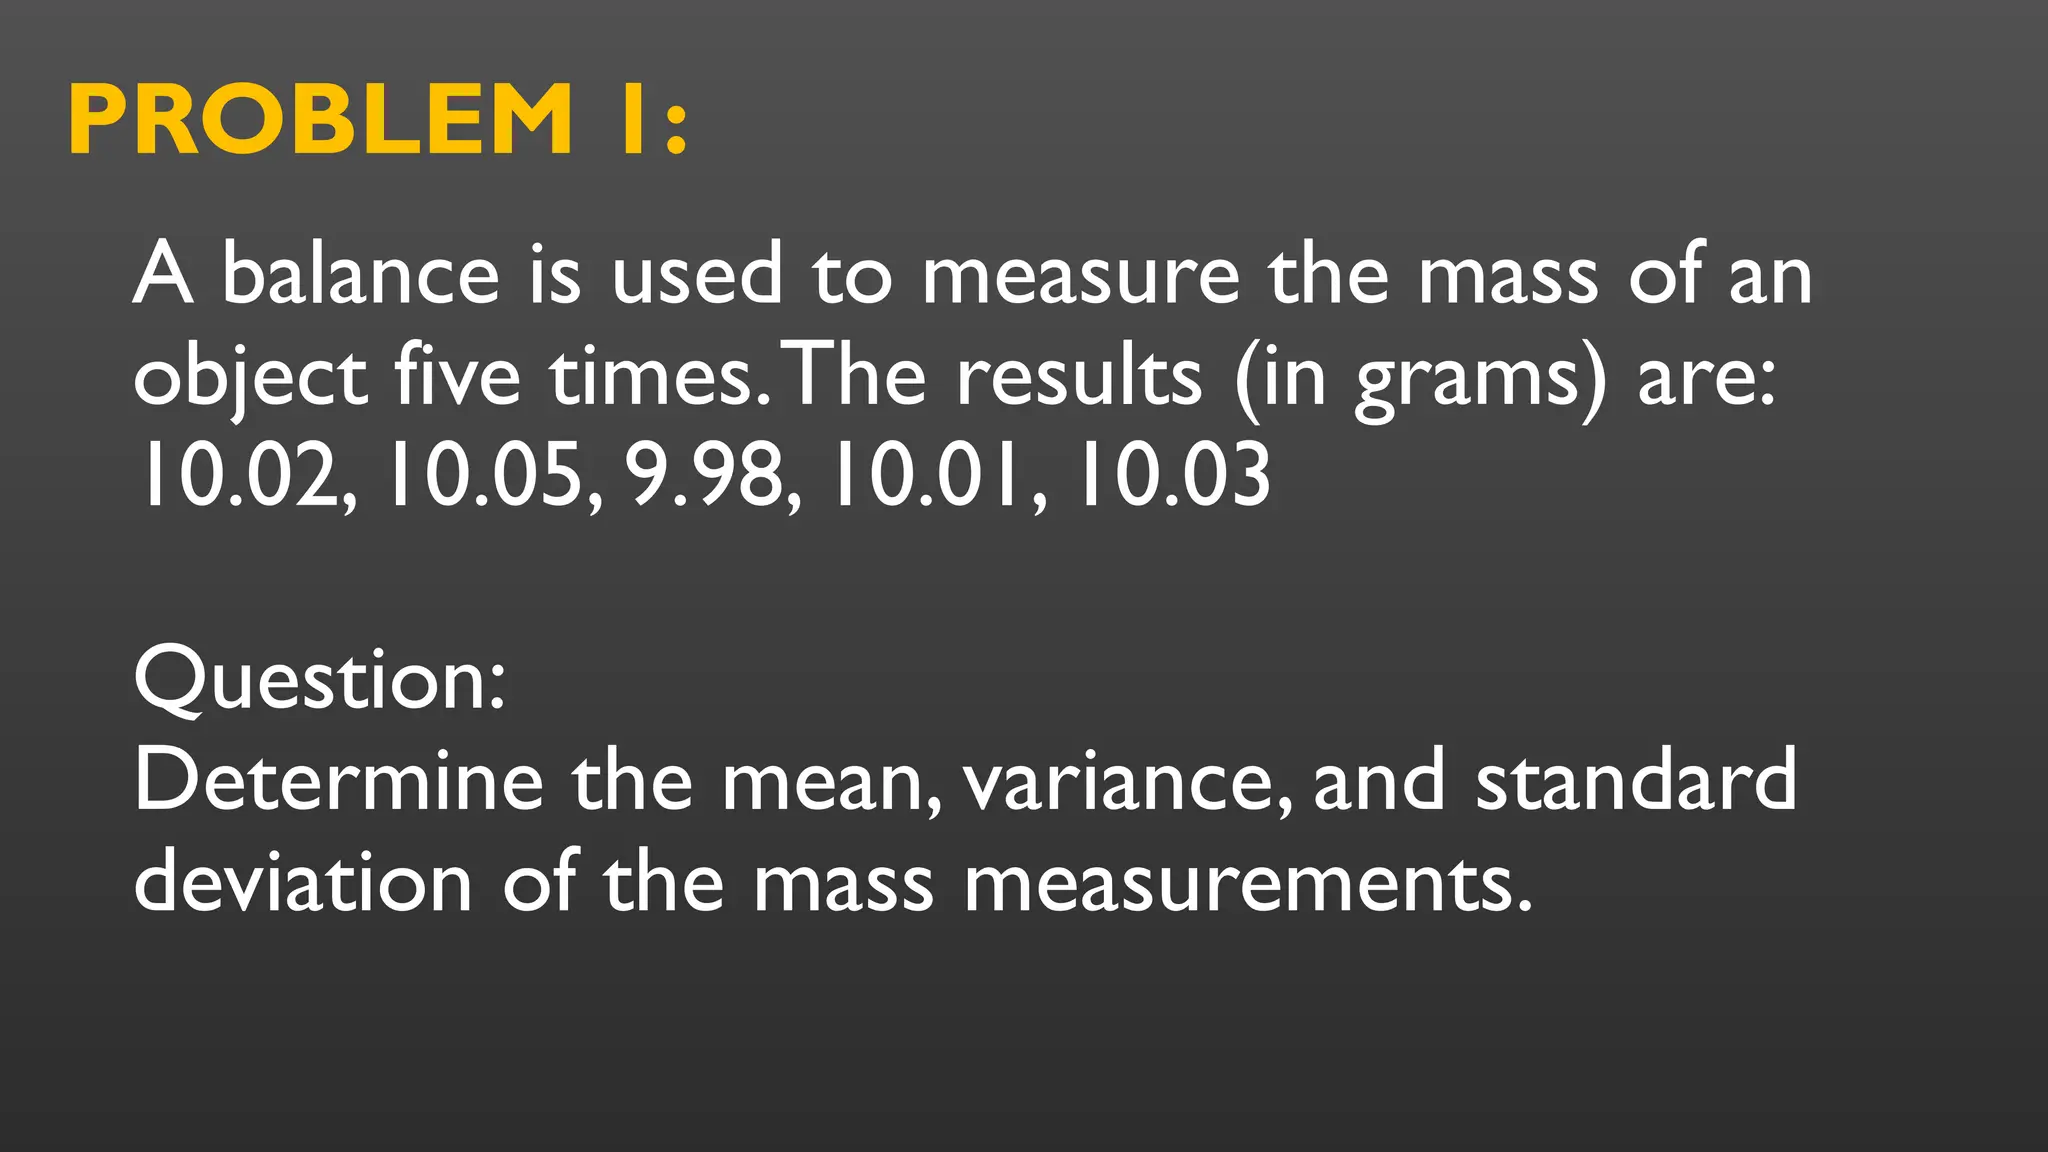
A balance isused to measure the mass of an
object five times.The results (in grams) are:
10.02, 10.05, 9.98, 10.01, 10.03
Question:
Determine the mean, variance, and standard
deviation of the mass measurements.
PROBLEM 1:
49.
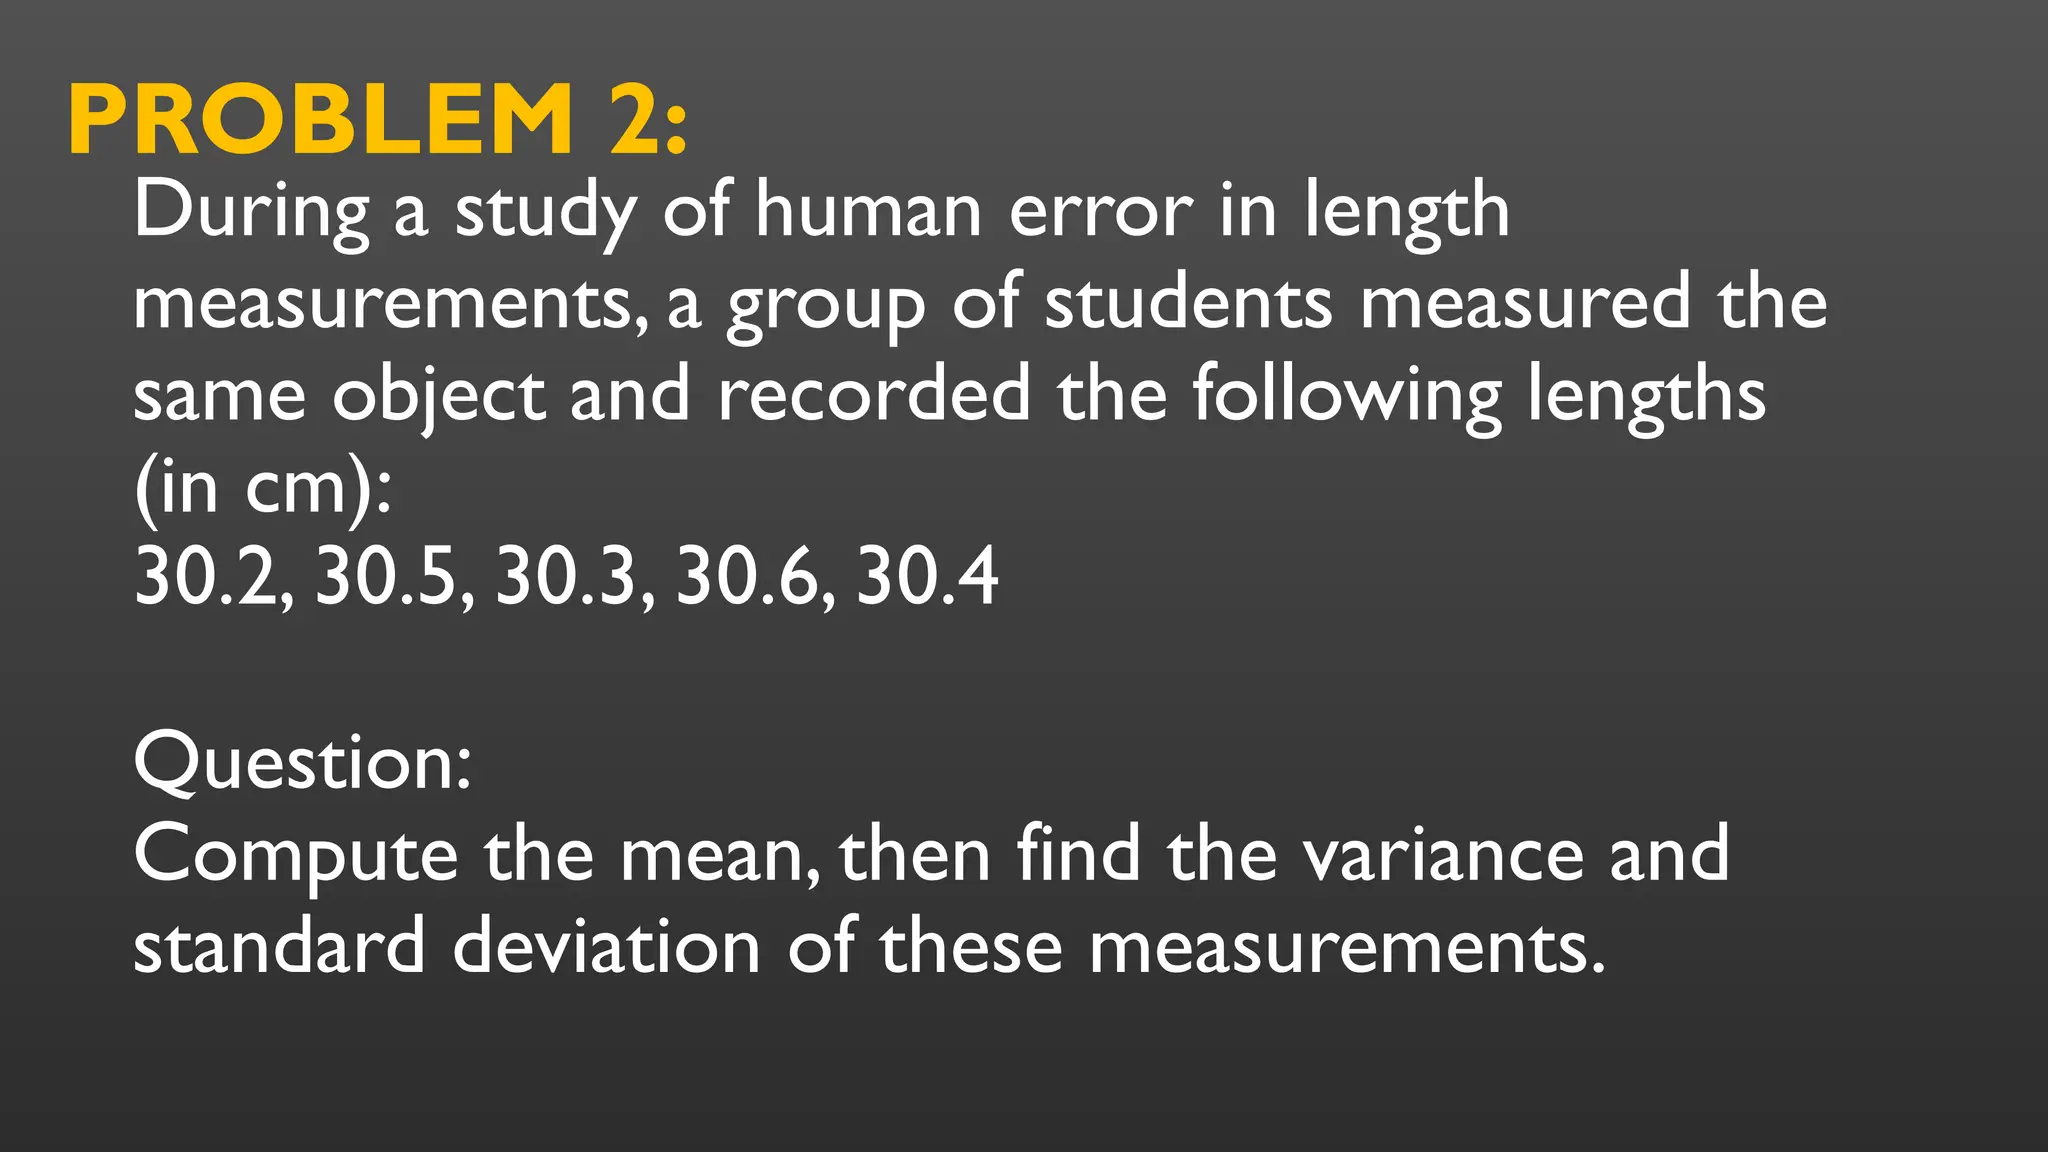
During a studyof human error in length
measurements, a group of students measured the
same object and recorded the following lengths
(in cm):
30.2, 30.5, 30.3, 30.6, 30.4
Question:
Compute the mean, then find the variance and
standard deviation of these measurements.
PROBLEM 2:
50.
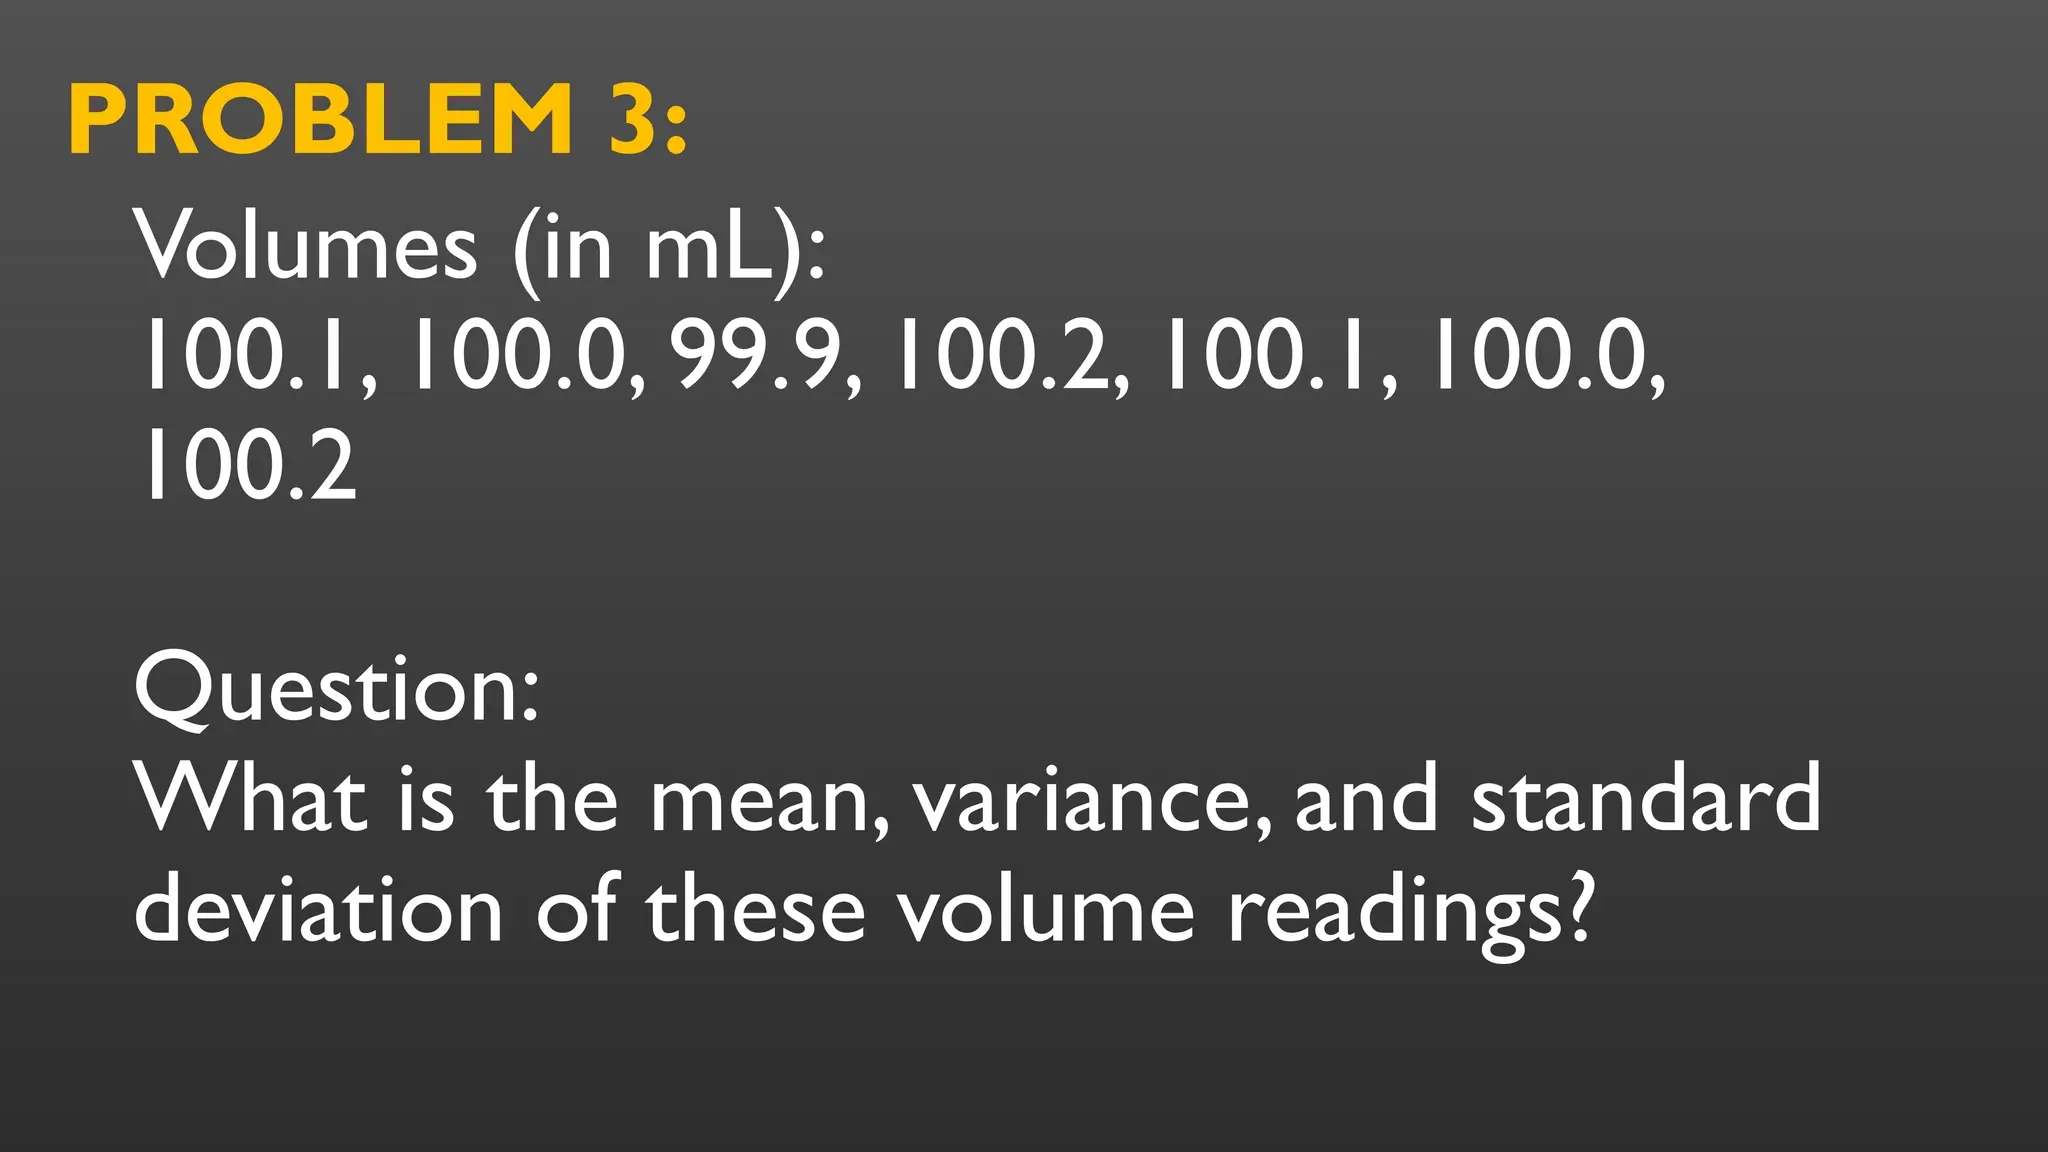
Volumes (in mL):
100.1,100.0, 99.9, 100.2, 100.1, 100.0,
100.2
Question:
What is the mean, variance, and standard
deviation of these volume readings?
PROBLEM 3: