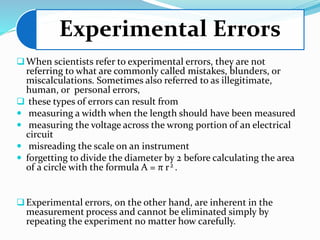
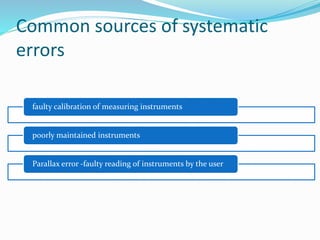
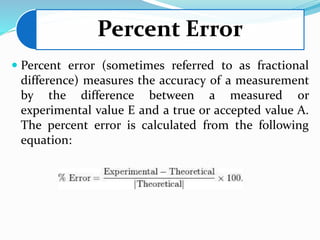
EXPERIMENTAL ERRORS
By -:Lovnish Thakur(IBT-2ND SEM)
ASU2014010100099
SCHOOL OF BIOSCIENCE
COURSE- Bioanalytical Techniques and
Instrumentation Level-I (BSBT 202)
Experimental error
Experimental error is the difference between a
measurement and the true value or between two
measured values.
Experimental error, itself, is measured by its accuracy
and precision.
Error analysis
Error analysis is the study of uncertainties in physical
measurements.
Through
some basic principles of error analysis, we
can:
 Understand how to measure experimental error
 Understand the types and sources of experimental
errors
 Clearly and correctly report measurements and the
uncertainties in those measurements
 Design experimental methods and techniques and
improve our measurement skills to reduce
experimental errors.
Accuracy and Precision
 Accuracy measures how close a measured value is to the
true value or accepted value. Since a true or accepted value
for a physical quantity may be unknown, it is sometimes
not possible to determine the accuracy of a measurement.
 Precision measures how closely two or more
measurements agree with other. Precision is sometimes
referred to as repeatability or reproducibility.
 A measurement which is highly reproducible tends to give
values which are very close to each other.
Experimental
Errors
Systematic
Errors
Random
Errors
Experimental Errors
When scientists refer to experimental errors, they are not
referring to what are commonly called mistakes, blunders, or
miscalculations. Sometimes also referred to as illegitimate,
human, or personal errors,
 these types of errors can result from
 measuring a width when the length should have been measured
 measuring the voltage across the wrong portion of an electrical
circuit
 misreading the scale on an instrument
 forgetting to divide the diameter by 2 before calculating the area
of a circle with the formula A = π r2 .
Experimental errors, on the other hand, are inherent in the
measurement process and cannot be eliminated simply by
repeating the experiment no matter how carefully.
Systematic Errors
 Systematic Error refers to an error which is present for
every measurement of a given quantity; it may be caused
by a bias on the part of the experimenter, a miscalibrate or
even faulty measuring instrument, etc. Systematic errors
affect the accuracy of the experiment.
 Systematic errors cannot easily be analyzed by statistical
analysis.
Common sources of systematic
errors
faulty calibration of measuring instruments
poorly maintained instruments
Parallax error -faulty reading of instruments by the user
Random Errors
 Random Error refers to the spread in the values of a
physical quantity from one measurement of the quantity to
the next, caused by random fluctuations in the measured
value.
For example, in repeating measurements of the time taken
for a ball to fall through a given height, the varying initial
conditions, random fluctuations in air motion, the
variation of your reaction time in starting and stopping a
watch, etc., will lead to a significant spread in the times
obtained. This type of error also affects the precision of the
experiment.
 Random errors are easily analyzed by statistical analysis.
Common sources of random errors
problems estimating a quantity that lies between the
graduations (the lines) on an instrument and the
inability to read an instrument
unpredictable fluctuations in line voltage, temperature, or
mechanical vibrations of equipment.
Systematic
Errors
affect the
accuracy of a
measurement
one-sided
errors
Random
Errors
affect the
precision of a
measurement
two-sided
errors
The absence of other types of errors,
repeated measurements yield results that
differ from the true or accepted value by
the same amount
The absence of other types of errors,
repeated measurements yield results that
fluctuate above and below the true or
accepted value.
Calculating Experimental Error
 When a scientist reports the results of an experiment,
the report must describe the accuracy and precision of
the experimental measurements.
Some common ways to describe accuracy
and precision are described below.
Significant Figures
 The least significant digit in a measurement depends on the
smallest unit which can be measured using the measuring
instrument.
 The precision of a measurement can then be estimated by the
number of significant digits with which the measurement is
reported.
 For example, a measurement of length using a meter stick with 1-
mm graduations will be reported with a precision of ±0.1 mm.
 A measurement of volume using a graduated cylinder with 1-ml
graduations will be reported with a precision of ±0.1 ml.
Percent Error
 Percent error (sometimes referred to as fractional
difference) measures the accuracy of a measurement
by the difference between a measured or
experimental value E and a true or accepted value A.
The percent error is calculated from the following
equation:
Percent Difference
 Percent difference measures precision of two
measurements by the difference between the
measured or experimental values E1 and E2 expressed
as a fraction the average of the two values. The
equation to use to calculate the percent difference is:
Mean
 When a measurement is repeated several times, we see
the measured values are grouped around some central
value.
 The mean is simply the sum of the measured values
divided by the number of measured values.
References
 http://www.ece.rochester.edu/courses/ECE111/error_uncert
ainty.pdf
 John R. Taylor, An Introduction to Error Analysis: The
Study of Uncertainties in Physical Measurements, 2d
Edition, University Science Books, 1997
 • Philip R. Bevington and D. Keith Robinson, Data
Reduction and Error Analysis for the Physical Sciences, 2d
Edition, WCB/McGraw-Hill, 1992
 http://www.physics.nmsu.edu/research/lab110g/html/ERR
ORS.html
THANK YOU

Error analytical

  • 1.
    EXPERIMENTAL ERRORS By -:LovnishThakur(IBT-2ND SEM) ASU2014010100099 SCHOOL OF BIOSCIENCE COURSE- Bioanalytical Techniques and Instrumentation Level-I (BSBT 202)
  • 2.
    Experimental error Experimental erroris the difference between a measurement and the true value or between two measured values. Experimental error, itself, is measured by its accuracy and precision.
  • 3.
    Error analysis Error analysisis the study of uncertainties in physical measurements.
  • 4.
    Through some basic principlesof error analysis, we can:  Understand how to measure experimental error  Understand the types and sources of experimental errors  Clearly and correctly report measurements and the uncertainties in those measurements  Design experimental methods and techniques and improve our measurement skills to reduce experimental errors.
  • 5.
    Accuracy and Precision Accuracy measures how close a measured value is to the true value or accepted value. Since a true or accepted value for a physical quantity may be unknown, it is sometimes not possible to determine the accuracy of a measurement.  Precision measures how closely two or more measurements agree with other. Precision is sometimes referred to as repeatability or reproducibility.  A measurement which is highly reproducible tends to give values which are very close to each other.
  • 6.
  • 7.
    Experimental Errors When scientistsrefer to experimental errors, they are not referring to what are commonly called mistakes, blunders, or miscalculations. Sometimes also referred to as illegitimate, human, or personal errors,  these types of errors can result from  measuring a width when the length should have been measured  measuring the voltage across the wrong portion of an electrical circuit  misreading the scale on an instrument  forgetting to divide the diameter by 2 before calculating the area of a circle with the formula A = π r2 . Experimental errors, on the other hand, are inherent in the measurement process and cannot be eliminated simply by repeating the experiment no matter how carefully.
  • 8.
    Systematic Errors  SystematicError refers to an error which is present for every measurement of a given quantity; it may be caused by a bias on the part of the experimenter, a miscalibrate or even faulty measuring instrument, etc. Systematic errors affect the accuracy of the experiment.  Systematic errors cannot easily be analyzed by statistical analysis.
  • 9.
    Common sources ofsystematic errors faulty calibration of measuring instruments poorly maintained instruments Parallax error -faulty reading of instruments by the user
  • 10.
    Random Errors  RandomError refers to the spread in the values of a physical quantity from one measurement of the quantity to the next, caused by random fluctuations in the measured value. For example, in repeating measurements of the time taken for a ball to fall through a given height, the varying initial conditions, random fluctuations in air motion, the variation of your reaction time in starting and stopping a watch, etc., will lead to a significant spread in the times obtained. This type of error also affects the precision of the experiment.  Random errors are easily analyzed by statistical analysis.
  • 11.
    Common sources ofrandom errors problems estimating a quantity that lies between the graduations (the lines) on an instrument and the inability to read an instrument unpredictable fluctuations in line voltage, temperature, or mechanical vibrations of equipment.
  • 12.
    Systematic Errors affect the accuracy ofa measurement one-sided errors Random Errors affect the precision of a measurement two-sided errors The absence of other types of errors, repeated measurements yield results that differ from the true or accepted value by the same amount The absence of other types of errors, repeated measurements yield results that fluctuate above and below the true or accepted value.
  • 13.
    Calculating Experimental Error When a scientist reports the results of an experiment, the report must describe the accuracy and precision of the experimental measurements.
  • 14.
    Some common waysto describe accuracy and precision are described below.
  • 15.
    Significant Figures  Theleast significant digit in a measurement depends on the smallest unit which can be measured using the measuring instrument.  The precision of a measurement can then be estimated by the number of significant digits with which the measurement is reported.  For example, a measurement of length using a meter stick with 1- mm graduations will be reported with a precision of ±0.1 mm.  A measurement of volume using a graduated cylinder with 1-ml graduations will be reported with a precision of ±0.1 ml.
  • 16.
    Percent Error  Percenterror (sometimes referred to as fractional difference) measures the accuracy of a measurement by the difference between a measured or experimental value E and a true or accepted value A. The percent error is calculated from the following equation:
  • 17.
    Percent Difference  Percentdifference measures precision of two measurements by the difference between the measured or experimental values E1 and E2 expressed as a fraction the average of the two values. The equation to use to calculate the percent difference is:
  • 18.
    Mean  When ameasurement is repeated several times, we see the measured values are grouped around some central value.  The mean is simply the sum of the measured values divided by the number of measured values.
  • 19.
    References  http://www.ece.rochester.edu/courses/ECE111/error_uncert ainty.pdf  JohnR. Taylor, An Introduction to Error Analysis: The Study of Uncertainties in Physical Measurements, 2d Edition, University Science Books, 1997  • Philip R. Bevington and D. Keith Robinson, Data Reduction and Error Analysis for the Physical Sciences, 2d Edition, WCB/McGraw-Hill, 1992  http://www.physics.nmsu.edu/research/lab110g/html/ERR ORS.html
  • 20.