There are two main types of errors in measurement: systematic errors, which always produce results in the same direction, and random errors, which occur unpredictably due to various factors. The accuracy of a measurement indicates how close it is to the accepted value, while the precision refers to the agreement between multiple measurements of the same quantity. Taking the average of repeated measurements reduces the impact of random errors, but the uncertainty in any measurement must be reported using plus-and-minus values to indicate the possible variance.
Error in MeasurementTypes of Error Systematic – one that always produces an error of the same sign; positive is a reading too high and negative error is a reading too low Random – occur as variations that are due to a large number of factors each of which adds to its own contribution of the total error. These errors are a matter of chance
3.
Types of SystematicError Instrumental Error – caused by faulty, inaccurate apparatus Personal Error – caused by some peculiarity or bias of the observer External Error – caused by external conditions (wind, temperature, humidity)
4.
Random Error Randomerrors are subject to the laws of chance. Taking a large number of observations may lessen their effect. When al errors are random, the value having the highest probability of being correct is the arithmetic mean or average.
5.
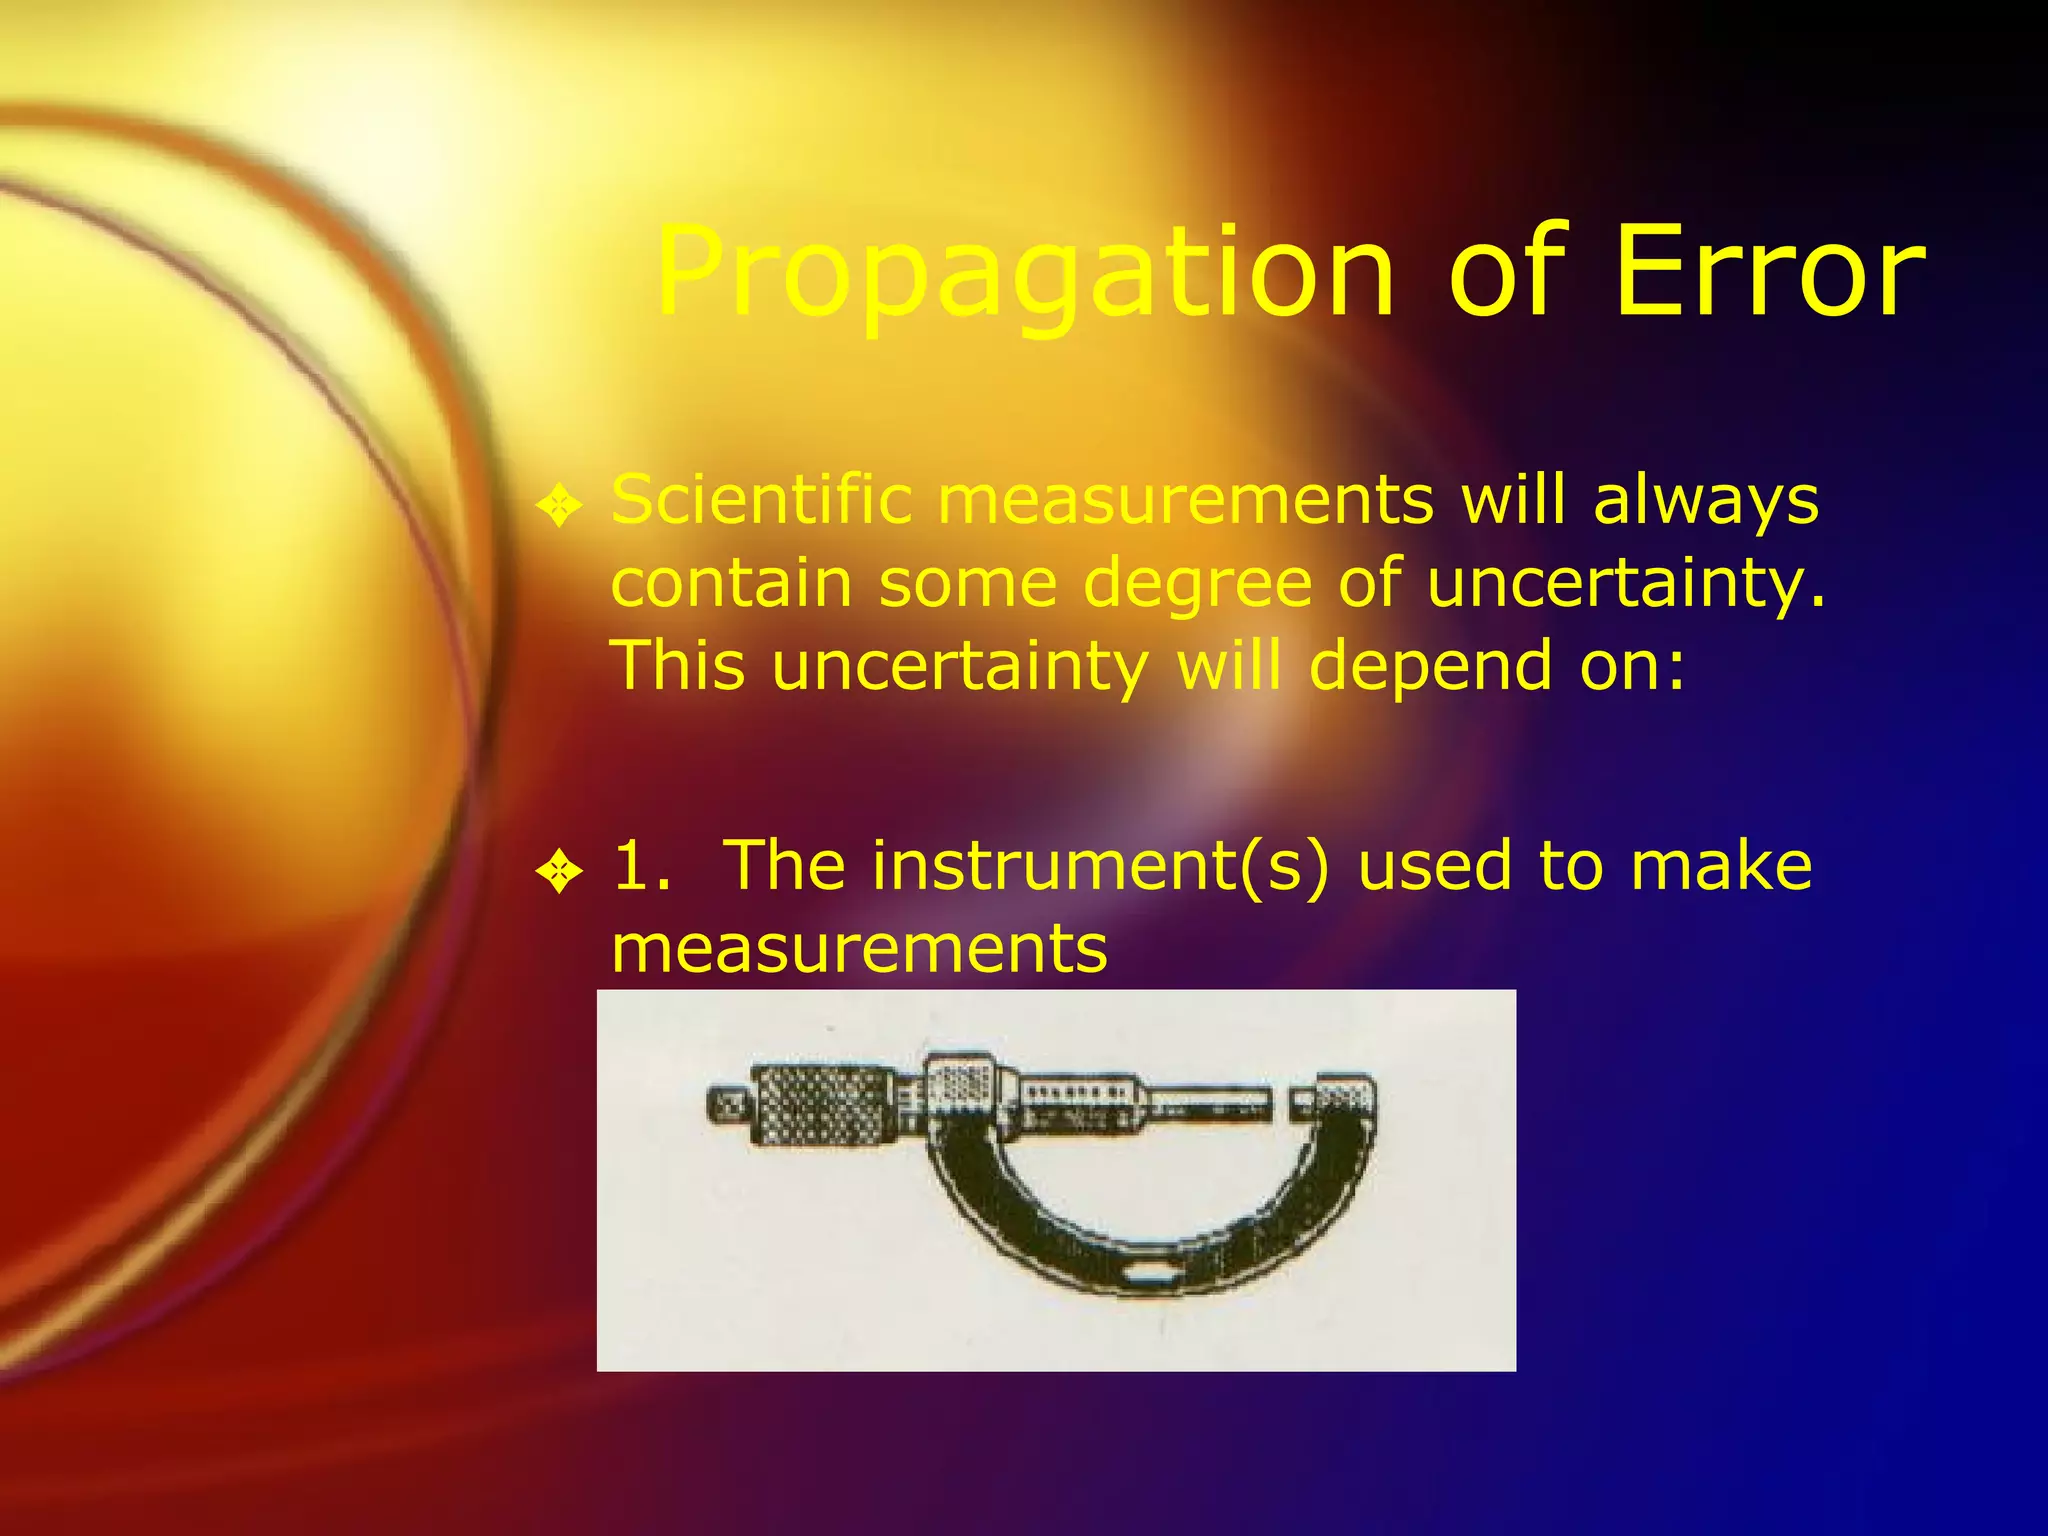
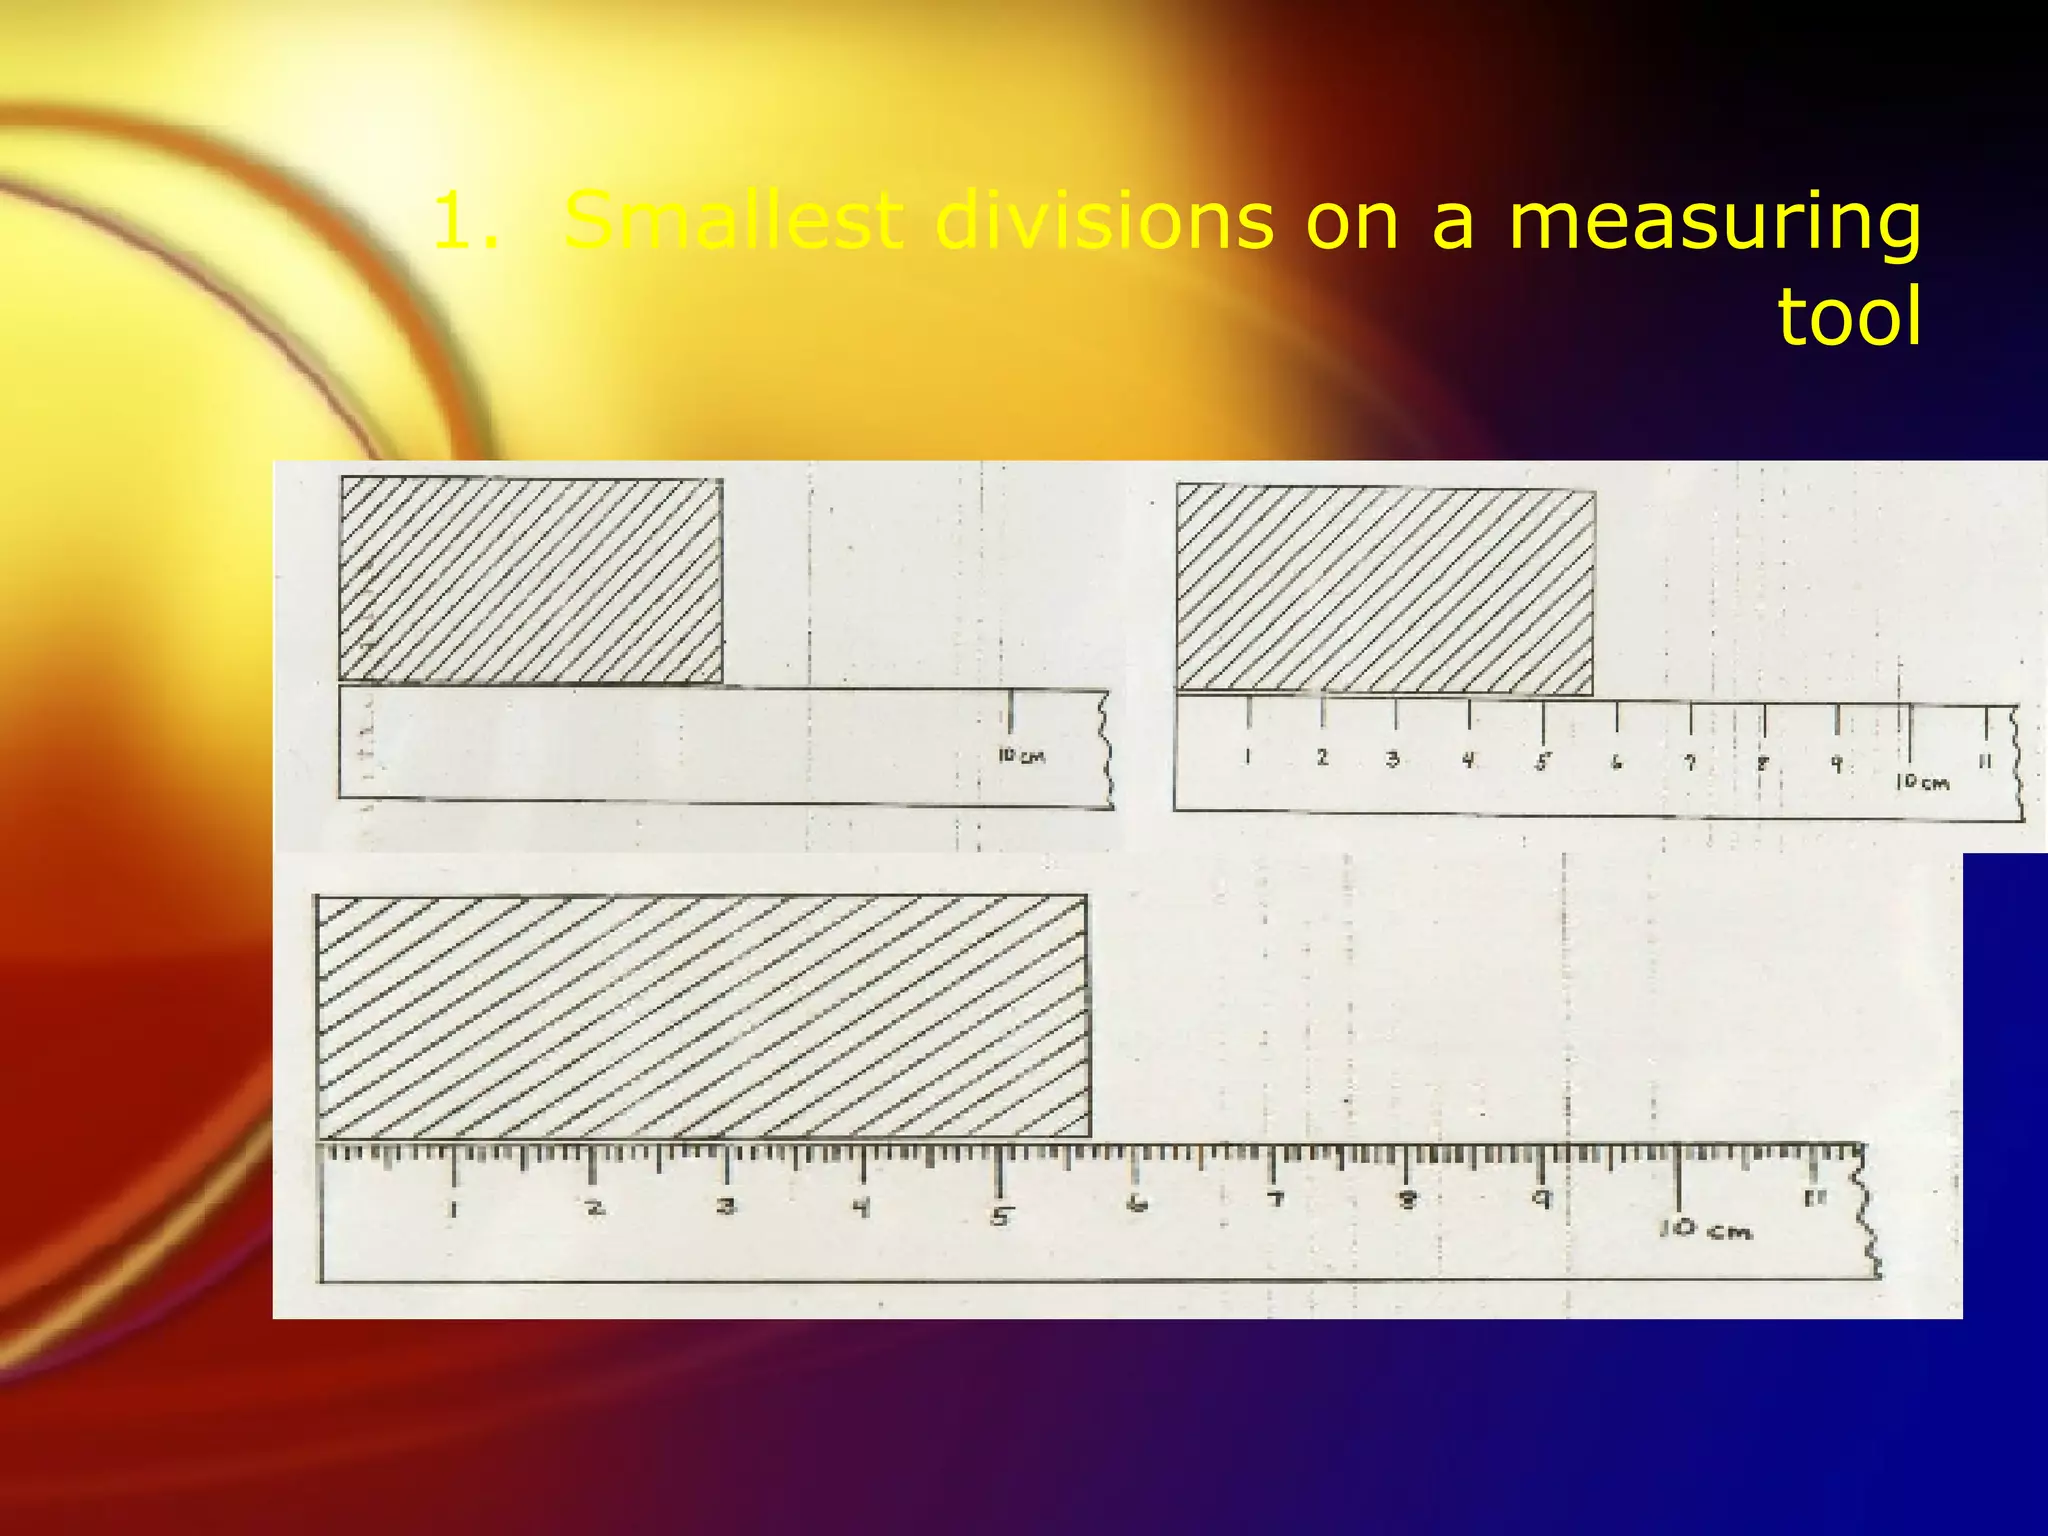
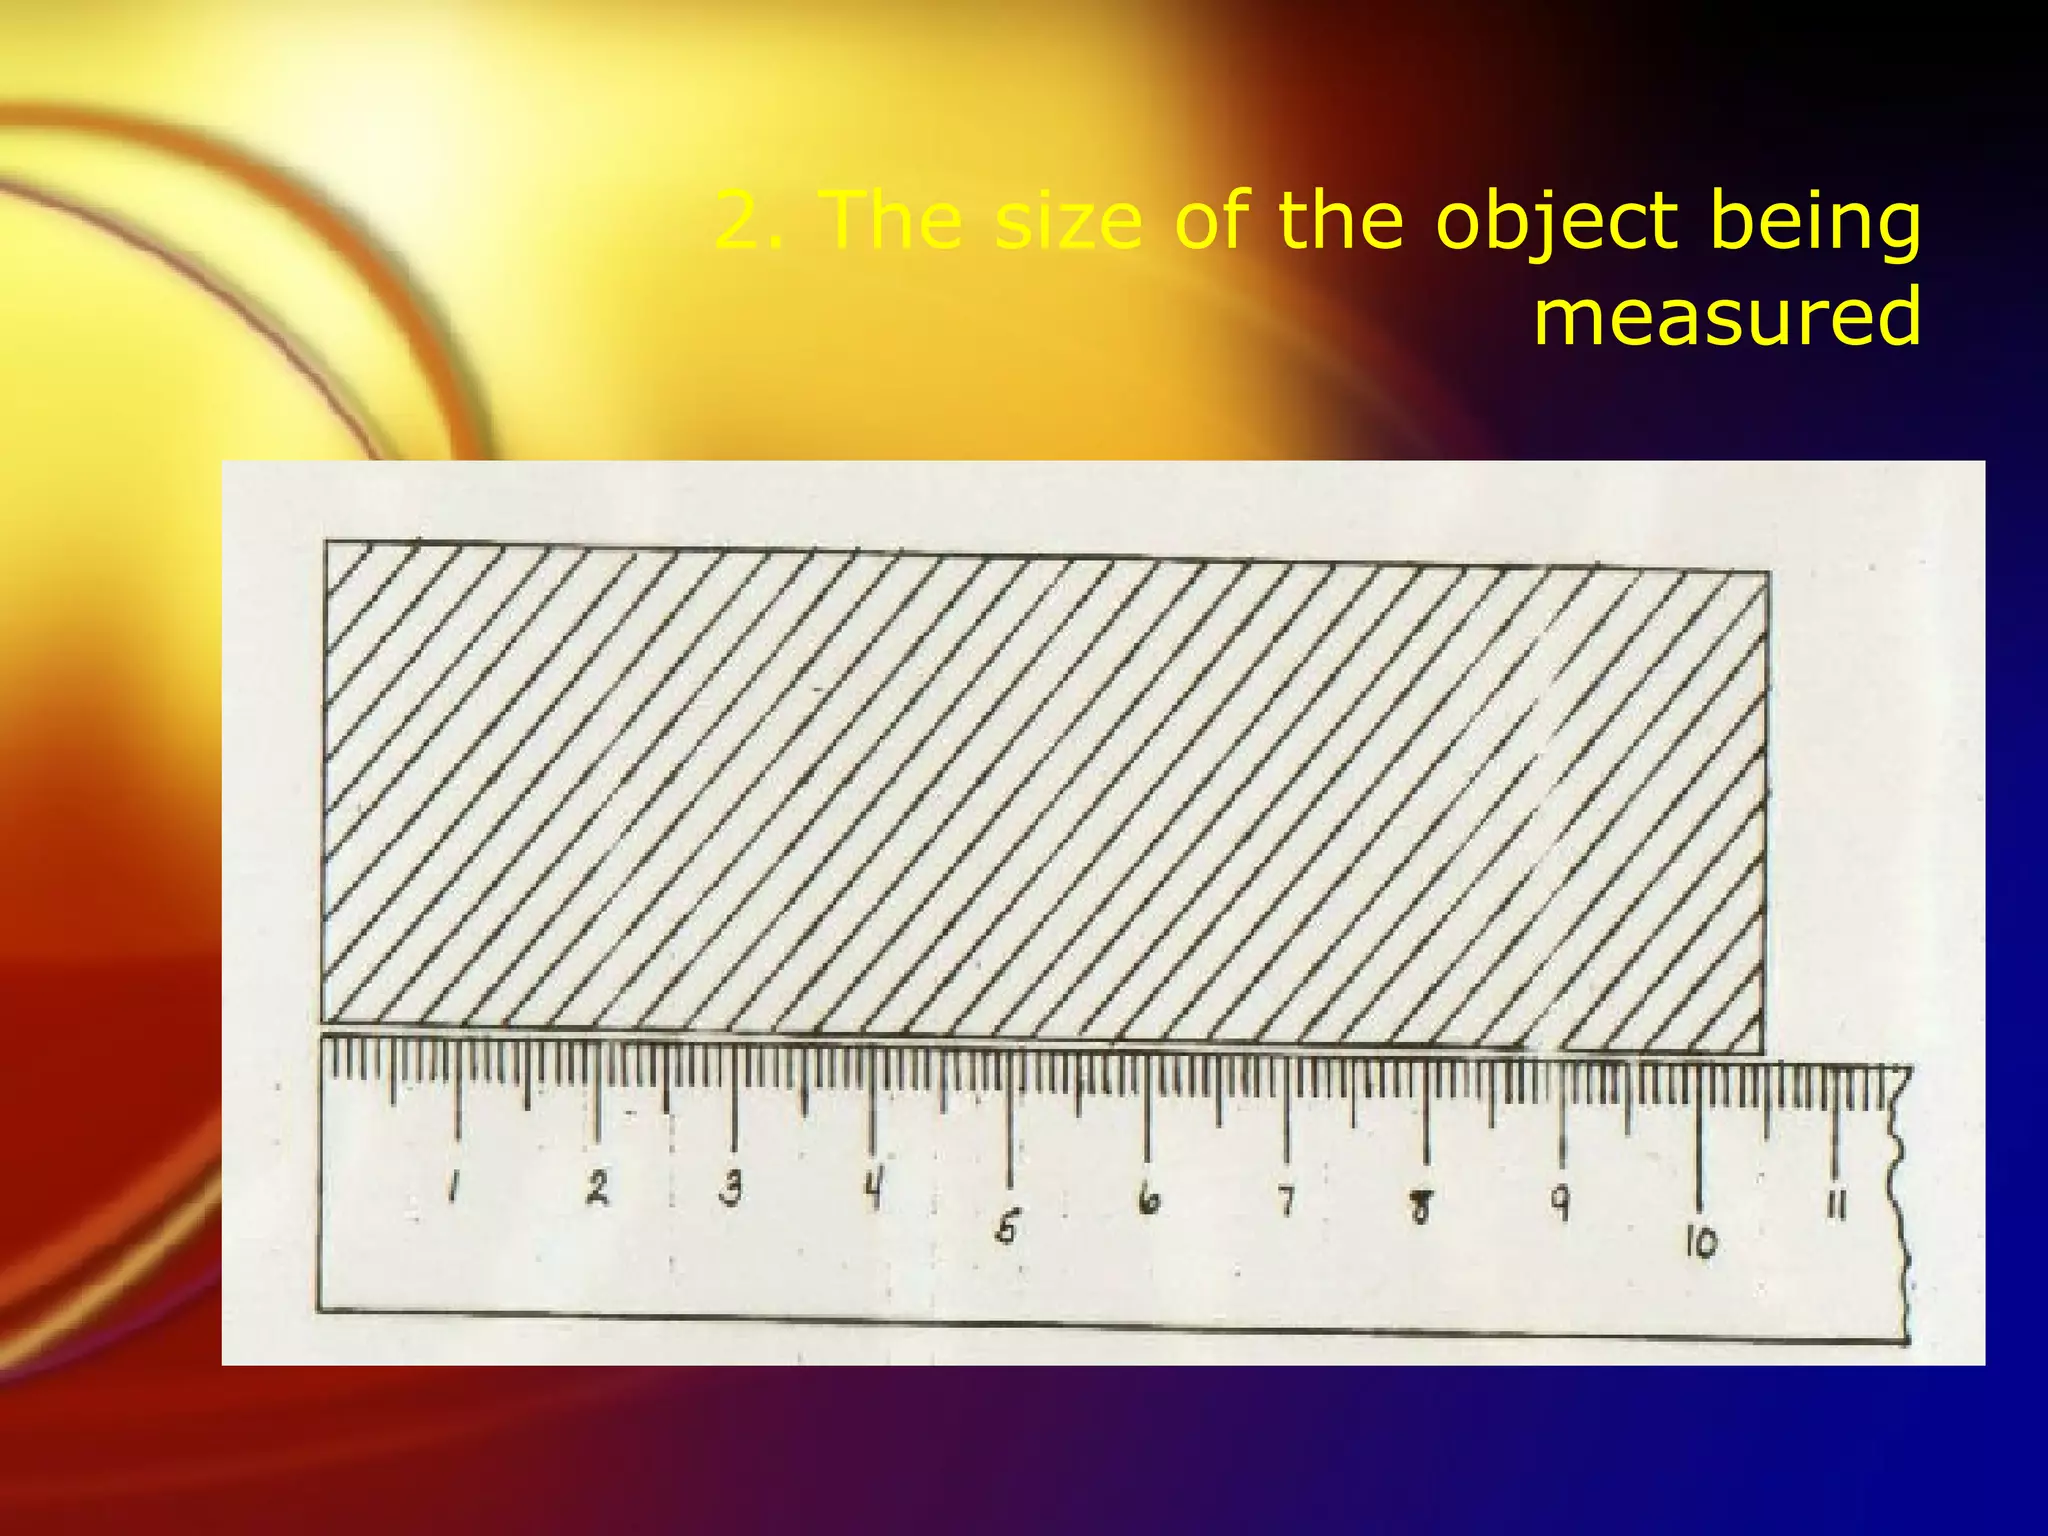
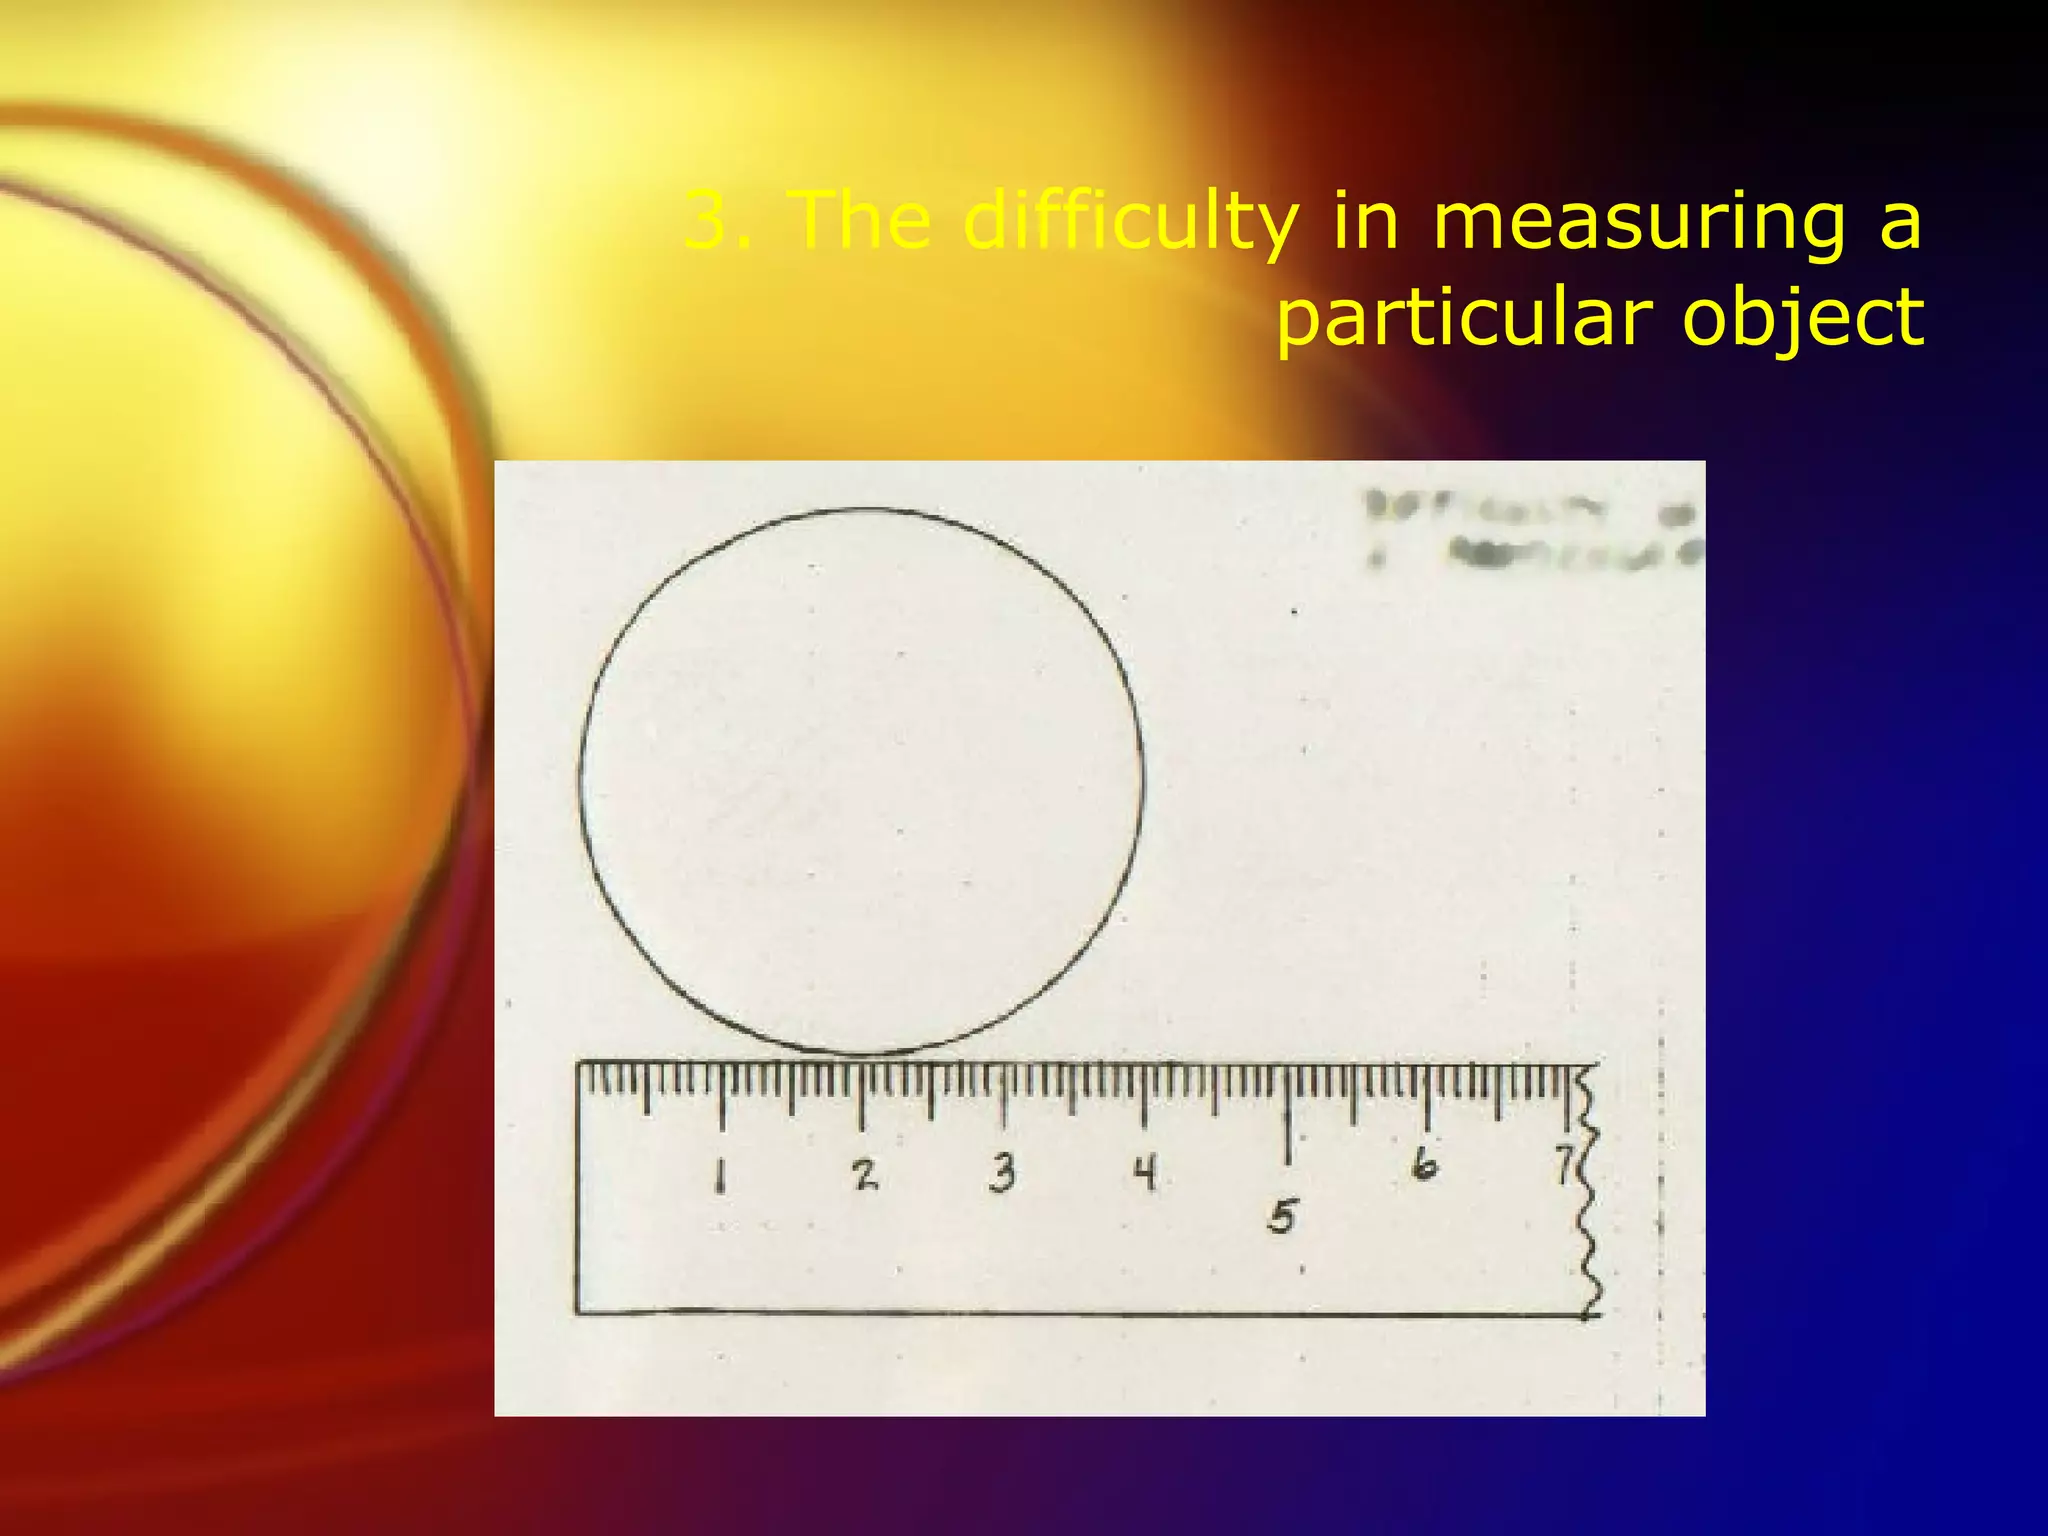
Propagation of ErrorScientific measurements will always contain some degree of uncertainty. This uncertainty will depend on: 1. The instrument(s) used to make measurements
6.
Propagation of Error2. The object being measured 3. The proximity to the object being measured
7.
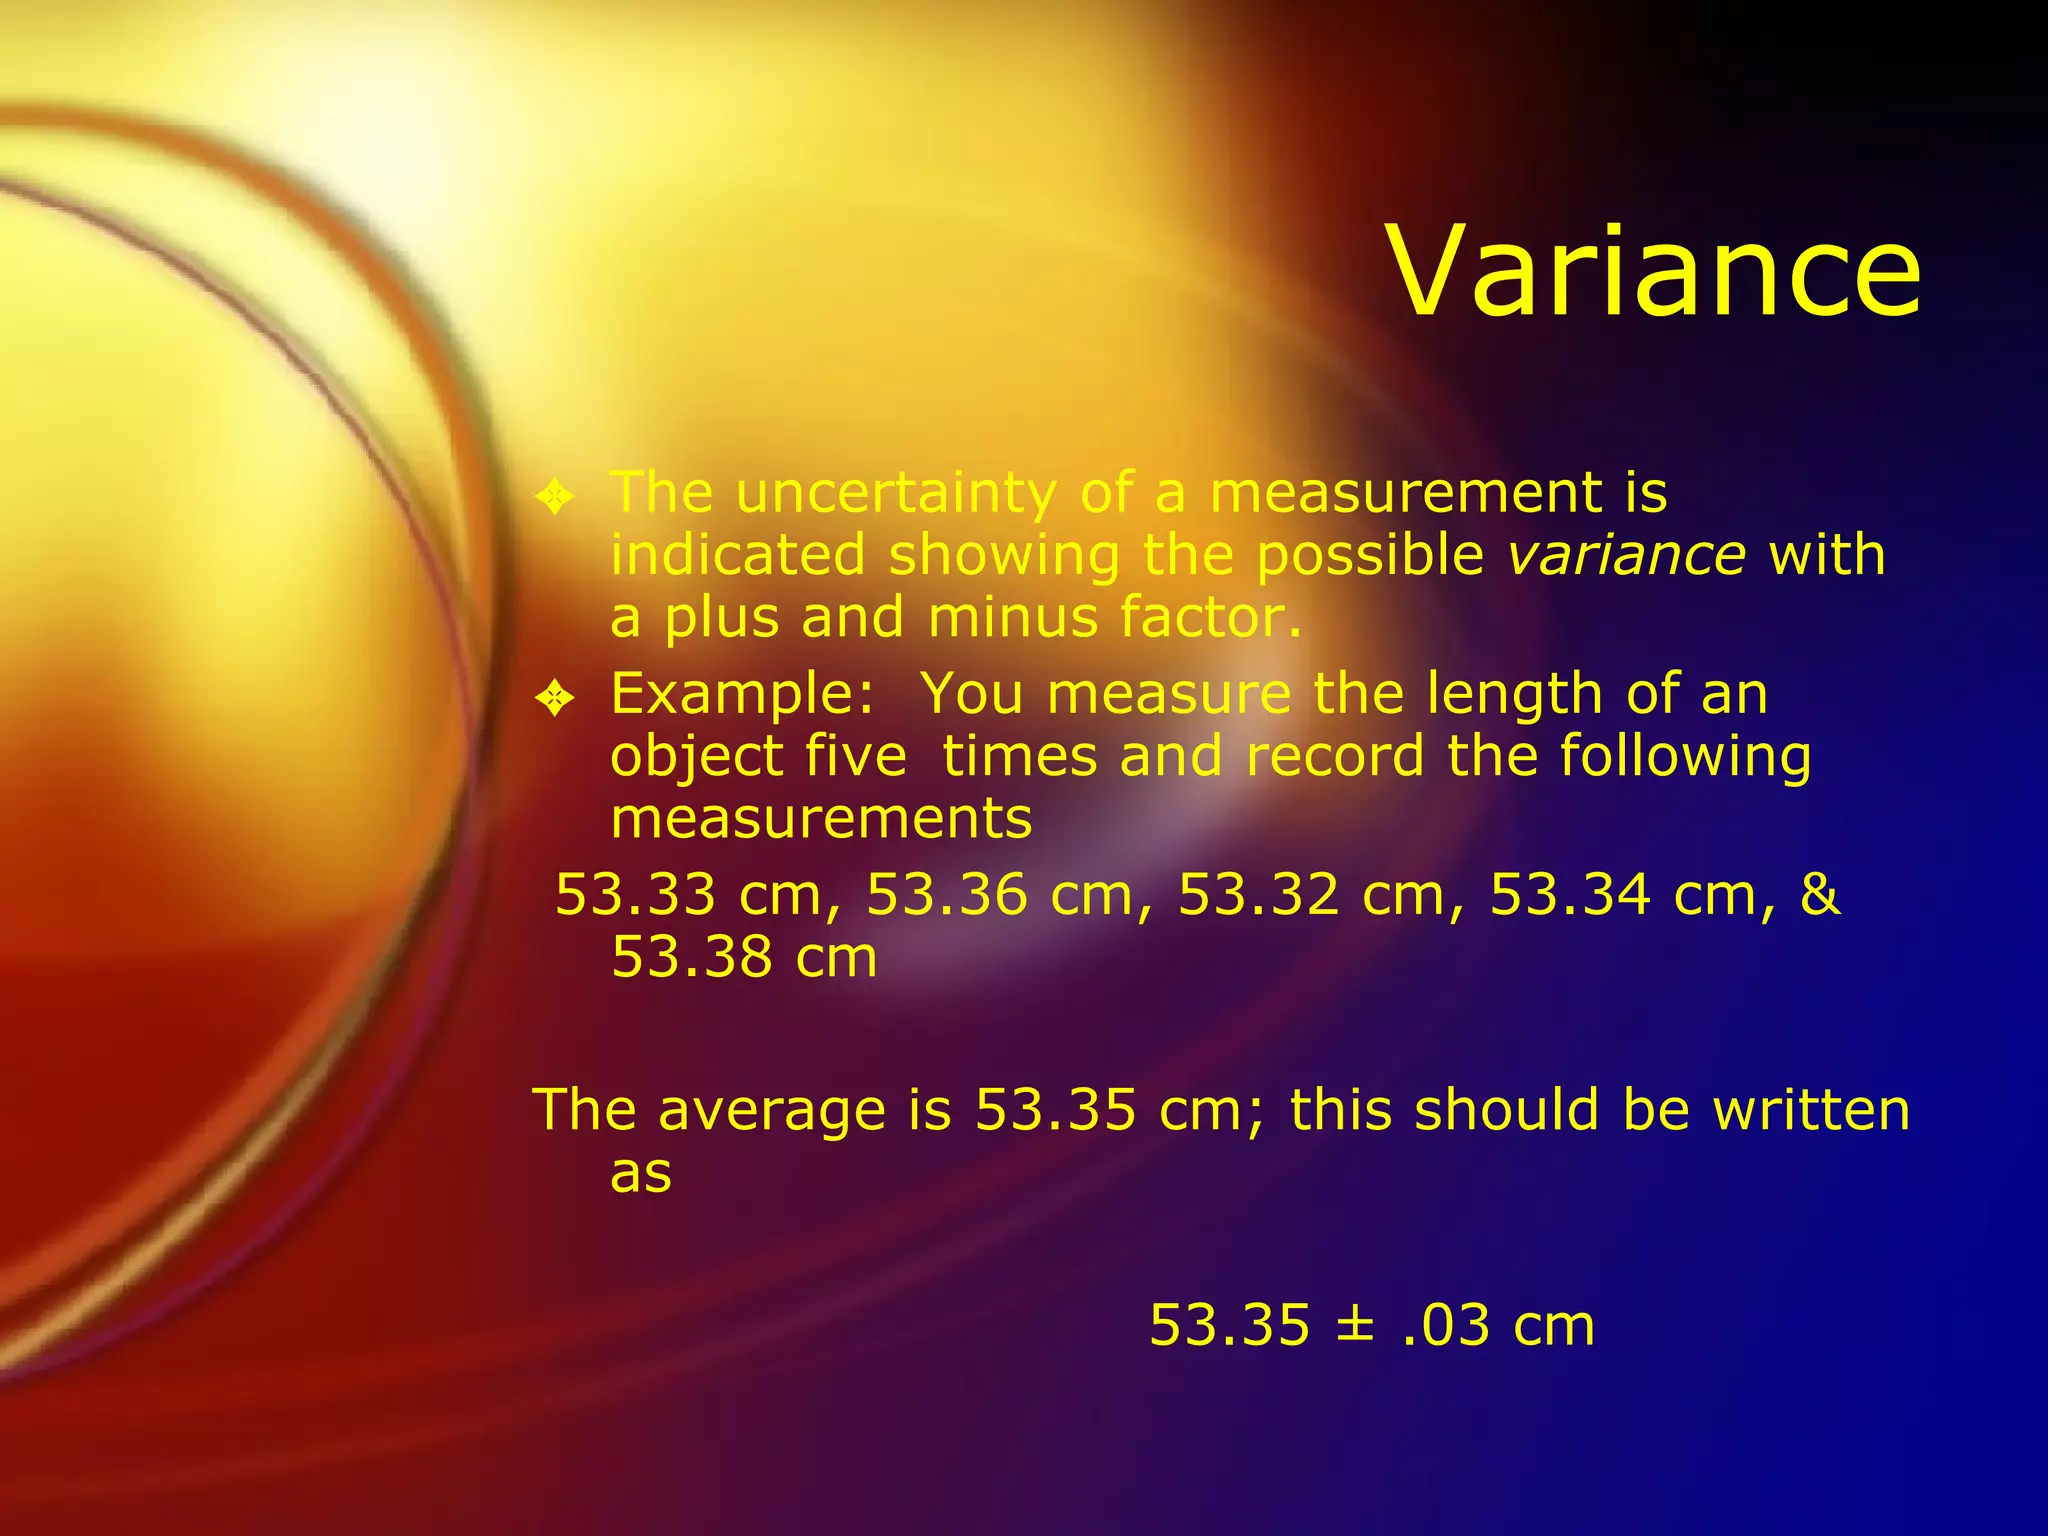
Variance The uncertaintyof a measurement is indicated showing the possible variance with a plus and minus factor. Example: You measure the length of an object five times and record the following measurements 53.33 cm, 53.36 cm, 53.32 cm, 53.34 cm, & 53.38 cm The average is 53.35 cm; this should be written as 53.35 ± .03 cm
8.
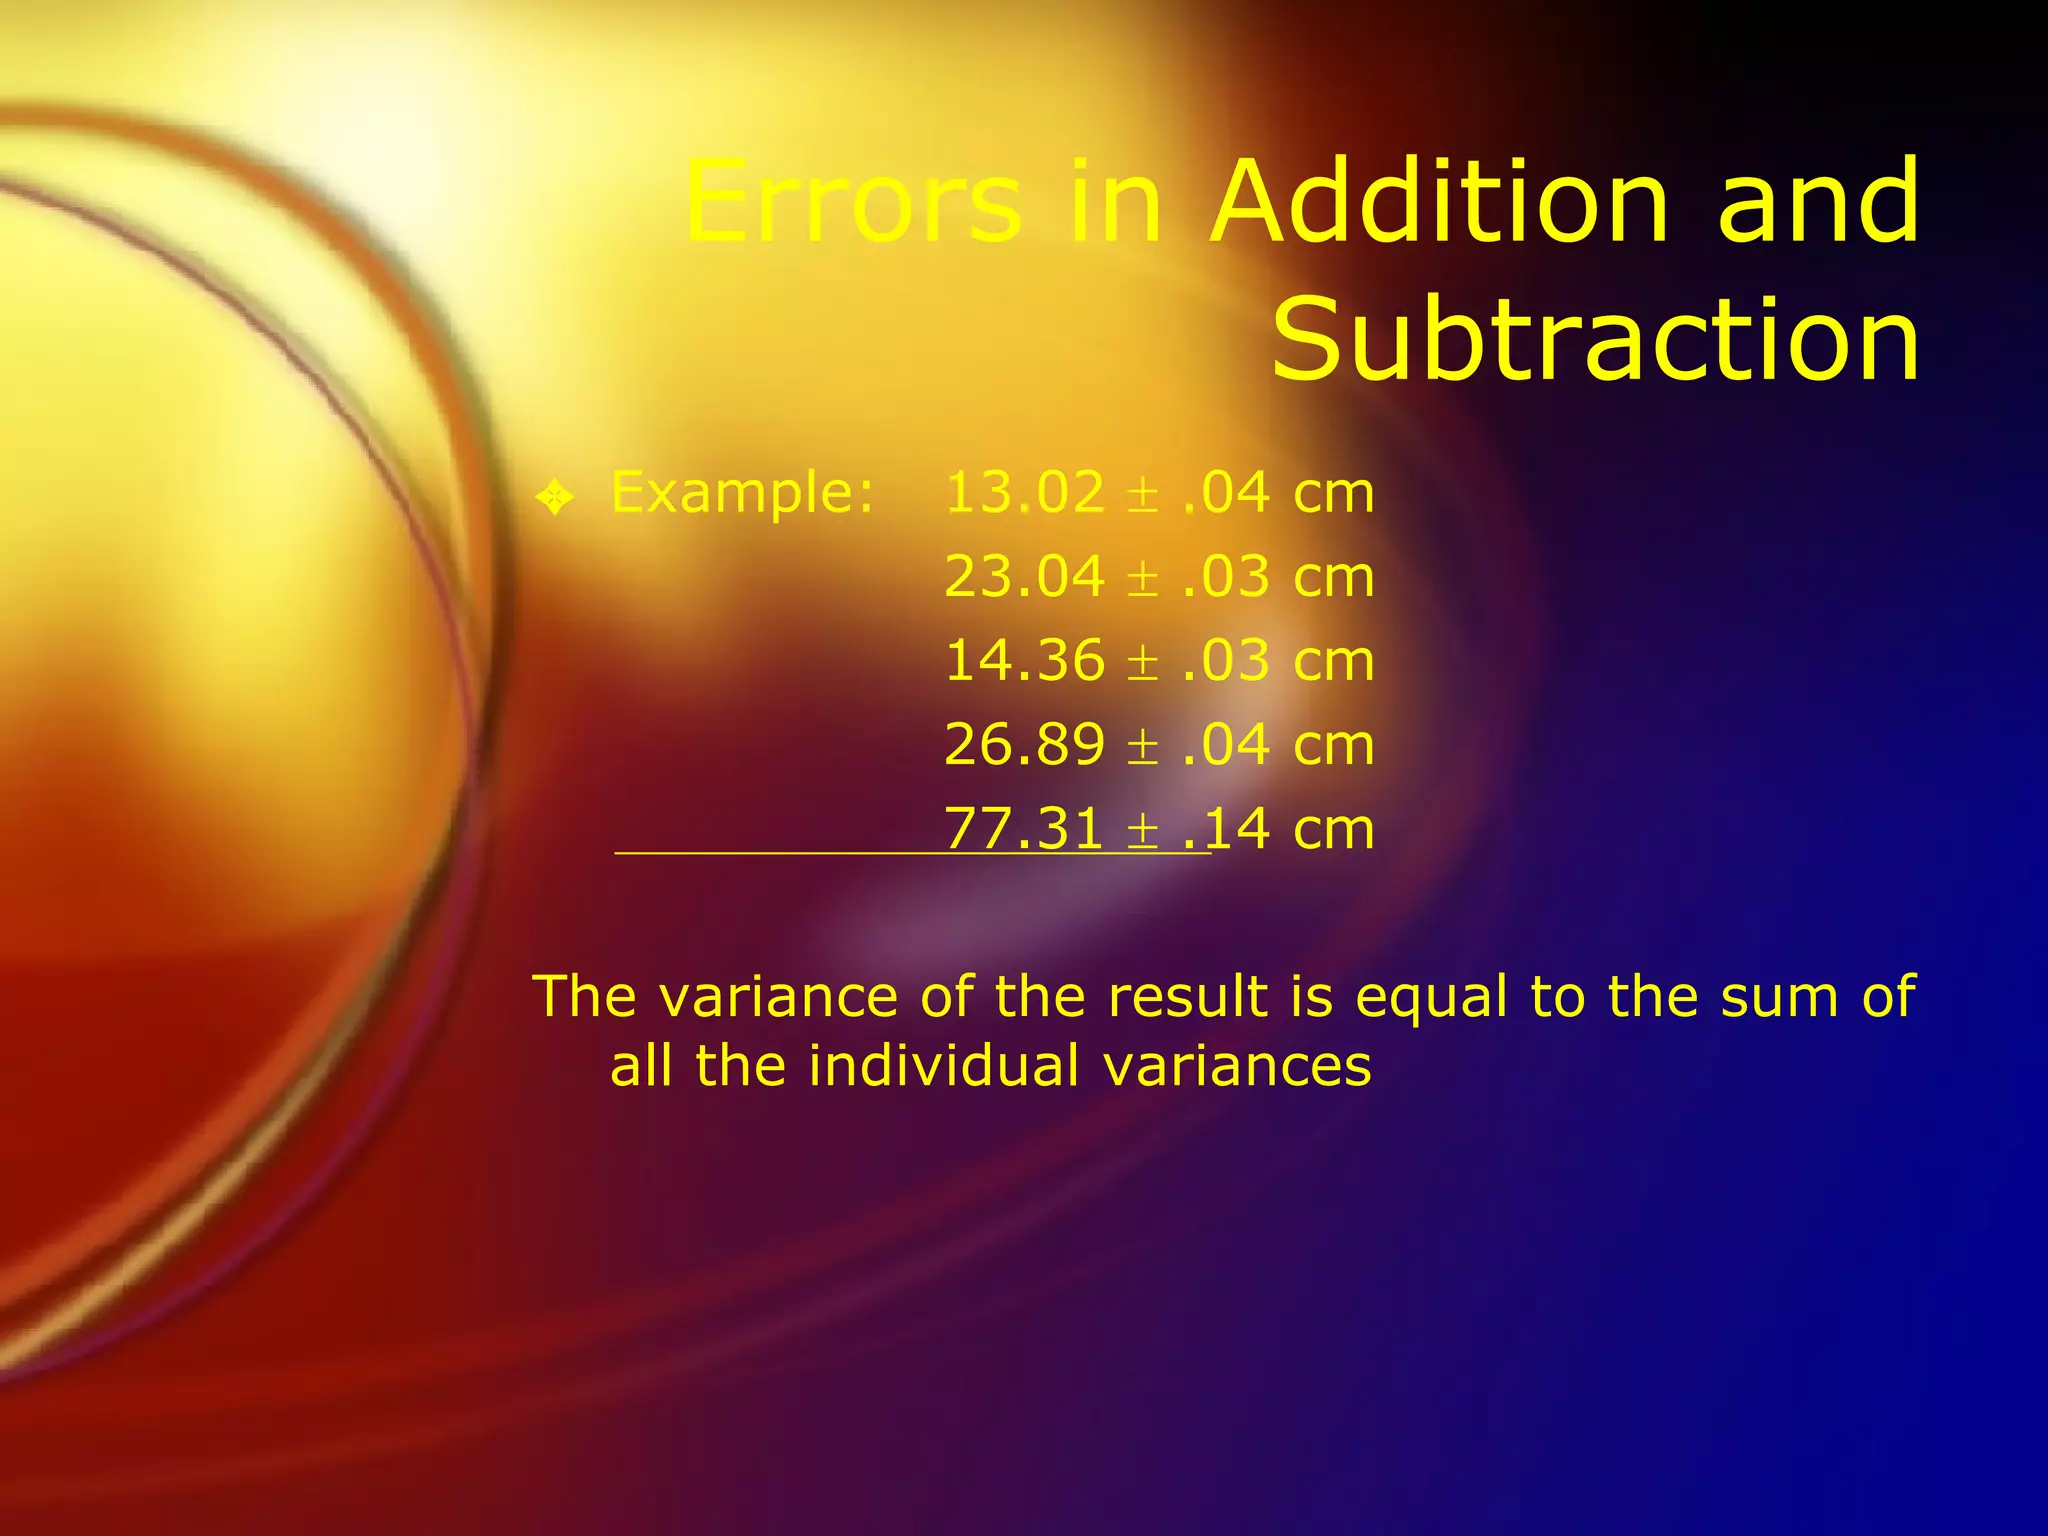
Errors in Additionand Subtraction Example: 13.02 .04 cm 23.04 .03 cm 14.36 .03 cm 26.89 .04 cm 77.31 .14 cm The variance of the result is equal to the sum of all the individual variances
9.
Errors in Multiplicationand Division Example: 13.2 .2 cm x 23.5 .3 cm Maximum and Minimum: Maximum 13.4 cm x 23.7 cm = 319 cm 2 Minimum 13.0 cm x 23.2 cm = 302 cm 2 Average = 310. cm 2 Answer 310. 9 cm 2 The variance MUST be large enough to include both maximum and minimum
10.
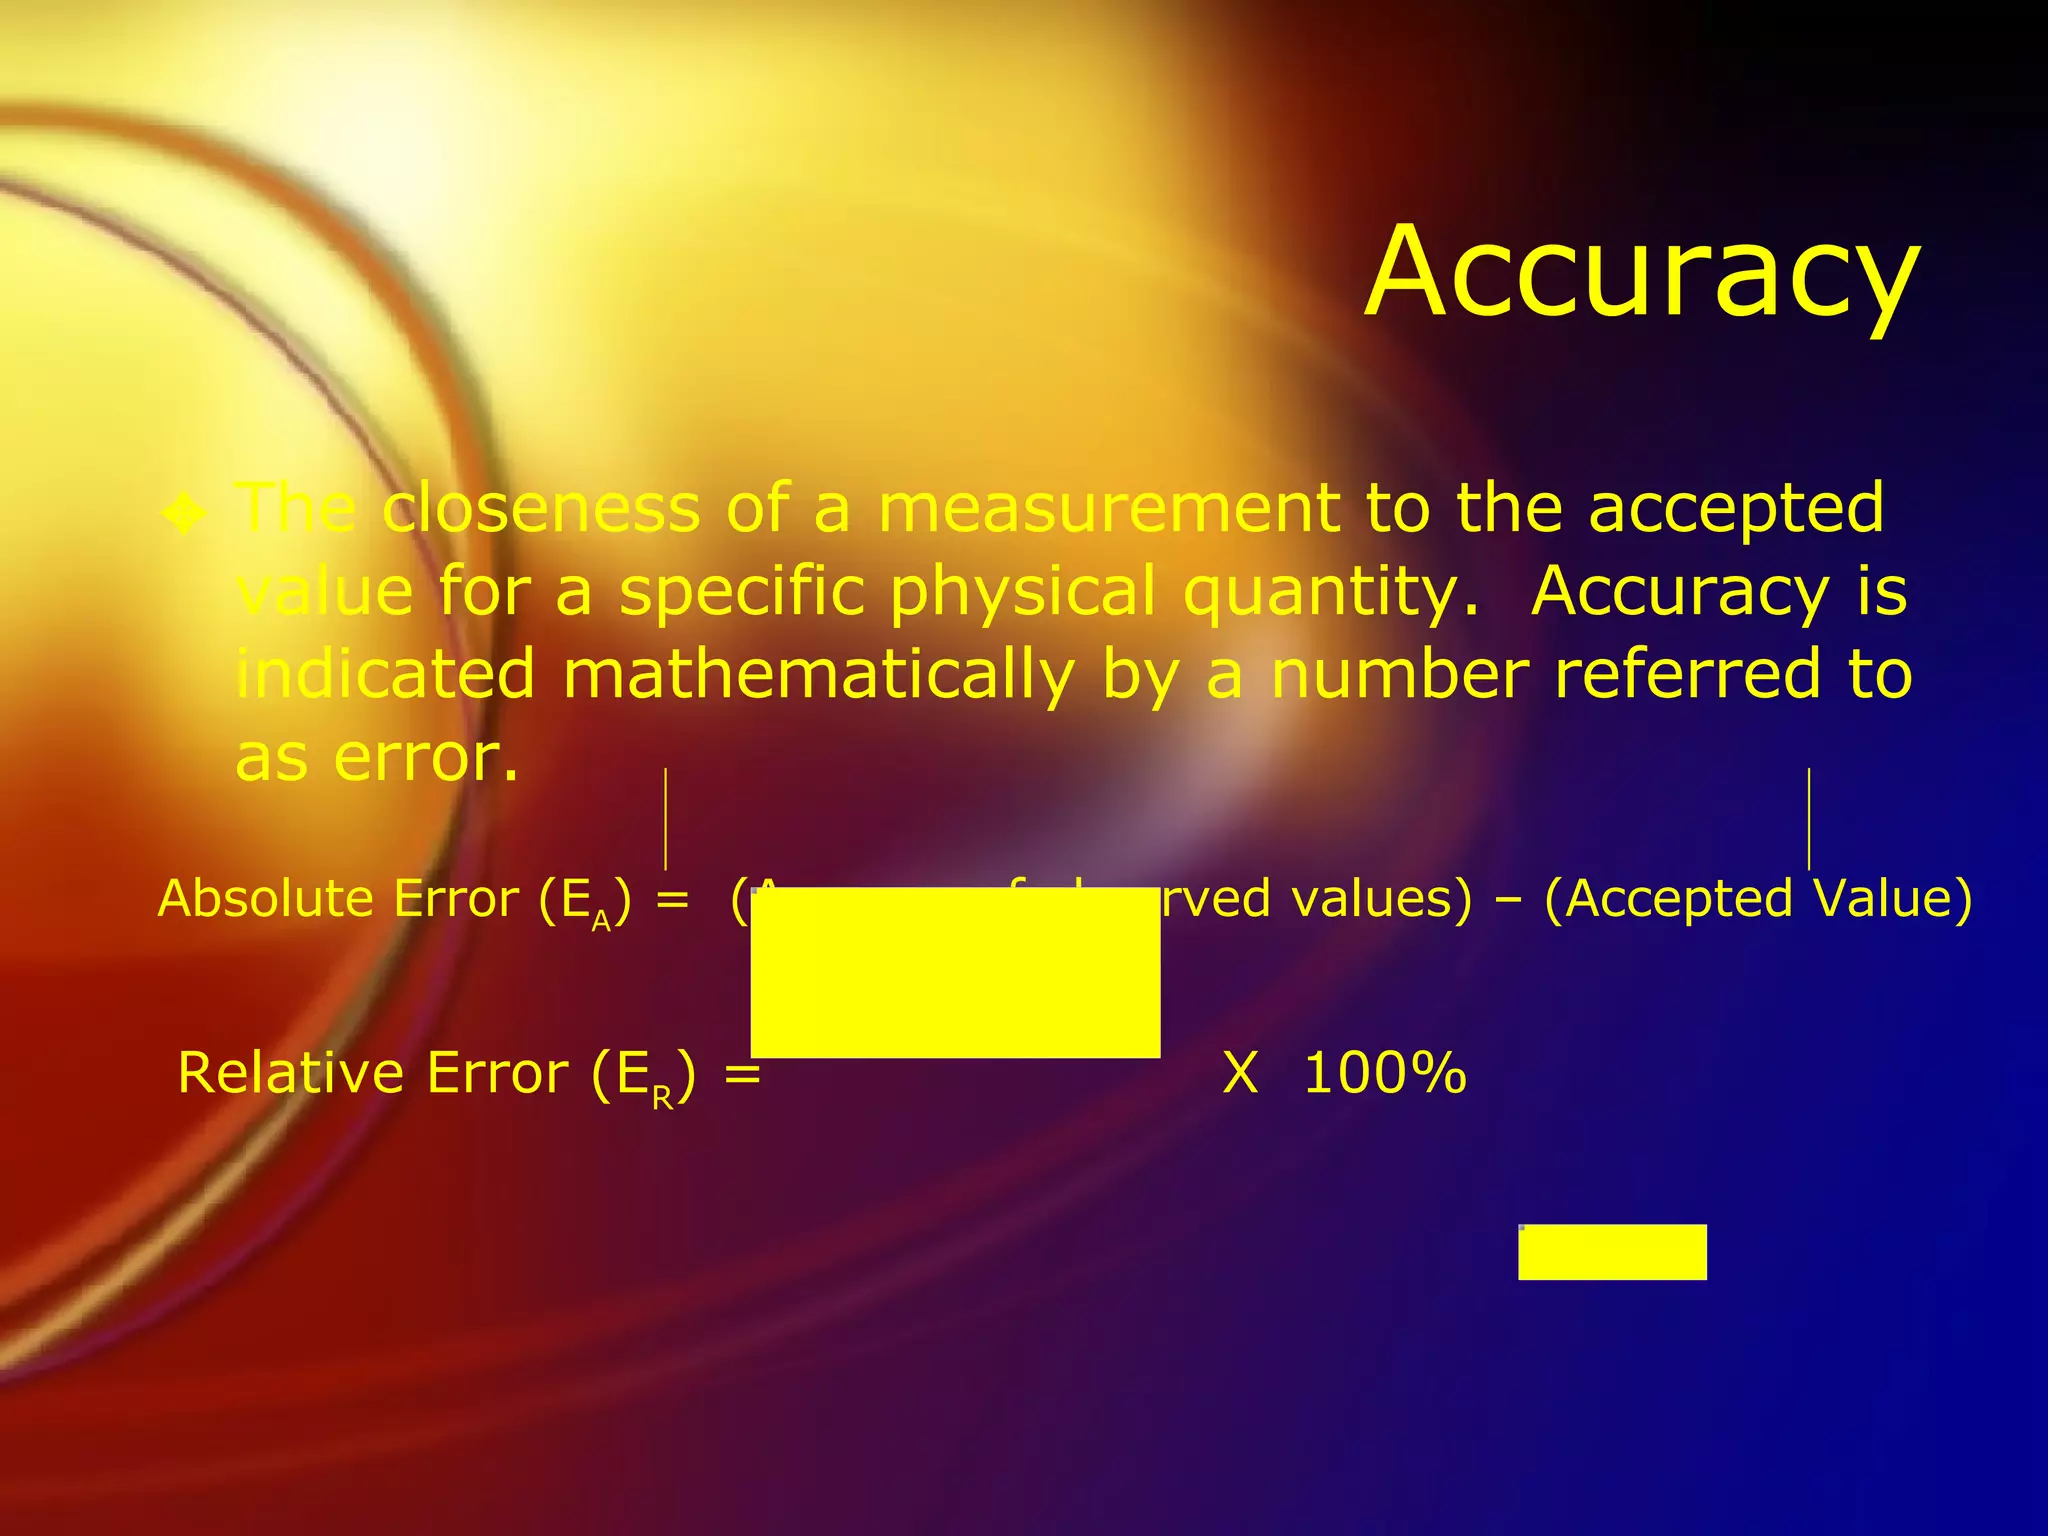
Accuracy The closenessof a measurement to the accepted value for a specific physical quantity. Accuracy is indicated mathematically by a number referred to as error. Absolute Error (E A ) = (Average of observed values) – (Accepted Value) Relative Error (E R ) = X 100%
11.
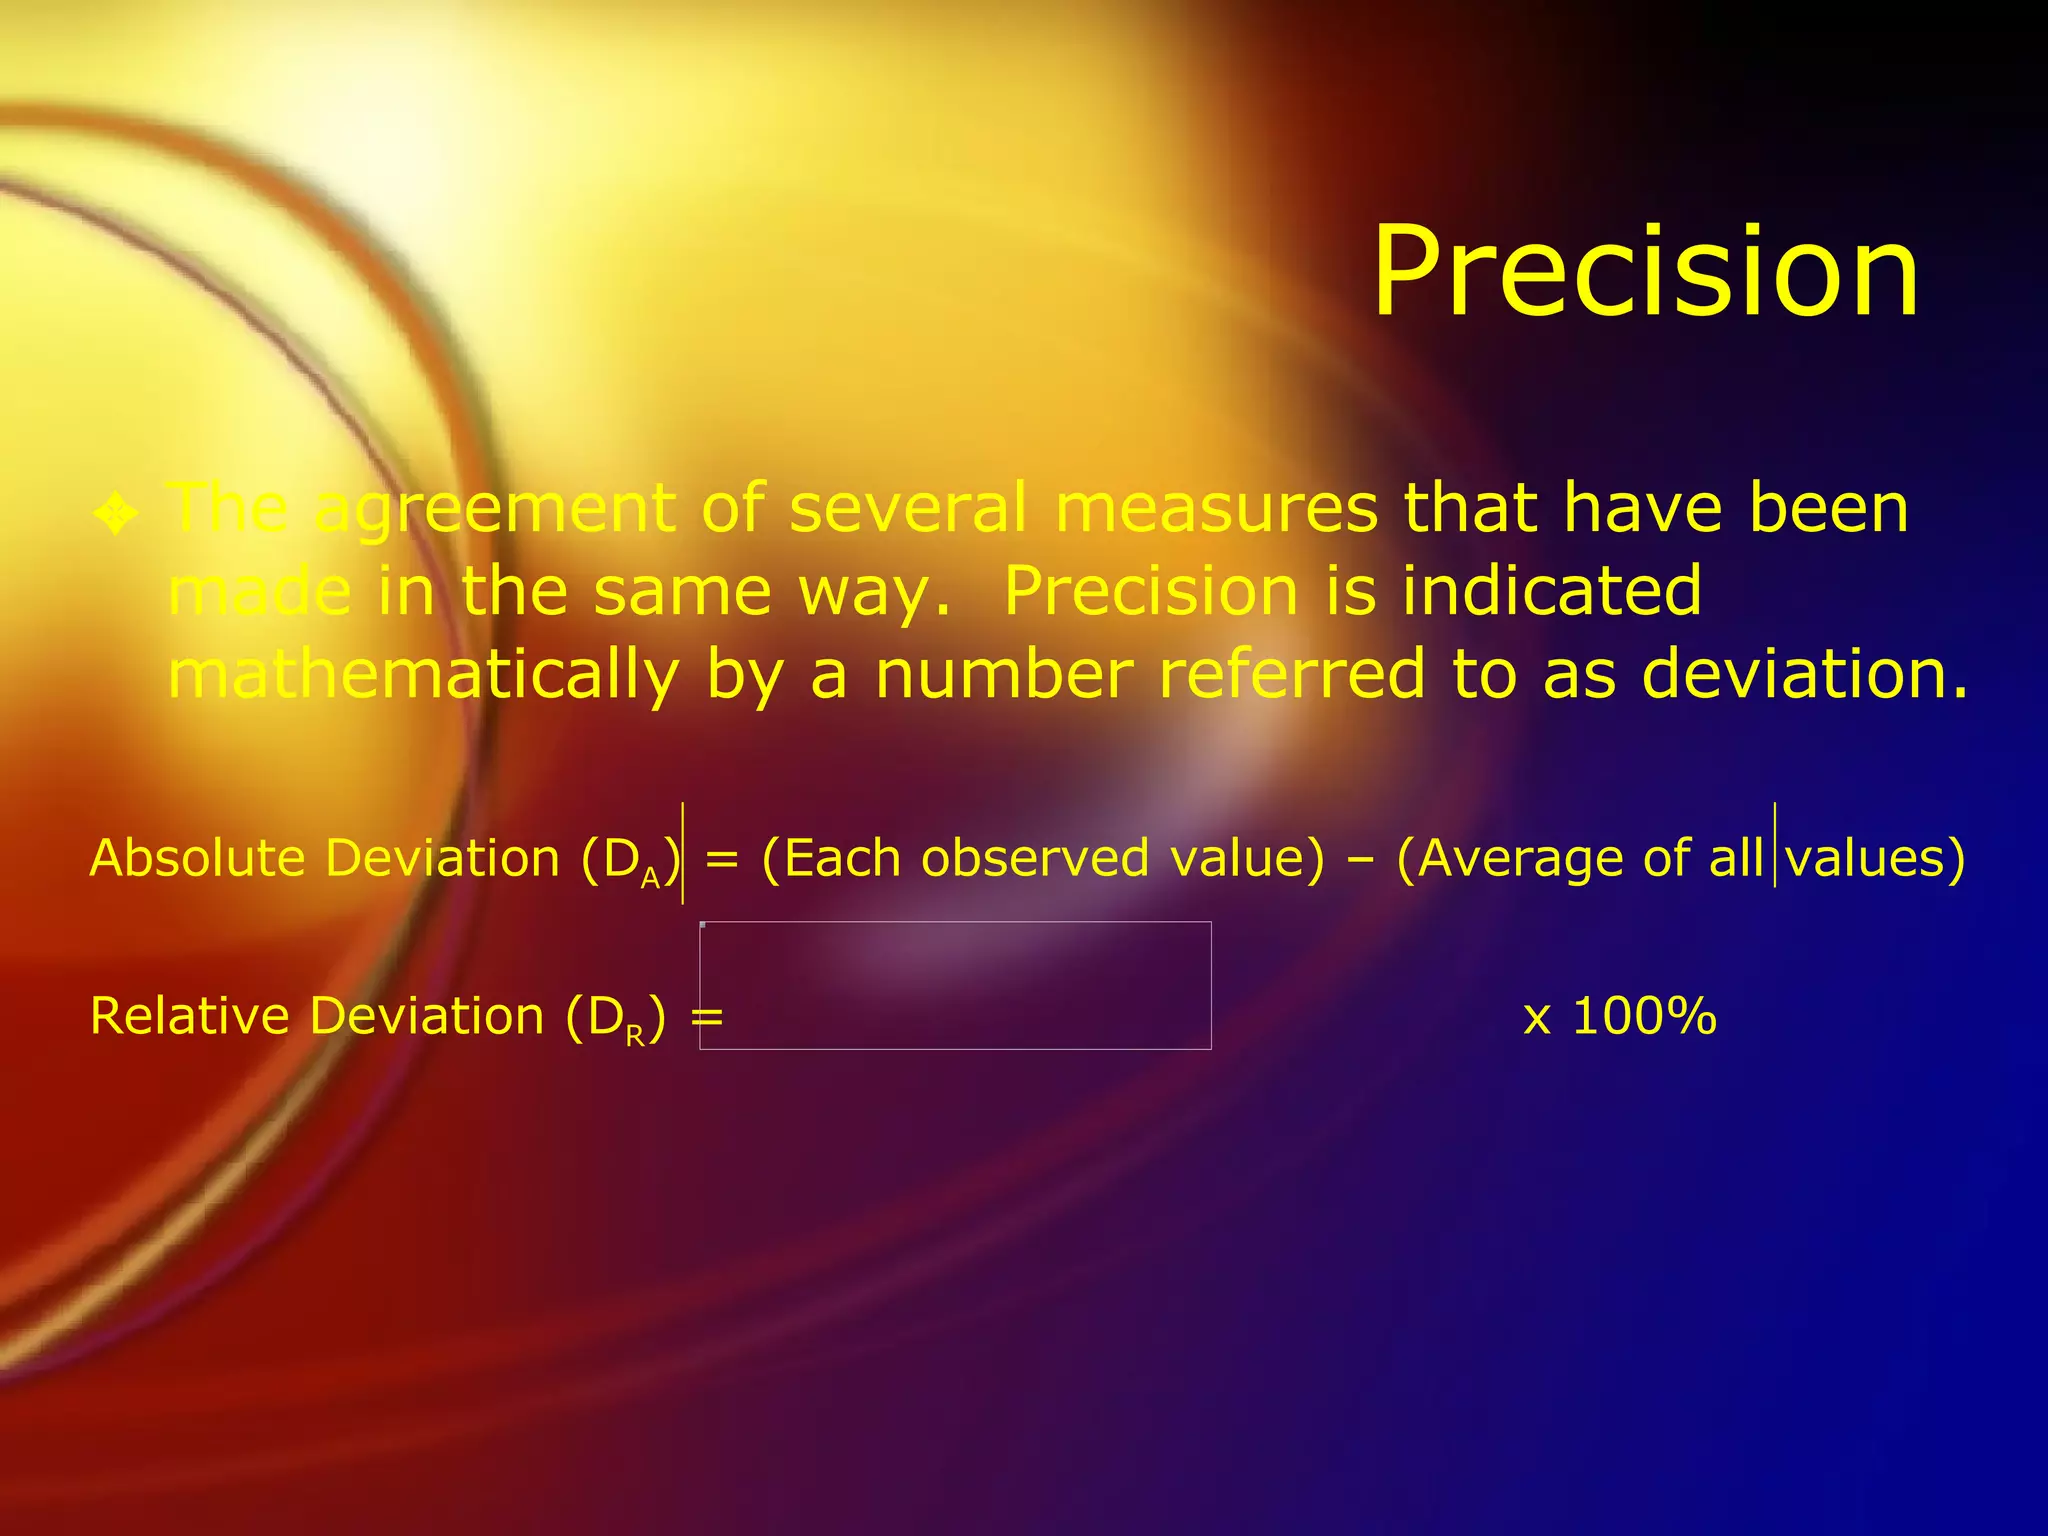
Precision The agreementof several measures that have been made in the same way. Precision is indicated mathematically by a number referred to as deviation. Absolute Deviation (D A ) = (Each observed value) – (Average of all values) Relative Deviation (D R ) = x 100%
12.
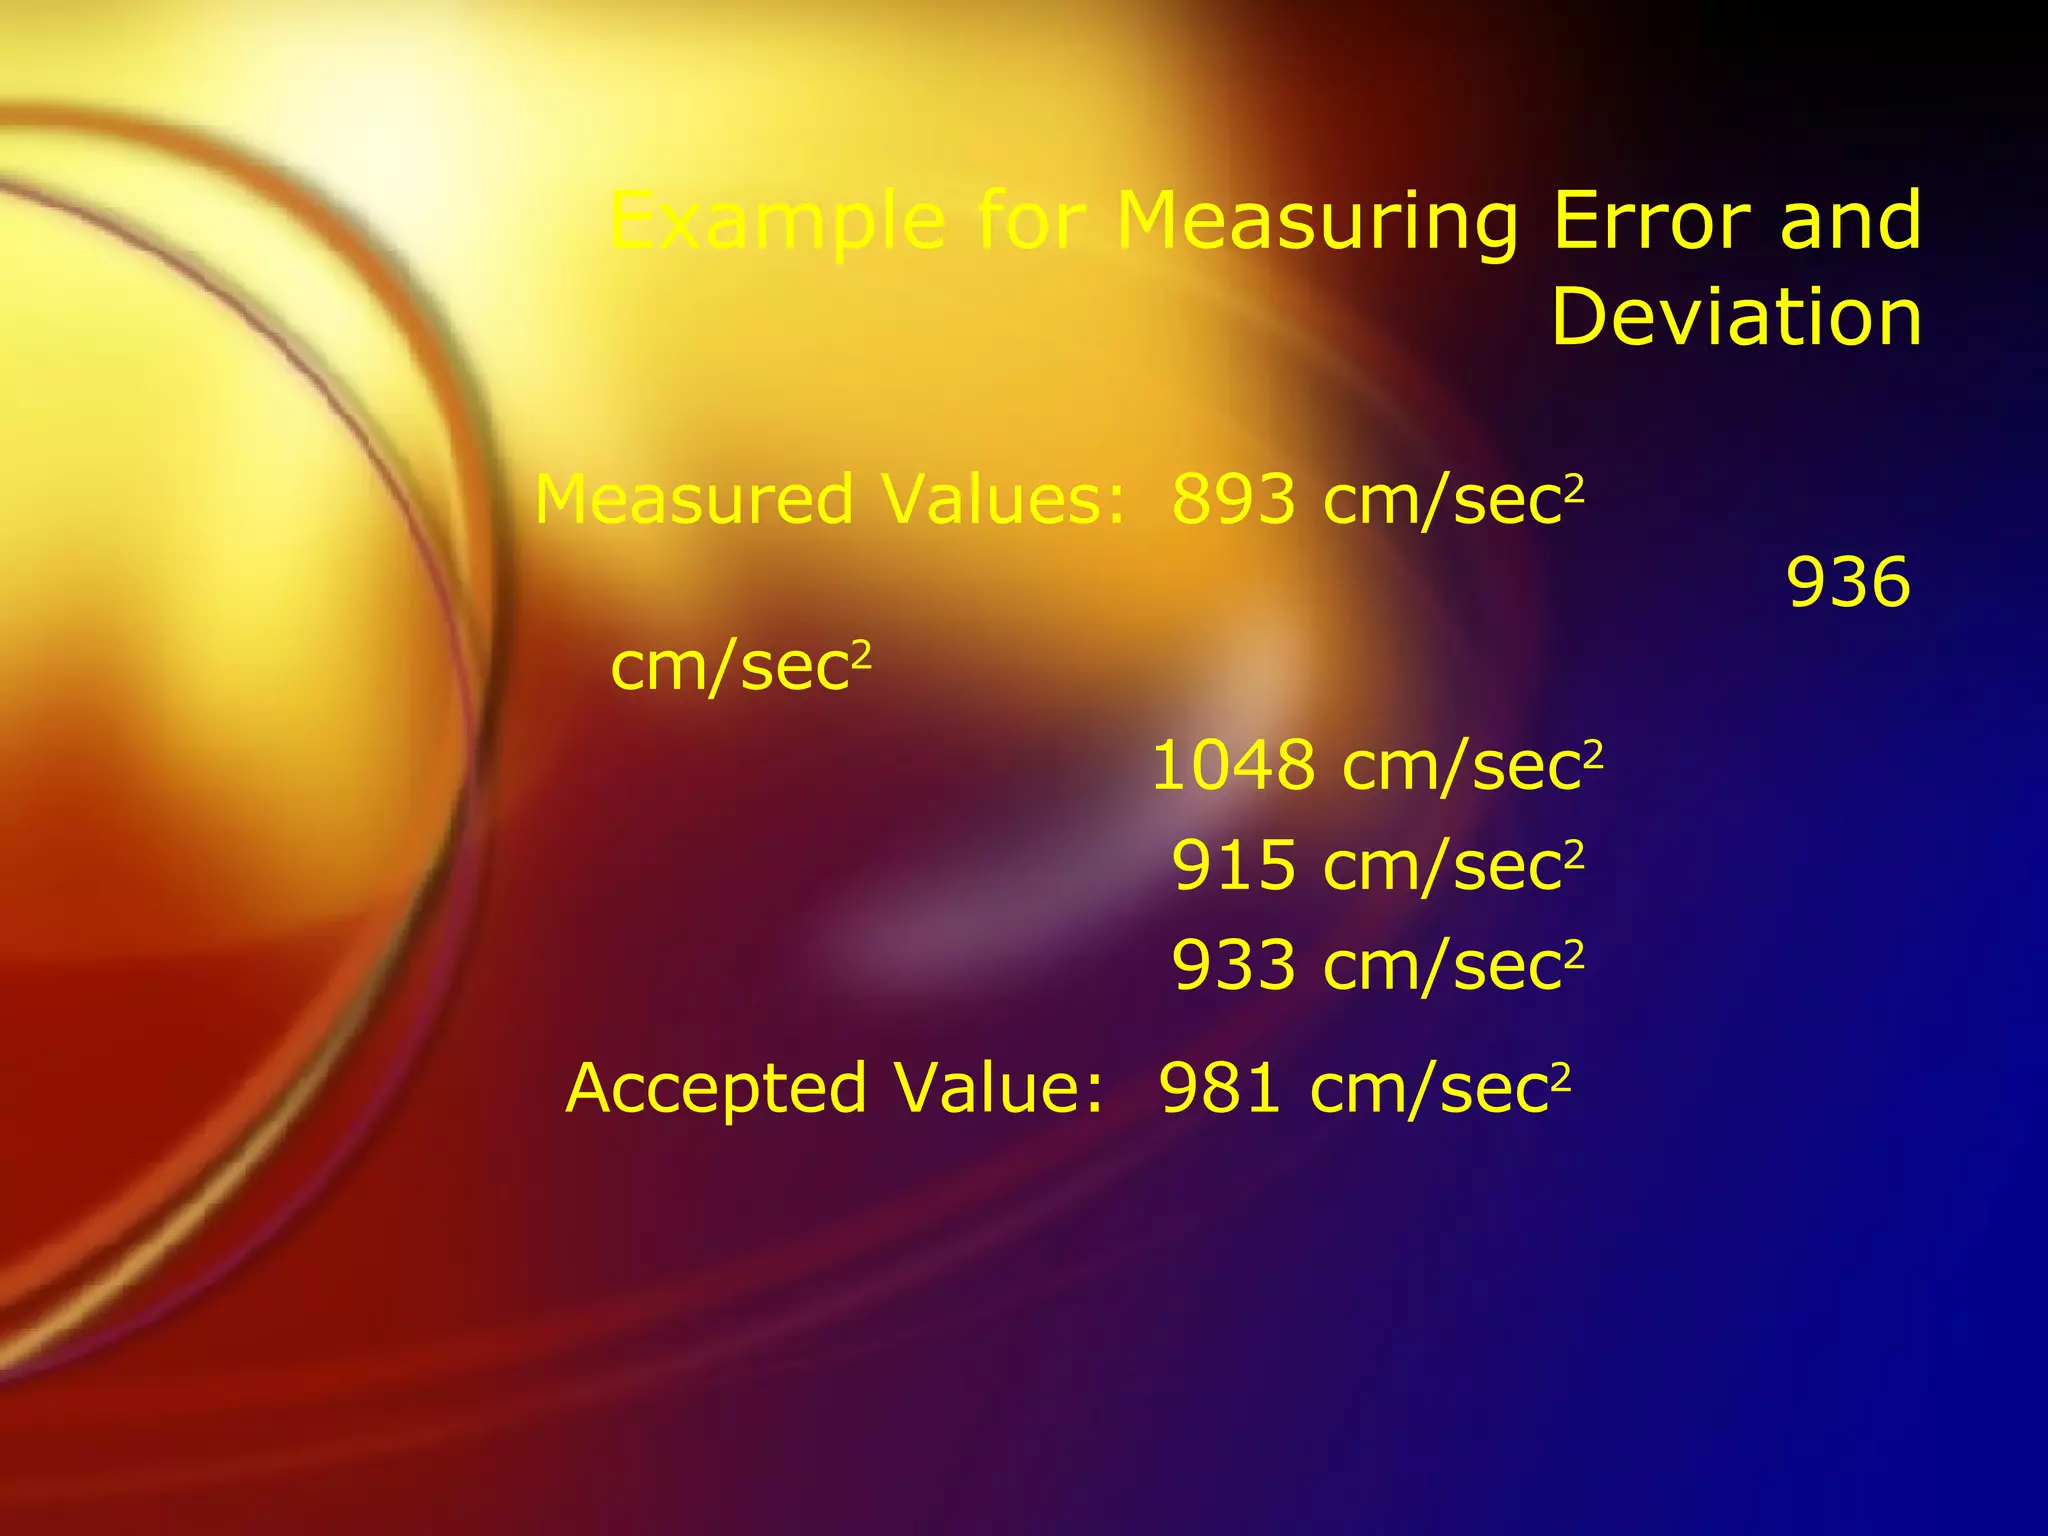
Example for MeasuringError and Deviation Measured Values: 893 cm/sec 2 936 cm/sec 2 1048 cm/sec 2 915 cm/sec 2 933 cm/sec 2 Accepted Value: 981 cm/sec 2
13.
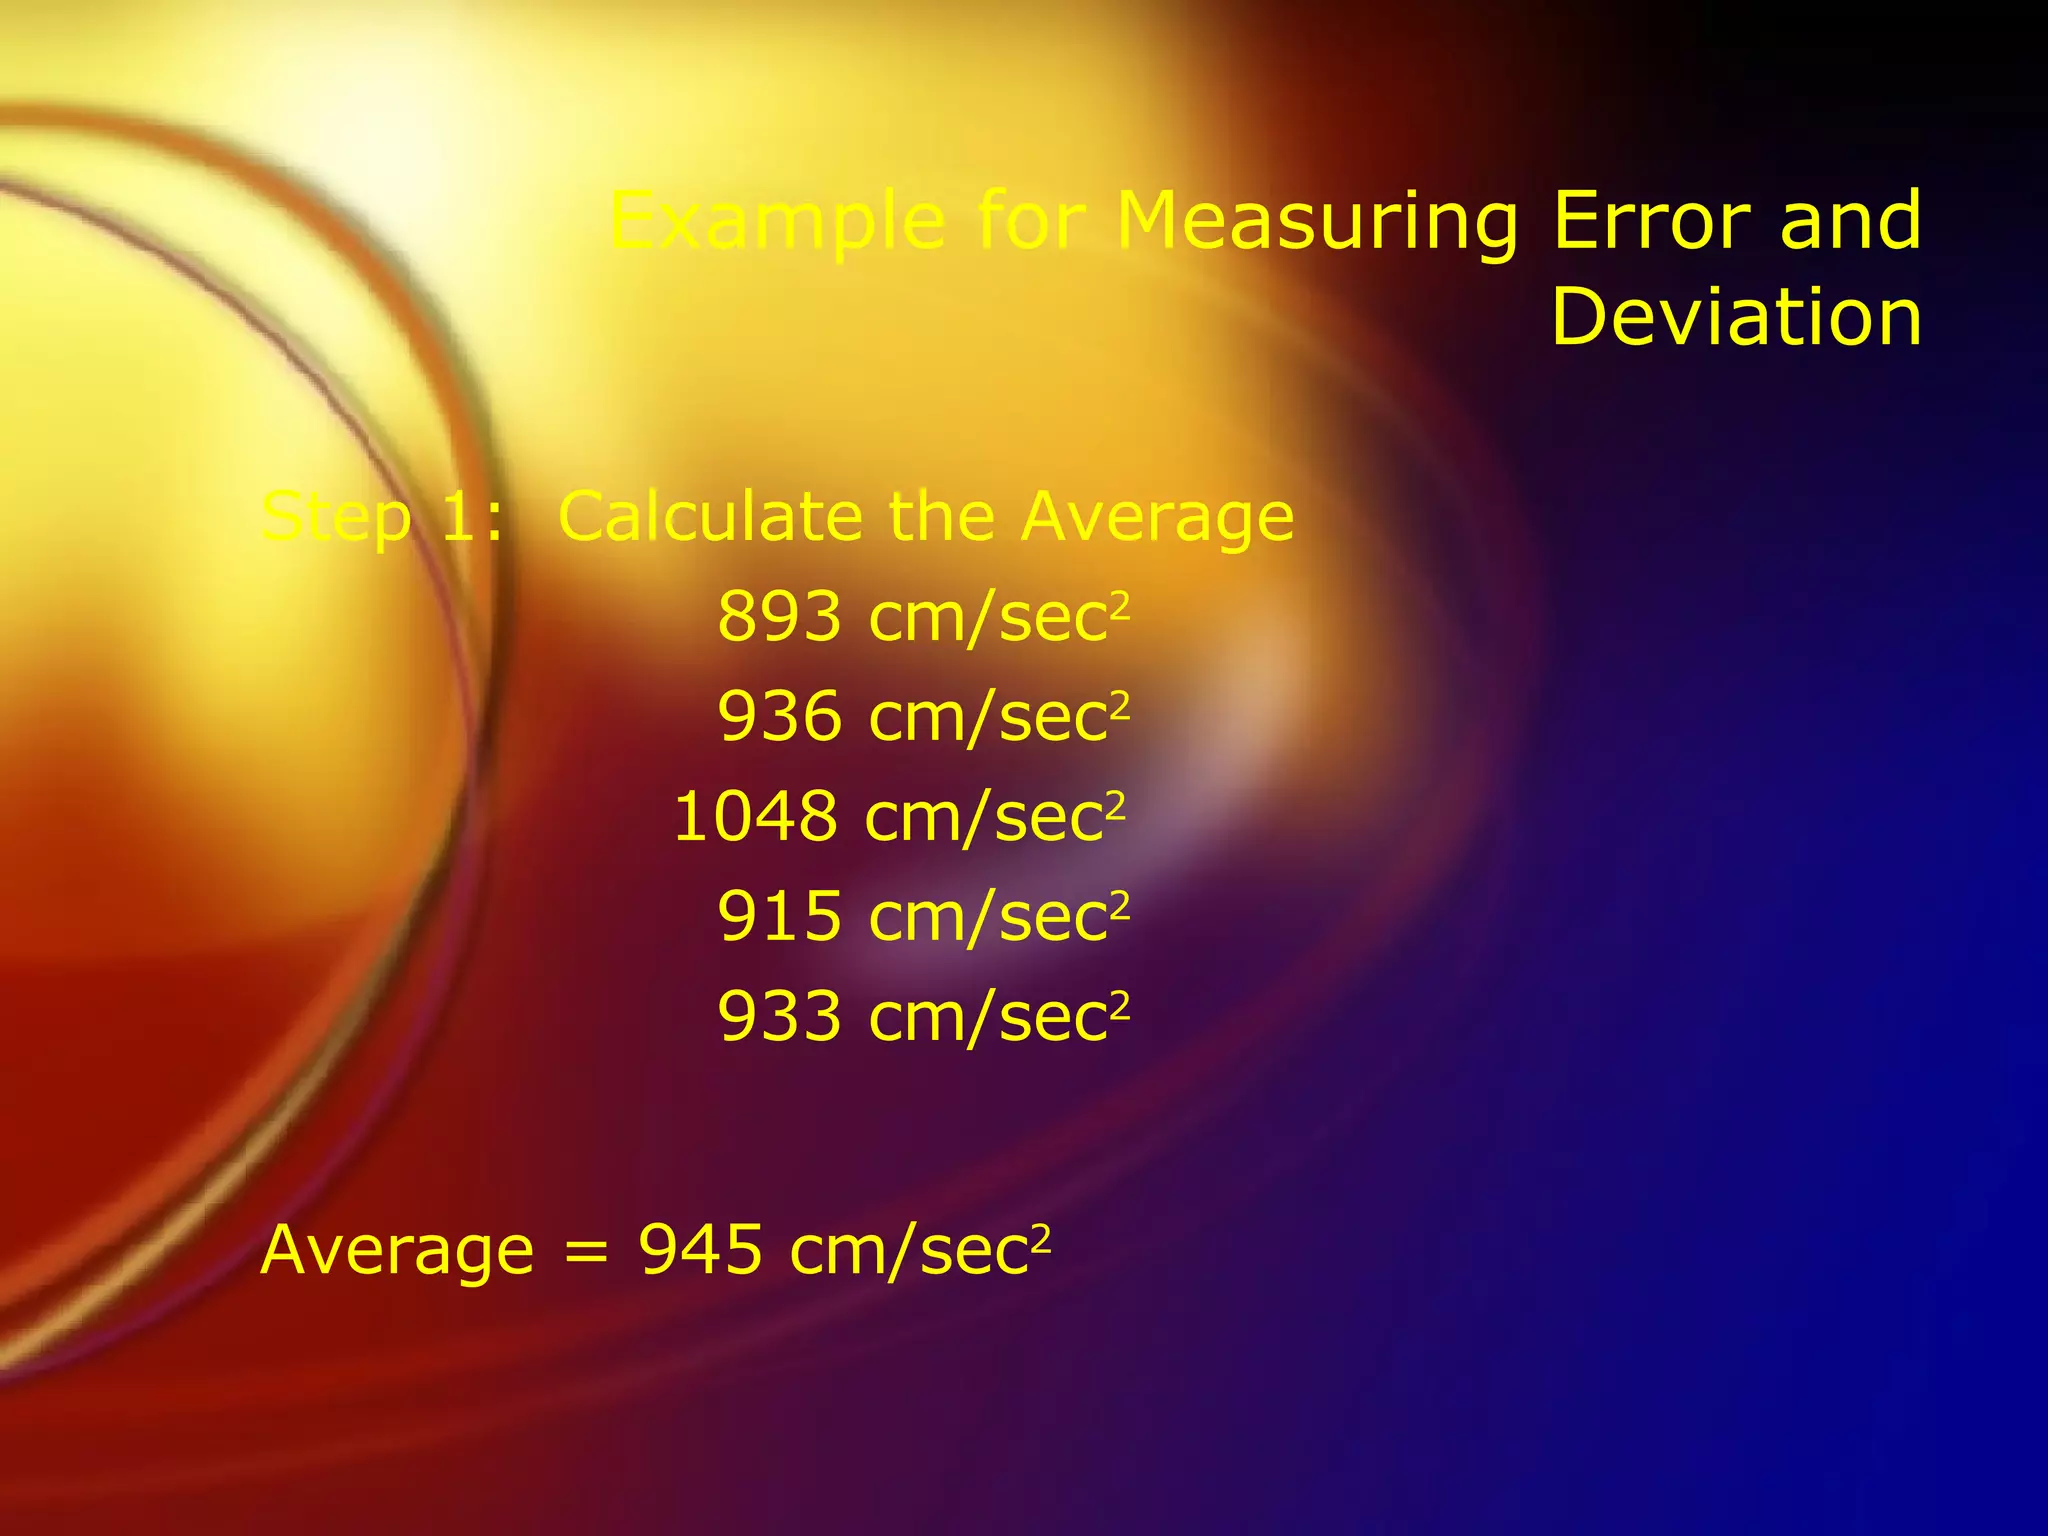
Example for MeasuringError and Deviation Step 1: Calculate the Average 893 cm/sec 2 936 cm/sec 2 1048 cm/sec 2 915 cm/sec 2 933 cm/sec 2 Average = 945 cm/sec 2
14.
Example for MeasuringError and Deviation Step 2: Calculate Absolute and Relative Error Absolute Error (E A ) = (Average of observed values) – (Accepted Value) E A = 945 cm/sec 2 – 981 cm/sec 2 = 36 cm/sec 2 Relative Error (E R ) = x 100 % E R = x 100% = 3.7 %
15.
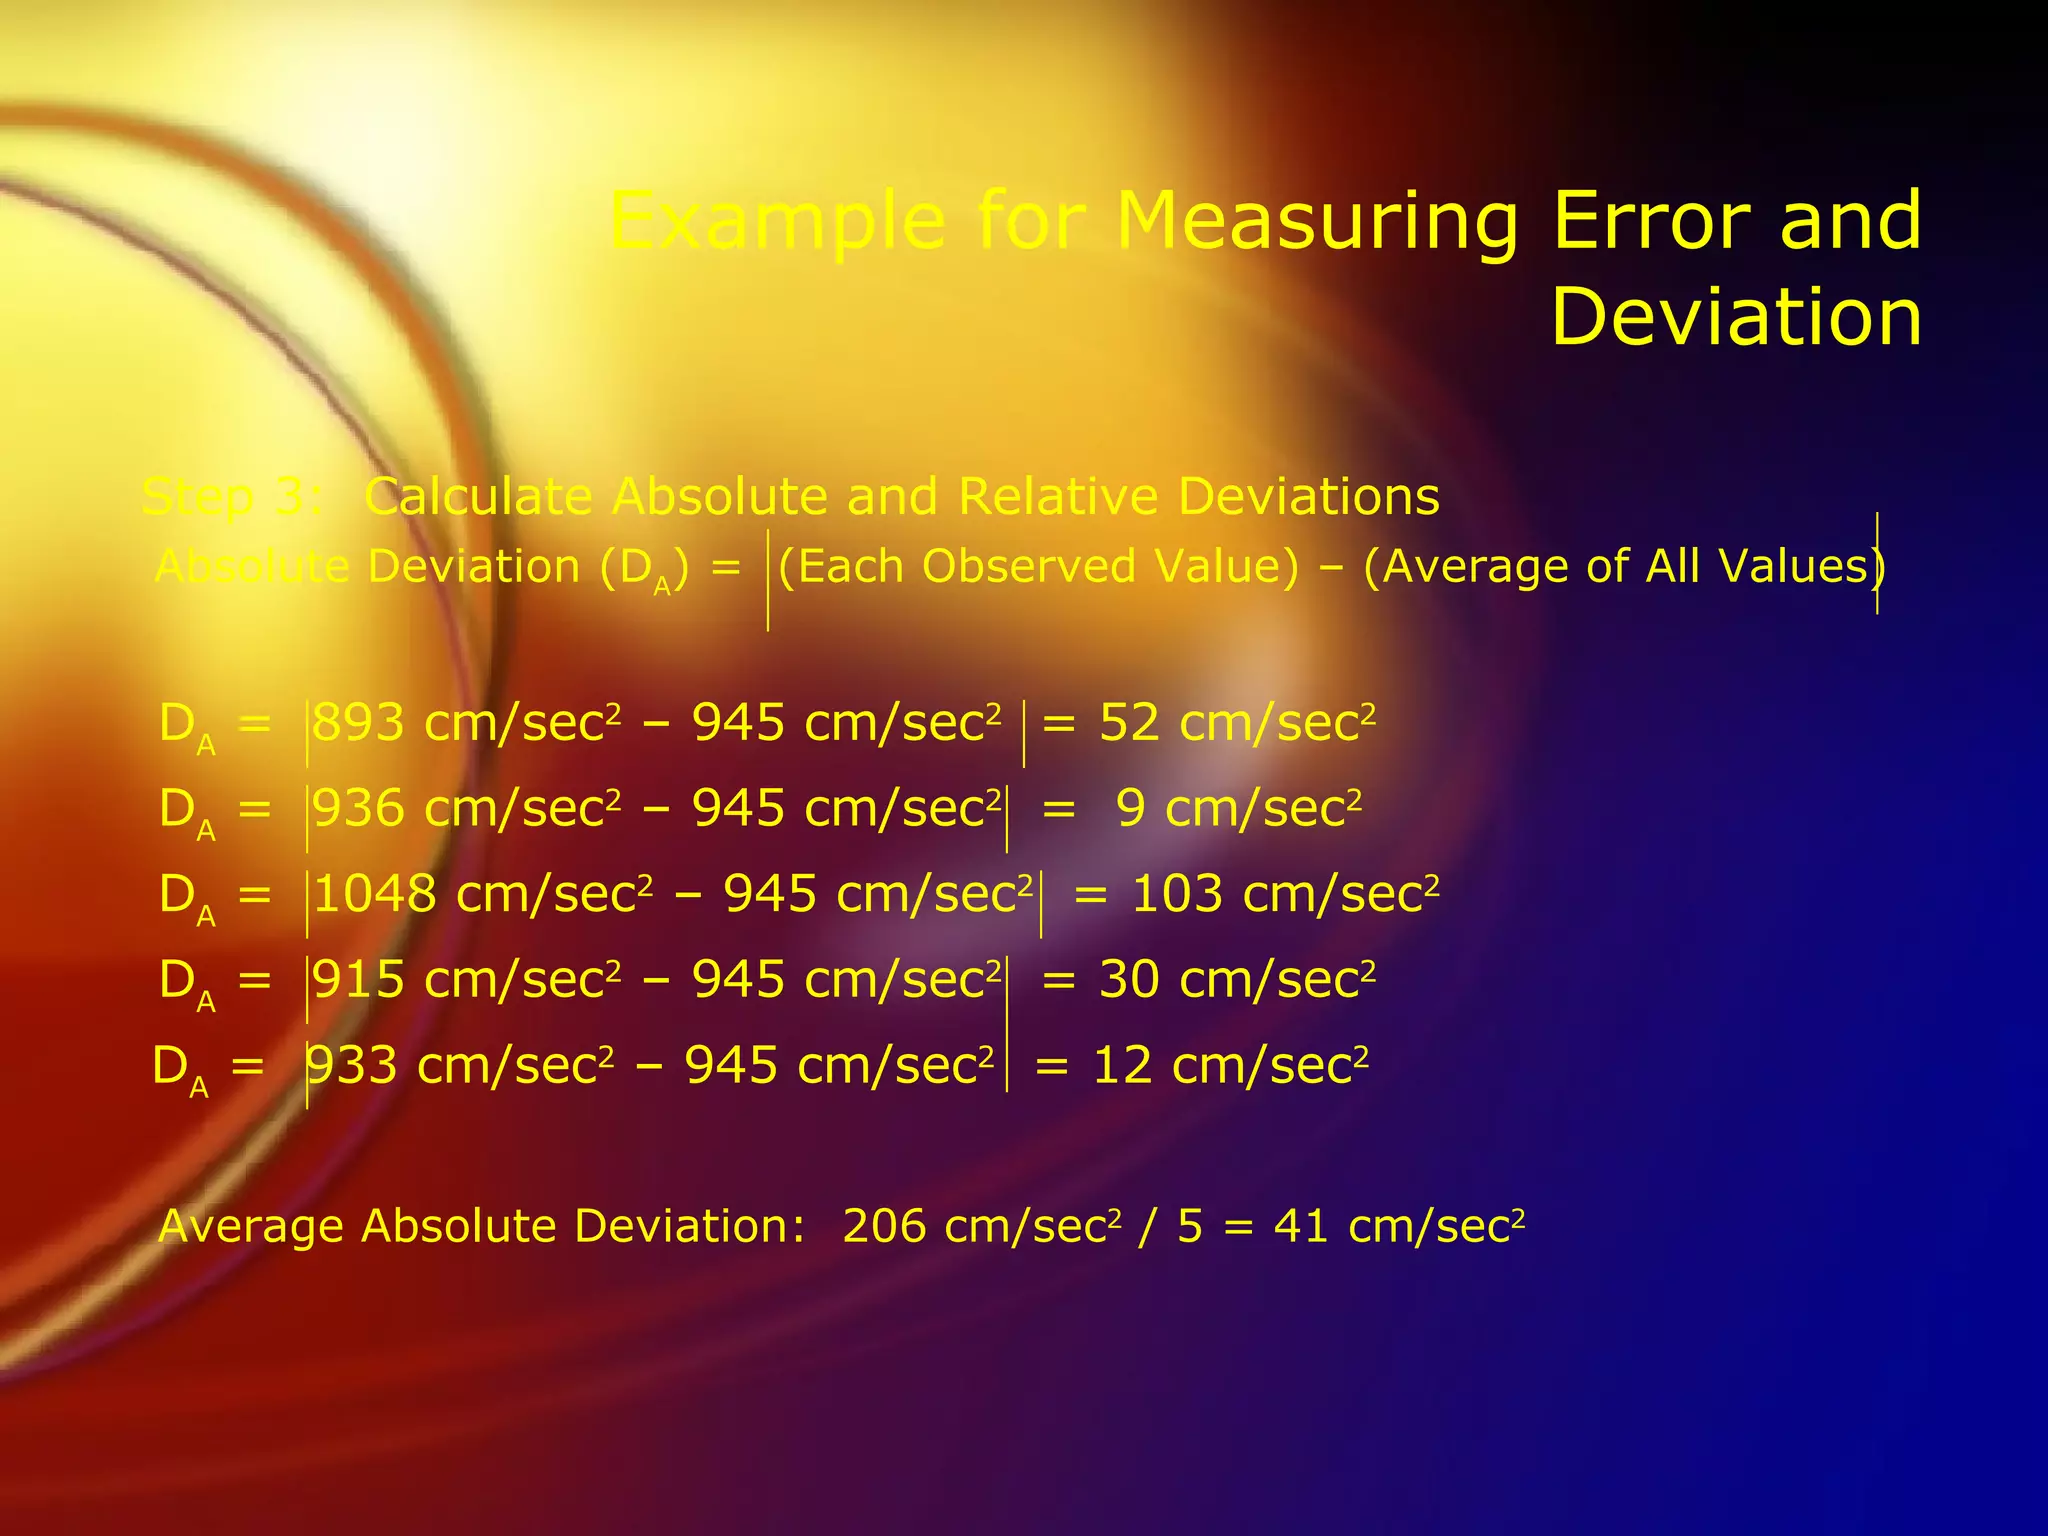
Example for MeasuringError and Deviation Step 3: Calculate Absolute and Relative Deviations Absolute Deviation (D A ) = (Each Observed Value) – (Average of All Values) D A = 893 cm/sec 2 – 945 cm/sec 2 = 52 cm/sec 2 D A = 936 cm/sec 2 – 945 cm/sec 2 = 9 cm/sec 2 D A = 1048 cm/sec 2 – 945 cm/sec 2 = 103 cm/sec 2 D A = 915 cm/sec 2 – 945 cm/sec 2 = 30 cm/sec 2 D A = 933 cm/sec 2 – 945 cm/sec 2 = 12 cm/sec 2 Average Absolute Deviation: 206 cm/sec 2 / 5 = 41 cm/sec 2
16.
Example for MeasuringError and Deviation Relative Deviation: Relative Deviation (D R ) = X 100% D R = x 100% = 4.3%
17.
Significant Figures Usually,you will estimate one digit beyond the smallest division on the measuring tool if the object you are measuring has a well defined edge. When reading a measurement that someone else has made, you must determine if the digits he/she has written down are significant to the measurement.
18.
Significant Figures Thosedigits in an observed quantity (measurement) that are known with certainty plus the one digit that is uncertain or estimated. The number of significant figures in a measurement depends on: