Activity Network diagram
•
3 likes•2,884 views

Activity network diagram helps to schedule a project efficiently. It gives an idea of the minimum and maximum time to complete a project. The 7th tool among the New 7 management development tool.
Report
Share
Report
Share
Download to read offline
Recommended
The Arrow - Advanced Kanban board
The Arrow is an advanced Kanban board design that limits WIP by visualizing n number of swim lanes.
Kaizen PDCA Cycle Process PowerPoint Presentation Slides
Need an engaging Plan-Do-Check-Act PowerPoint presentation for your next company meeting? Our professional designs have come out with Kaizen Pdca Cycle Process PowerPoint Presentation Slides having 80 complete readymade slide presentation to illustrate Pdca cycle. Using this PPT example you can highlight the importance of multi-step management method used in business for the control and continual improvement of processes and products. This example Kaizen Pdca Cycle Process PPT PowerPoint deck sample has slides like agenda, Kaizen 5S framework, 3 MUs Of Kaizen- Muda (Wastefulness), Mura (Imbalance), Muri (overload), 4M checklist, PDCA cycle, kaizen vs. innovation, problem and statement, our goals, action plan, competitor analysis, histograms, lead time and cycle time, solutions to the problem and many more. In addition, our PowerPoint show supports to highlight the understanding on types of waste like overproduction, waiting, transportation/moving, process inefficiencies, inventories/storage, unnecessary motions and defective products for better utilization of resources and to overcome business roadblocks. Using presentation templates of this visual communication you can discuss various Pdca models thereby motivating project team to become a part of this decision-making process. As we have included exclusive PowerPoint presentation slides like pareto analysis, implement countermeasures, kaizen report form, bar chart, pie chart, scatter area slides, comparison, dashboard etc. to make it complete. In short, our Pdca cycle process presentation deck not only saves time, but also has everything that a good Kaizen Pdca Cycle Process presentation example must carry. Just click to download. Take the call with our Kaizen Pdca Cycle Process PowerPoint Presentation Slides. Be certain to have the best answers in hand.
One page effective project status report
A weekly project status report template is key to project manager as as it covers the key aspects, schedule, risks and issues.
Project Conclusion PowerPoint Presentation Slides
Need to present a project summary report. Not to worry! We have come with content ready Project Conclusion PowerPoint Presentation Slides. This PPT has various slides on project management including, healthcard, dashboard, performance analysis, deadlines, milestones, budget and cost analysis, open issues etc. Business summary presentation background is custom made to serve the purpose of current professional scenario. Furthermore, project brief Presentation slide can also be used for similar topics like summary and conclusion, project performance report, project description etc. This complete PowerPoint presentation on project summary helps to analyze project performance. You can use this business report complete deck to present project cost revenues and budgets. Our project closure PPT is useful to recognize that objective set have been achieved or not. Download this content ready business summary PPT slide to give an overview of your business project. Bounce your thoughts of our Project Conclusion PowerPoint Presentation Slides They will give you a valuable response.
Kickoff Meeting Powerpoint Presentation Slides
Impress your clients by clearly defining base elements of the project and other project planning activities by using our kick-off meeting PowerPoint presentation slides. This project management kick-off meeting PowerPoint template consists a total of 28 ready to use slides like meeting agenda, project description, project scope, core team, project management team, responsibility assignment matrix, project management cycle, work breakdown structure, project cost estimate, project communication plan, project management Gantt chart, project tracking plan and many such slides. All the slides in this project kick-off meeting agenda are completely editable and can be adjusted as per individual requirements and needs. Be it the explaining your services to the client or to your internal team, this kick-off management PPT deck can be used for a crisp, short and very to the point explanation. The diagrams and visuals used in this kick-off agenda slideshow are attractive and self-explanatory to place the content in a stylish manner. Elaborate on holistic healing with our Kickoff Meeting Powerpoint Presentation Slides. Give due importance to the human element. https://bit.ly/3k7HbvF
8D Problem Solving Report Template with Guidance
This Template is created for helping the quality or continuous improvement professionals to generate a step by step problem solving report, which include the guidance on each steps in a 8D process, also include the templates of popular quality tools such as 5-Why and Fishbone Diagram.
想学习六西格玛?可以看看ucourse.org的网上课程。
http://ucourse.org/ssgb
Project Management Kickoff Meeting Template Powerpoint Presentation Slides
Download our ready to use Project Management Kick-off Meeting Template PowerPoint Presentation Slides to present the main project objective. Provide an initial overview of the project including vision goals and objectives with the help of this content ready kick-off meeting in project management PPT visuals. The project management kick-off meeting PowerPoint complete deck comprises of easy-to-understand templates such as project description and scope, core team, project management team, responsibility assignment matrix, RACI- rapid, project management cycle, work breakdown structure, project cost estimate, project management Gantt chart, communication plan, work priority allocation, tracking plan etc. Furthermore, all elements of given templates are fully customizable. This allows users to create a presentation very quickly. Explain the project, its background, business needs and why it is important for stakeholders and company using this initial project agenda presentation deck. Get access to this PPT design and you are ready to hold a project kick-off meeting. Our Project Management Kickoff Meeting Template Powerpoint Presentation Slides are good for group dynamics. They generate a collaborative feeling. https://bit.ly/3h7WGk9
Training - Introducing Agile, Lean and Kanban
This is a presentation that I did for a team to introduce them to Agile, Lean and Kanban, It covers these these 3 areas, how they overlap and then gets into greater details about the Kanban Method.
Projects Performance Analysis & Forecasting
Projects Performance Analysis & Forecasting Waleed Elbasyouni ,PgMP®,P3O®,PMP®,RMP®,KPI-P®,APMG-CH®,TOT®,SSYB™
Introduction
Overview of Key Performance Indicators ( KPI )
What Is The Earned Value Management ?
Why Project Managers Use EVM ?
Earned Value Management Terms and Formulas
Planned value (PV)
Earned value (EV)
Actual cost (AC)
Variance
Schedule Variance ( SV )
Cost Variance ( CV )
Performance Index
Schedule Performance Index (SPI)
Cost Performance Index (CPI)
Example ( Case Study )
Project Forecasting
Budget at Completion (BAC)
Estimate at Completion (EAC)
Estimate to Complete (ETC).
Variance at Completion (VAC)
To Complete Performance Index (TCPI)
Plan-Do-Check-Act (P-D-C-A)
This is a short presentation that I have created for explaining the iterative process for continuous improvement. It shows the Plan-Do-Check-Act (P-D-C-A) methodology that is standard practice in industry for process improvement and product improvement. This is a methodology used for developing anything from automobiles, to mobile phones, to software, and Information Technology.
Project Management - Basic Concepts
Project Management, Project Organization, PMI, PMBok, Project process groups, Project knowledge areas
An Introduction to kanban
Kanban is a tool that allows you to fully visualize the status of your processes through a board with dynamic columns that make all tasks and processes steps clear.
Project Deliverables Powerpoint Presentation Slides
“You can download this product from SlideTeam.net”
Slide Team presents you Project Deliverables PowerPoint Presentation Slides for managing and monitoring PM deliverables. This project output PowerPoint complete deck contains set of professional slides such as team structure, project timeline, project budget, work breakdown structure, activities, sequence, communication plan, task matrix, project work plan, project cost estimate, project management dashboard, etc. This exclusive deck with all sorts of editable charts, icons, and graphs will help you to strategize and plan project tasks. Project results PPT templates are designed by our team of experts after complete research and analysis of the subject. Utilize project gain PPT visuals for setting and managing expectation who is doing what from project initiation to closure. Planning is key to project success. You can deliver your project on expectations using project plan PowerPoint templates. Download project management presentation design for estimating work and monitoring progress. https://bit.ly/3jeSe4P
Project Execution PowerPoint Presentation Slides
Are you thinking to craft a good PPT on project execution? Not to worry! We have come up with the project execution PowerPoint presentation slides that will help you build up your key program deliverables. Using our project management PPT designs, you can promote your business plan by specifying project quality management, work plan, etc. Furthermore, these control execution PPT graphics have been incorporated by highly qualified designers & with extensive research. Furthermore, our project development presentation illustrations cover all the related templates such as project progress summary, issues management, line chart, clustered column chart and many more. What more do you expect? In addition to this, execution plan PowerPoint designs can also be used for similar topics such as program documentation, execution plan, earned value management, risk analysis matrix, resource allocation, critical path method, product benefit realization, program charter, and responsibility assignment matrix. So without wasting your time, just grab our PowerPoint Visuals. Evaluate concepts with our Project Execution PowerPoint Presentation Slides. Be able to assess the depth behind it.
Introduction to Kanban
In this presentation, Roni explains the basics of Kanban and the principles governing the application of Kanban for process improvement. We also look at a comparison between Scrum and Kanban and visit the basic differences between them.
It includes pointers telling what’s wrong with the current system, history of Kanban, introduction to Kanban, benefits of using Kanban, practices used in Kanban, principles of Kanban, how is Scrum different from Kanban. The tutorial begins with details about the current system and what’s wrong with it. It includes pointers like burnout, low throughput, unidentified bottlenecks, too much work which tell what’s wrong with the current system.
Followed by is a section about the history of Kanban which includes points like how the name originated, who discovered it, design, visual signals, based on which system. Resulting in an introduction section which talks about Kanban, what method it uses, scheduling system, what it consists of, amount of work, identification etc. Next comes the benefits section which includes the benefits of using Kanban like helps in visualizing the system, allows to evaluate, identify bottlenecks, establish trust in process etc.
Afterwards there is a section about Kanban practices. It includes practices used in Kanban like visualize, limit WIP in each phase of development, managing flow by keeping it under monitor, make policies explicit, improve collaboratively through the use of scientific models and some terms like lead time, cycle time, throughput etc. Moreover, it also includes the board for easy visualization, story card for keeping track, charts for measurement, control charts to measure average time taken for each task, cumulative flow diagrams showing relative amount of work.
Then comes the principles of Kanban. It includes principles which should be used in Kanban like agree to pursue incremental, evolutionary change, optimize what already exists, respect the current process, roles, responsibilities, leadership at all levels to empower the workforce to bring about change. The last section of this tutorial is Scrum vs Kanban. It explains how scrum is different from Kanban by giving pointers like Scrum prescribes roles, time boxed iterations, backlog items must fit, limit WIP in a different way. It also includes pointers giving reason why it shouldn’t matter because emphasis should be on the goal and not the tool.
Project management life cycle
A very basic information related to different project concepts and a snapshot of five Project Process Groups
Intro to Kanban - AgileDayChile2011 Keynote
Keynote from Dabid J. Anderson (@agilemanager) on AgileDayChile 2011, november 17 2011
Kanban
Imported from Japan, Kanban is an agile methodology that is gaining a lot of traction. Kanban, or Japanese for signal card, is a process that focuses on transparency and limiting the work in progress. By utilizing Kanban, you can pinpoint the bottlenecks and address them easily. In this session you will learn what Kanban is, how it evolved from its roots in the Toyota Production System (TPS) and lean manufacturing to software development, Kanban’s benefits, and how best to implement a Kanban system. We’ll also discuss when not to use Kanban and how to modify other agile methodologies, such as Scrum, to be used in conjunction with Kanban.
Information technology specialist performance appraisal
Information technology specialist job description,Information technology specialist goals & objectives,Information technology specialist KPIs & KRAs,Information technology specialist self appraisal
VSM - Value Stream Mapping for made-to-order manufacturing
Value stream mapping education for a made-to-order manufacturer
7 QC Tools PDF | An eBook with A Detailed Description and Practical Examples
Follow the link https://payhip.com/b/VCtH to download the complete eBook of '7 QC Tools PDF.
Train yourself and be the master of 7 QC Tools with this eBook of 7 QC Tools in PDF with a detailed description and illustrative examples of all 7 Quality Control Tools. Learn to construct the Histogram, Pareto Chart, Scatter Chart, Control Charts in Excel and analyze the data in Excel.
Process Decision and Program Chart
Process Decision and Program is designed to achieve a particular objective. Used especially in new process development. The tool avoids surprises and identifies the possible countermeasures.
More Related Content
What's hot
Project Management Kickoff Meeting Template Powerpoint Presentation Slides
Download our ready to use Project Management Kick-off Meeting Template PowerPoint Presentation Slides to present the main project objective. Provide an initial overview of the project including vision goals and objectives with the help of this content ready kick-off meeting in project management PPT visuals. The project management kick-off meeting PowerPoint complete deck comprises of easy-to-understand templates such as project description and scope, core team, project management team, responsibility assignment matrix, RACI- rapid, project management cycle, work breakdown structure, project cost estimate, project management Gantt chart, communication plan, work priority allocation, tracking plan etc. Furthermore, all elements of given templates are fully customizable. This allows users to create a presentation very quickly. Explain the project, its background, business needs and why it is important for stakeholders and company using this initial project agenda presentation deck. Get access to this PPT design and you are ready to hold a project kick-off meeting. Our Project Management Kickoff Meeting Template Powerpoint Presentation Slides are good for group dynamics. They generate a collaborative feeling. https://bit.ly/3h7WGk9
Training - Introducing Agile, Lean and Kanban
This is a presentation that I did for a team to introduce them to Agile, Lean and Kanban, It covers these these 3 areas, how they overlap and then gets into greater details about the Kanban Method.
Projects Performance Analysis & Forecasting
Projects Performance Analysis & Forecasting Waleed Elbasyouni ,PgMP®,P3O®,PMP®,RMP®,KPI-P®,APMG-CH®,TOT®,SSYB™
Introduction
Overview of Key Performance Indicators ( KPI )
What Is The Earned Value Management ?
Why Project Managers Use EVM ?
Earned Value Management Terms and Formulas
Planned value (PV)
Earned value (EV)
Actual cost (AC)
Variance
Schedule Variance ( SV )
Cost Variance ( CV )
Performance Index
Schedule Performance Index (SPI)
Cost Performance Index (CPI)
Example ( Case Study )
Project Forecasting
Budget at Completion (BAC)
Estimate at Completion (EAC)
Estimate to Complete (ETC).
Variance at Completion (VAC)
To Complete Performance Index (TCPI)
Plan-Do-Check-Act (P-D-C-A)
This is a short presentation that I have created for explaining the iterative process for continuous improvement. It shows the Plan-Do-Check-Act (P-D-C-A) methodology that is standard practice in industry for process improvement and product improvement. This is a methodology used for developing anything from automobiles, to mobile phones, to software, and Information Technology.
Project Management - Basic Concepts
Project Management, Project Organization, PMI, PMBok, Project process groups, Project knowledge areas
An Introduction to kanban
Kanban is a tool that allows you to fully visualize the status of your processes through a board with dynamic columns that make all tasks and processes steps clear.
Project Deliverables Powerpoint Presentation Slides
“You can download this product from SlideTeam.net”
Slide Team presents you Project Deliverables PowerPoint Presentation Slides for managing and monitoring PM deliverables. This project output PowerPoint complete deck contains set of professional slides such as team structure, project timeline, project budget, work breakdown structure, activities, sequence, communication plan, task matrix, project work plan, project cost estimate, project management dashboard, etc. This exclusive deck with all sorts of editable charts, icons, and graphs will help you to strategize and plan project tasks. Project results PPT templates are designed by our team of experts after complete research and analysis of the subject. Utilize project gain PPT visuals for setting and managing expectation who is doing what from project initiation to closure. Planning is key to project success. You can deliver your project on expectations using project plan PowerPoint templates. Download project management presentation design for estimating work and monitoring progress. https://bit.ly/3jeSe4P
Project Execution PowerPoint Presentation Slides
Are you thinking to craft a good PPT on project execution? Not to worry! We have come up with the project execution PowerPoint presentation slides that will help you build up your key program deliverables. Using our project management PPT designs, you can promote your business plan by specifying project quality management, work plan, etc. Furthermore, these control execution PPT graphics have been incorporated by highly qualified designers & with extensive research. Furthermore, our project development presentation illustrations cover all the related templates such as project progress summary, issues management, line chart, clustered column chart and many more. What more do you expect? In addition to this, execution plan PowerPoint designs can also be used for similar topics such as program documentation, execution plan, earned value management, risk analysis matrix, resource allocation, critical path method, product benefit realization, program charter, and responsibility assignment matrix. So without wasting your time, just grab our PowerPoint Visuals. Evaluate concepts with our Project Execution PowerPoint Presentation Slides. Be able to assess the depth behind it.
Introduction to Kanban
In this presentation, Roni explains the basics of Kanban and the principles governing the application of Kanban for process improvement. We also look at a comparison between Scrum and Kanban and visit the basic differences between them.
It includes pointers telling what’s wrong with the current system, history of Kanban, introduction to Kanban, benefits of using Kanban, practices used in Kanban, principles of Kanban, how is Scrum different from Kanban. The tutorial begins with details about the current system and what’s wrong with it. It includes pointers like burnout, low throughput, unidentified bottlenecks, too much work which tell what’s wrong with the current system.
Followed by is a section about the history of Kanban which includes points like how the name originated, who discovered it, design, visual signals, based on which system. Resulting in an introduction section which talks about Kanban, what method it uses, scheduling system, what it consists of, amount of work, identification etc. Next comes the benefits section which includes the benefits of using Kanban like helps in visualizing the system, allows to evaluate, identify bottlenecks, establish trust in process etc.
Afterwards there is a section about Kanban practices. It includes practices used in Kanban like visualize, limit WIP in each phase of development, managing flow by keeping it under monitor, make policies explicit, improve collaboratively through the use of scientific models and some terms like lead time, cycle time, throughput etc. Moreover, it also includes the board for easy visualization, story card for keeping track, charts for measurement, control charts to measure average time taken for each task, cumulative flow diagrams showing relative amount of work.
Then comes the principles of Kanban. It includes principles which should be used in Kanban like agree to pursue incremental, evolutionary change, optimize what already exists, respect the current process, roles, responsibilities, leadership at all levels to empower the workforce to bring about change. The last section of this tutorial is Scrum vs Kanban. It explains how scrum is different from Kanban by giving pointers like Scrum prescribes roles, time boxed iterations, backlog items must fit, limit WIP in a different way. It also includes pointers giving reason why it shouldn’t matter because emphasis should be on the goal and not the tool.
Project management life cycle
A very basic information related to different project concepts and a snapshot of five Project Process Groups
Intro to Kanban - AgileDayChile2011 Keynote
Keynote from Dabid J. Anderson (@agilemanager) on AgileDayChile 2011, november 17 2011
Kanban
Imported from Japan, Kanban is an agile methodology that is gaining a lot of traction. Kanban, or Japanese for signal card, is a process that focuses on transparency and limiting the work in progress. By utilizing Kanban, you can pinpoint the bottlenecks and address them easily. In this session you will learn what Kanban is, how it evolved from its roots in the Toyota Production System (TPS) and lean manufacturing to software development, Kanban’s benefits, and how best to implement a Kanban system. We’ll also discuss when not to use Kanban and how to modify other agile methodologies, such as Scrum, to be used in conjunction with Kanban.
Information technology specialist performance appraisal
Information technology specialist job description,Information technology specialist goals & objectives,Information technology specialist KPIs & KRAs,Information technology specialist self appraisal
VSM - Value Stream Mapping for made-to-order manufacturing
Value stream mapping education for a made-to-order manufacturer
What's hot (20)
Project Management Kickoff Meeting Template Powerpoint Presentation Slides
Project Management Kickoff Meeting Template Powerpoint Presentation Slides
Project Deliverables Powerpoint Presentation Slides
Project Deliverables Powerpoint Presentation Slides
Information technology specialist performance appraisal
Information technology specialist performance appraisal
VSM - Value Stream Mapping for made-to-order manufacturing
VSM - Value Stream Mapping for made-to-order manufacturing
More from Shakehand with Life
7 QC Tools PDF | An eBook with A Detailed Description and Practical Examples
Follow the link https://payhip.com/b/VCtH to download the complete eBook of '7 QC Tools PDF.
Train yourself and be the master of 7 QC Tools with this eBook of 7 QC Tools in PDF with a detailed description and illustrative examples of all 7 Quality Control Tools. Learn to construct the Histogram, Pareto Chart, Scatter Chart, Control Charts in Excel and analyze the data in Excel.
Process Decision and Program Chart
Process Decision and Program is designed to achieve a particular objective. Used especially in new process development. The tool avoids surprises and identifies the possible countermeasures.
New 7 QC Tools Module 5 | Prioritization matrices
Prioritization matrix prioritizes issues, based on weighted criteria using a combination of Tree and Matrix diagram. It is a very important tool for the management to prioritize the issue to work on.
New 7 QC Tools Module 4 | Matrix diagram
Matrix diagram analyzes and rates the relationship between two or more variables. It is another important management development tool.
New 7 QC Tools Module 3 | Tree diagram
The third tool of New 7 QC Tools is Tree diagram. Tree diagram reduces any broad objective into increasing levels of details.
New 7 QC Tools Module 2 | Interrelationship Digraph
Interrelationship digraph is another important tool out of New 7 Quality Tools. It helps to clarify the interrelationship of many factors of a complex situation. It identifies key drivers and the key outcomes.
New 7 QC Tools | 7 Management Development Tools
New 7 QC Tools; Affinity diagram, Interrelationship digraph, Tree diagram, Matrix diagram, Prioritization matrices, Process Decision and Program Chart (PDPC), and Activity Network Diagram. The New 7 QC Tools also known as 7 Management Development Tools. These tools unlike the 7 fundamentals quality control tools, process the subjective data and help the management to make the better decision, regarding project management and quality improvement.
New 7 QC Tool-Module 1 | Affinity diagram
The affinity diagram is one among the New 7 Quality Contol tools, helps to categorize the same type of ideas or issues. Affintiy diagram process the same type of subjective data in a particular category.
Course Catalog 2016 - 17
Course Catalog 2016-17, is the overview of various corporate trainings courses for our deemed clientele, so that they can lock the dates for in-house training facilitation at company site in the year of 2016-17.
7 qc tools and spc training, December. 2015
7 QC Tools and SPC Training Dec.2015. Send nominations before 15 Nov. 2015 and get an attractive discount for early birds. Group discount for 5 or more is also available. For nomination form or call; 9468267324, 8684861131, e-mail shakehandwithlife@gmail.com,
Hypothesis testing; z test, t-test. f-test
Hypothesis is usually considered as the principal instrument in research and quality control. Its main function is to suggest new experiments and observations. In fact, many experiments are carried out with the deliberate object of testing hypothesis. Decision makers often face situations wherein they are interested in testing hypothesis on the basis of available information and then take decisions on the basis of such testing. In Six –Sigma methodology, hypothesis testing is a tool of substance and used in analysis phase of the six sigma project so that improvement can be done in right direction
Sharma narender; a brief profile
People are often like a train, some are like its engine, leading the train forward. Some are like the bogies, chugging along, following the leader. While a few others are like the brakes, putting a stop to its motion. A leader is like the engine of this train. A man who will lead with trust and honesty, with speed and also ensure there are no accidents.”…………………………Narender Sharma
Times of India, LEAD INDIA, MAIL BOX, Page 2, dated; Aug. 24, 2007
Seven QC Tools Training; Quiz
Go through the seven quality tools training quiz and compare, how much you have learnt from this online training of 7QC tools? The quiz has 15 multiple choice questions based on seven quality tools. Choose one answer out of the given choices for every question write these choices on a paper. After completing the quiz compare yourself with answer key in the end of quiz. Find yourself where you are in learning of 7 QC Tools. If you find your performance is not up to the mark then go again for the training of seven QC tools. You may do it as many times as you want. Improve your performance every time you go through the training.
Seven QC Tools Training; Control Charts (Mean Chart and Range Chart)
Seven quality tools training is incomplete without learning of control charts. Control charts help to control the process with in the set control limits. Control charts are mainly two types; Mean Chart and Range Chart. Mean chart showcase the process data complied by the designated person and signal when the data go beyond the control limits. Every process has variation and due to this variation data get fluctuated. This fluctuation shown on the mean and range chart by data points. The causes of fluctuation in the data are assignable and common causes. Due to common causes data fluctuated around the average of the data but due to assignable cause data go beyond the control limits. When data go beyond the control limits control charts warn the operator that something is going wrong in the process and need to special attention. Mean chart is the spread of the mean values of the samples around the mean line. Range chart is spread of the range of samples around the mean line of range.
Seven QC Tools Training; Scatter Diagram
Scatter diagram is the graphical presentation of relationship between two variables. Scatter diagram is an important tool out of 7 fundamental tools of quality control. Scatter diagram helps to confirm the degree of relationship between cause and effect. Here cause is an independent variable and effect is dependent variable. Scatter diagram is an important statistical tool to analyze the relationship of two variables. To create the scatter diagram take the values of independent variable on X-Axis where as the dependent variable is taken on Y-Axis. Plot the intersection points of X and Y on the graph. Draw a straight line passing through all the points. Analyze the pattern of the points. For different degree of relationship different pattern of scatter diagram is formed. If Y increases as X increases and data points are on the straight line then there is perfect positive correlation. If Y decreases with increase of X and data points are on the straight line then there is perfect negative correlation. But when data is scattered all over the graph then there is zero correlation.
Seven QC Tools Training; Process Flow Chart
Process flow chart or Flow process chart among the seven quality control tools considered as the first and base of application of every quality tool. Process flow chart is the pictorial representations of all activities of process using different shape of boxes. Process flow chart is the guiding map of the whole process. With a single view, process flow chart gives almost every information about the whole process. Process flow diagram inform the starting and end point of the process along with the operations, decision, storage, delay, direction etc. through which the product or service passing. Different shapes like circle, rectangular circle, diamond, rectangle, arrows, D shapes, inverted rectangles etc. are used to construct process flow diagram. Process flow diagram clearly explains which operation is followed by which operation. Process flow chart helps to find out the potential trouble spots in the process so that corrective action can be taken to remove the hurdles at an early stage. To audit the whole process, process flow chart plays a vital role. Even for the new comers in the organization, process flow chart is an opportunity to understand their process easily.
7 qc toolsTraining pdf
Visit www.shakehandwithlife.in to buy this Book. This E-Book on 7QC tools is complete training workshop for Junior, Middle and Senior quality quality professionals. The USP of this workshop is the text and graphics in the book for understanding the tools while applying to solve the practial problems. Illustrative worked examples , Construction of tools in Excel like Histogram, Pareto Chart, Scatter Diagram, Control charts are beautifully explained in step step manner. A newcomer in the area of quality can easily understand how the tools be used and applied.
Measure of dispersion part II ( Standard Deviation, variance, coefficient of ...
This tutorial gives the detailed explanation measure of dispersion part II (standard deviation, properties of standard deviation, variance, and coefficient of variation). It also explains why std. deviation is used widely in place of variance. This tutorial also teaches the MS excel commands of calculation in excel.
Measure of dispersion part I (Range, Quartile Deviation, Interquartile devi...
This tutorial gives the detailed explanation of "Measure of Dispersion" (Range, Quartile Deviation, Interquartile Range, Mean Deviation) with suitable illustrative example with MS Excel Commands of calculation in excel.
Measure of central tendency (Mean, Median and Mode)
This tutorial explain the measure of central tendency (Mean, Median and Mode in detail with suitable working examples pictures. The tutorial also teach the excel commands for calculation of Mean, Median and Mode.
More from Shakehand with Life (20)
7 QC Tools PDF | An eBook with A Detailed Description and Practical Examples
7 QC Tools PDF | An eBook with A Detailed Description and Practical Examples
New 7 QC Tools Module 2 | Interrelationship Digraph
New 7 QC Tools Module 2 | Interrelationship Digraph
Seven QC Tools Training; Control Charts (Mean Chart and Range Chart)
Seven QC Tools Training; Control Charts (Mean Chart and Range Chart)
Measure of dispersion part II ( Standard Deviation, variance, coefficient of ...
Measure of dispersion part II ( Standard Deviation, variance, coefficient of ...
Measure of dispersion part I (Range, Quartile Deviation, Interquartile devi...
Measure of dispersion part I (Range, Quartile Deviation, Interquartile devi...
Measure of central tendency (Mean, Median and Mode)
Measure of central tendency (Mean, Median and Mode)
Recently uploaded
Risk-Management-presentation for cooperatives
Power point presentation for risk management for cooperatives
Senior Project and Engineering Leader Jim Smith.pdf
I am a Project and Engineering Leader with extensive experience as a Business Operations Leader, Technical Project Manager, Engineering Manager and Operations Experience for Domestic and International companies such as Electrolux, Carrier, and Deutz. I have developed new products using Stage Gate development/MS Project/JIRA, for the pro-duction of Medical Equipment, Large Commercial Refrigeration Systems, Appliances, HVAC, and Diesel engines.
My experience includes:
Managed customized engineered refrigeration system projects with high voltage power panels from quote to ship, coordinating actions between electrical engineering, mechanical design and application engineering, purchasing, production, test, quality assurance and field installation. Managed projects $25k to $1M per project; 4-8 per month. (Hussmann refrigeration)
Successfully developed the $15-20M yearly corporate capital strategy for manufacturing, with the Executive Team and key stakeholders. Created project scope and specifications, business case, ROI, managed project plans with key personnel for nine consumer product manufacturing and distribution sites; to support the company’s strategic sales plan.
Over 15 years of experience managing and developing cost improvement projects with key Stakeholders, site Manufacturing Engineers, Mechanical Engineers, Maintenance, and facility support personnel to optimize pro-duction operations, safety, EHS, and new product development. (BioLab, Deutz, Caire)
Experience working as a Technical Manager developing new products with chemical engineers and packaging engineers to enhance and reduce the cost of retail products. I have led the activities of multiple engineering groups with diverse backgrounds.
Great experience managing the product development of products which utilize complex electrical controls, high voltage power panels, product testing, and commissioning.
Created project scope, business case, ROI for multiple capital projects to support electrotechnical assembly and CPG goods. Identified project cost, risk, success criteria, and performed equipment qualifications. (Carrier, Electrolux, Biolab, Price, Hussmann)
Created detailed projects plans using MS Project, Gant charts in excel, and updated new product development in Jira for stakeholders and project team members including critical path.
Great knowledge of ISO9001, NFPA, OSHA regulations.
User level knowledge of MRP/SAP, MS Project, Powerpoint, Visio, Mastercontrol, JIRA, Power BI and Tableau.
I appreciate your consideration, and look forward to discussing this role with you, and how I can lead your company’s growth and profitability. I can be contacted via LinkedIn via phone or E Mail.
Jim Smith
678-993-7195
jimsmith30024@gmail.com
Enriching engagement with ethical review processes
New ethics review processes at the University of Bath. Presented at the 8th World Conference on Research Integrity by Filipa Vance, Head of Research Governance and Compliance at the University of Bath. June 2024, Athens
Case Analysis - The Sky is the Limit | Principles of Management
The case study discusses the potential of drone delivery and the challenges that need to be addressed before it becomes widespread.
Key takeaways:
Drone delivery is in its early stages: Amazon's trial in the UK demonstrates the potential for faster deliveries, but it's still limited by regulations and technology.
Regulations are a major hurdle: Safety concerns around drone collisions with airplanes and people have led to restrictions on flight height and location.
Other challenges exist: Who will use drone delivery the most? Is it cost-effective compared to traditional delivery trucks?
Discussion questions:
Managerial challenges: Integrating drones requires planning for new infrastructure, training staff, and navigating regulations. There are also marketing and recruitment considerations specific to this technology.
External forces vary by country: Regulations, consumer acceptance, and infrastructure all differ between countries.
Demographics matter: Younger generations might be more receptive to drone delivery, while older populations might have concerns.
Stakeholders for Amazon: Customers, regulators, aviation authorities, and competitors are all stakeholders. Regulators likely hold the greatest influence as they determine the feasibility of drone delivery.
Employment Practices
Regulation and Multinational Corporations
Employment Practices
Regulation and Multinational Corporations
Strategic decision making within MNCs constrained or determined by the implementation of laws and codes of practice and by pressure from political actors. Managers in MNCs have to make choices that are shaped by gvmt. intervention and the local economy.
Public Speaking Tips to Help You Be A Strong Leader.pdf
In the realm of effective leadership, a multitude of skills come into play, but one stands out as both crucial and challenging: public speaking.
Public speaking transcends mere eloquence; it serves as the medium through which leaders articulate their vision, inspire action, and foster engagement. For leaders, refining public speaking skills is essential, elevating their ability to influence, persuade, and lead with resolute conviction. Here are some key tips to consider: https://joellandau.com/the-public-speaking-tips-to-help-you-be-a-stronger-leader/
Integrity in leadership builds trust by ensuring consistency between words an...
Integrity in leadership builds trust by ensuring consistency between words and actions, making leaders reliable and credible. It also ensures ethical decision-making, which fosters a positive organizational culture and promotes long-term success. #RamVChary
原版制作(CDU毕业证书)查尔斯达尔文大学毕业证PDF成绩单一模一样
学校原件一模一样【微信:741003700 】《(CDU毕业证书)查尔斯达尔文大学毕业证PDF成绩单》【微信:741003700 】学位证,留信认证(真实可查,永久存档)原件一模一样纸张工艺/offer、雅思、外壳等材料/诚信可靠,可直接看成品样本,帮您解决无法毕业带来的各种难题!外壳,原版制作,诚信可靠,可直接看成品样本。行业标杆!精益求精,诚心合作,真诚制作!多年品质 ,按需精细制作,24小时接单,全套进口原装设备。十五年致力于帮助留学生解决难题,包您满意。
本公司拥有海外各大学样板无数,能完美还原。
1:1完美还原海外各大学毕业材料上的工艺:水印,阴影底纹,钢印LOGO烫金烫银,LOGO烫金烫银复合重叠。文字图案浮雕、激光镭射、紫外荧光、温感、复印防伪等防伪工艺。材料咨询办理、认证咨询办理请加学历顾问Q/微741003700
【主营项目】
一.毕业证【q微741003700】成绩单、使馆认证、教育部认证、雅思托福成绩单、学生卡等!
二.真实使馆公证(即留学回国人员证明,不成功不收费)
三.真实教育部学历学位认证(教育部存档!教育部留服网站永久可查)
四.办理各国各大学文凭(一对一专业服务,可全程监控跟踪进度)
如果您处于以下几种情况:
◇在校期间,因各种原因未能顺利毕业……拿不到官方毕业证【q/微741003700】
◇面对父母的压力,希望尽快拿到;
◇不清楚认证流程以及材料该如何准备;
◇回国时间很长,忘记办理;
◇回国马上就要找工作,办给用人单位看;
◇企事业单位必须要求办理的
◇需要报考公务员、购买免税车、落转户口
◇申请留学生创业基金
留信网认证的作用:
1:该专业认证可证明留学生真实身份
2:同时对留学生所学专业登记给予评定
3:国家专业人才认证中心颁发入库证书
4:这个认证书并且可以归档倒地方
5:凡事获得留信网入网的信息将会逐步更新到个人身份内,将在公安局网内查询个人身份证信息后,同步读取人才网入库信息
6:个人职称评审加20分
7:个人信誉贷款加10分
8:在国家人才网主办的国家网络招聘大会中纳入资料,供国家高端企业选择人才
W.H.Bender Quote 65 - The Team Member and Guest Experience
The Team Member and Guest Experience - Lead and Take Care of your restaurant team. They are the people closest to and delivering Hospitality to your paying Guests!
Make the call, and we can assist you.
408-784-7371
Foodservice Consulting + Design
在线办理(Murdoch毕业证书)莫道克大学毕业证电子版成绩单一模一样
学校原件一模一样【微信:741003700 】《(Murdoch毕业证书)莫道克大学毕业证电子版成绩单》【微信:741003700 】学位证,留信认证(真实可查,永久存档)原件一模一样纸张工艺/offer、雅思、外壳等材料/诚信可靠,可直接看成品样本,帮您解决无法毕业带来的各种难题!外壳,原版制作,诚信可靠,可直接看成品样本。行业标杆!精益求精,诚心合作,真诚制作!多年品质 ,按需精细制作,24小时接单,全套进口原装设备。十五年致力于帮助留学生解决难题,包您满意。
本公司拥有海外各大学样板无数,能完美还原。
1:1完美还原海外各大学毕业材料上的工艺:水印,阴影底纹,钢印LOGO烫金烫银,LOGO烫金烫银复合重叠。文字图案浮雕、激光镭射、紫外荧光、温感、复印防伪等防伪工艺。材料咨询办理、认证咨询办理请加学历顾问Q/微741003700
【主营项目】
一.毕业证【q微741003700】成绩单、使馆认证、教育部认证、雅思托福成绩单、学生卡等!
二.真实使馆公证(即留学回国人员证明,不成功不收费)
三.真实教育部学历学位认证(教育部存档!教育部留服网站永久可查)
四.办理各国各大学文凭(一对一专业服务,可全程监控跟踪进度)
如果您处于以下几种情况:
◇在校期间,因各种原因未能顺利毕业……拿不到官方毕业证【q/微741003700】
◇面对父母的压力,希望尽快拿到;
◇不清楚认证流程以及材料该如何准备;
◇回国时间很长,忘记办理;
◇回国马上就要找工作,办给用人单位看;
◇企事业单位必须要求办理的
◇需要报考公务员、购买免税车、落转户口
◇申请留学生创业基金
留信网认证的作用:
1:该专业认证可证明留学生真实身份
2:同时对留学生所学专业登记给予评定
3:国家专业人才认证中心颁发入库证书
4:这个认证书并且可以归档倒地方
5:凡事获得留信网入网的信息将会逐步更新到个人身份内,将在公安局网内查询个人身份证信息后,同步读取人才网入库信息
6:个人职称评审加20分
7:个人信誉贷款加10分
8:在国家人才网主办的国家网络招聘大会中纳入资料,供国家高端企业选择人才
一比一原版杜克大学毕业证(Duke毕业证)成绩单留信认证
毕业原版【微信:41543339】【杜克大学毕业证(Duke毕业证)】【微信:41543339】成绩单、外壳、offer、留信学历认证(永久存档真实可查)采用学校原版纸张、特殊工艺完全按照原版一比一制作(包括:隐形水印,阴影底纹,钢印LOGO烫金烫银,LOGO烫金烫银复合重叠,文字图案浮雕,激光镭射,紫外荧光,温感,复印防伪)行业标杆!精益求精,诚心合作,真诚制作!多年品质 ,按需精细制作,24小时接单,全套进口原装设备,十五年致力于帮助留学生解决难题,业务范围有加拿大、英国、澳洲、韩国、美国、新加坡,新西兰等学历材料,包您满意。
【我们承诺采用的是学校原版纸张(纸质、底色、纹路),我们拥有全套进口原装设备,特殊工艺都是采用不同机器制作,仿真度基本可以达到100%,所有工艺效果都可提前给客户展示,不满意可以根据客户要求进行调整,直到满意为止!】
【业务选择办理准则】
一、工作未确定,回国需先给父母、亲戚朋友看下文凭的情况,办理一份就读学校的毕业证【微信41543339】文凭即可
二、回国进私企、外企、自己做生意的情况,这些单位是不查询毕业证真伪的,而且国内没有渠道去查询国外文凭的真假,也不需要提供真实教育部认证。鉴于此,办理一份毕业证【微信41543339】即可
三、进国企,银行,事业单位,考公务员等等,这些单位是必需要提供真实教育部认证的,办理教育部认证所需资料众多且烦琐,所有材料您都必须提供原件,我们凭借丰富的经验,快捷的绿色通道帮您快速整合材料,让您少走弯路。
留信网认证的作用:
1:该专业认证可证明留学生真实身份
2:同时对留学生所学专业登记给予评定
3:国家专业人才认证中心颁发入库证书
4:这个认证书并且可以归档倒地方
5:凡事获得留信网入网的信息将会逐步更新到个人身份内,将在公安局网内查询个人身份证信息后,同步读取人才网入库信息
6:个人职称评审加20分
7:个人信誉贷款加10分
8:在国家人才网主办的国家网络招聘大会中纳入资料,供国家高端企业选择人才
留信网服务项目:
1、留学生专业人才库服务(留信分析)
2、国(境)学习人员提供就业推荐信服务
3、留学人员区块链存储服务
→ 【关于价格问题(保证一手价格)】
我们所定的价格是非常合理的,而且我们现在做得单子大多数都是代理和回头客户介绍的所以一般现在有新的单子 我给客户的都是第一手的代理价格,因为我想坦诚对待大家 不想跟大家在价格方面浪费时间
对于老客户或者被老客户介绍过来的朋友,我们都会适当给一些优惠。
选择实体注册公司办理,更放心,更安全!我们的承诺:客户在留信官方认证查询网站查询到认证通过结果后付款,不成功不收费!
Comparing Stability and Sustainability in Agile Systems
Copy of the presentation given at XP2024 based on a research paper.
In this paper we explain wat overwork is and the physical and mental health risks associated with it.
We then explore how overwork relates to system stability and inventory.
Finally there is a call to action for Team Leads / Scrum Masters / Managers to measure and monitor excess work for individual teams.
W.H.Bender Quote 66 - ServPoints Sequence of Service™ should be Identified fo...
W.H.Bender Quote 66 - ServPoints Sequence of Service™ should be Identified fo...William (Bill) H. Bender, FCSI
Specific ServPoints should be tailored for restaurants in all food service segments. Your ServPoints should be the centerpiece of brand delivery training (guest service) and align with your brand position and marketing initiatives, especially in high-labor-cost conditions.
408-784-7371
Foodservice Consulting + Design
原版制作(澳洲WSU毕业证书)西悉尼大学毕业证文凭证书一模一样
学校原件一模一样【微信:741003700 】《(澳洲WSU毕业证书)西悉尼大学毕业证、文凭证书》【微信:741003700 】学位证,留信认证(真实可查,永久存档)原件一模一样纸张工艺/offer、雅思、外壳等材料/诚信可靠,可直接看成品样本,帮您解决无法毕业带来的各种难题!外壳,原版制作,诚信可靠,可直接看成品样本。行业标杆!精益求精,诚心合作,真诚制作!多年品质 ,按需精细制作,24小时接单,全套进口原装设备。十五年致力于帮助留学生解决难题,包您满意。
本公司拥有海外各大学样板无数,能完美还原。
1:1完美还原海外各大学毕业材料上的工艺:水印,阴影底纹,钢印LOGO烫金烫银,LOGO烫金烫银复合重叠。文字图案浮雕、激光镭射、紫外荧光、温感、复印防伪等防伪工艺。材料咨询办理、认证咨询办理请加学历顾问Q/微741003700
【主营项目】
一.毕业证【q微741003700】成绩单、使馆认证、教育部认证、雅思托福成绩单、学生卡等!
二.真实使馆公证(即留学回国人员证明,不成功不收费)
三.真实教育部学历学位认证(教育部存档!教育部留服网站永久可查)
四.办理各国各大学文凭(一对一专业服务,可全程监控跟踪进度)
如果您处于以下几种情况:
◇在校期间,因各种原因未能顺利毕业……拿不到官方毕业证【q/微741003700】
◇面对父母的压力,希望尽快拿到;
◇不清楚认证流程以及材料该如何准备;
◇回国时间很长,忘记办理;
◇回国马上就要找工作,办给用人单位看;
◇企事业单位必须要求办理的
◇需要报考公务员、购买免税车、落转户口
◇申请留学生创业基金
留信网认证的作用:
1:该专业认证可证明留学生真实身份
2:同时对留学生所学专业登记给予评定
3:国家专业人才认证中心颁发入库证书
4:这个认证书并且可以归档倒地方
5:凡事获得留信网入网的信息将会逐步更新到个人身份内,将在公安局网内查询个人身份证信息后,同步读取人才网入库信息
6:个人职称评审加20分
7:个人信誉贷款加10分
8:在国家人才网主办的国家网络招聘大会中纳入资料,供国家高端企业选择人才
20240608 QFM019 Engineering Leadership Reading List May 2024
Everything I found interesting about Engineering Leadership in May 2024
SOCIO-ANTHROPOLOGY FACULTY OF NURSING.....
Deals with people living and how they are taken care of bu health care workers
Recently uploaded (20)
CV Ensio Suopanki1.pdf ENGLISH Russian Finnish German
CV Ensio Suopanki1.pdf ENGLISH Russian Finnish German
Senior Project and Engineering Leader Jim Smith.pdf
Senior Project and Engineering Leader Jim Smith.pdf
Enriching engagement with ethical review processes
Enriching engagement with ethical review processes
Case Analysis - The Sky is the Limit | Principles of Management
Case Analysis - The Sky is the Limit | Principles of Management
Employment Practices
Regulation and Multinational Corporations
Employment Practices
Regulation and Multinational Corporations
Public Speaking Tips to Help You Be A Strong Leader.pdf
Public Speaking Tips to Help You Be A Strong Leader.pdf
Leadership Ethics and Change, Purpose to Impact Plan
Leadership Ethics and Change, Purpose to Impact Plan
Integrity in leadership builds trust by ensuring consistency between words an...
Integrity in leadership builds trust by ensuring consistency between words an...
W.H.Bender Quote 65 - The Team Member and Guest Experience
W.H.Bender Quote 65 - The Team Member and Guest Experience
Comparing Stability and Sustainability in Agile Systems
Comparing Stability and Sustainability in Agile Systems
W.H.Bender Quote 66 - ServPoints Sequence of Service™ should be Identified fo...
W.H.Bender Quote 66 - ServPoints Sequence of Service™ should be Identified fo...
20240608 QFM019 Engineering Leadership Reading List May 2024
20240608 QFM019 Engineering Leadership Reading List May 2024
Activity Network diagram
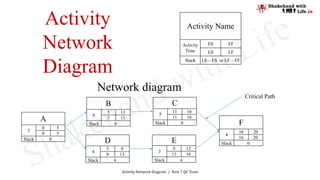
- 1. Activity Network Diagram / New 7 QC Tools A 5 0 5 0 5 Slack 0 B 6 5 11 5 11 Slack 0 C 5 11 16 11 16 Slack 0 D 4 5 9 9 13 Slack 4 E 3 9 12 13 16 Slack 4 F 4 16 20 16 20 Slack 0 Network diagram Critical Path Activity Name Activity Time ES EF LS LF Slack LS – ES or LF – EF Activity Network Diagram