Download as PDF, PPTX

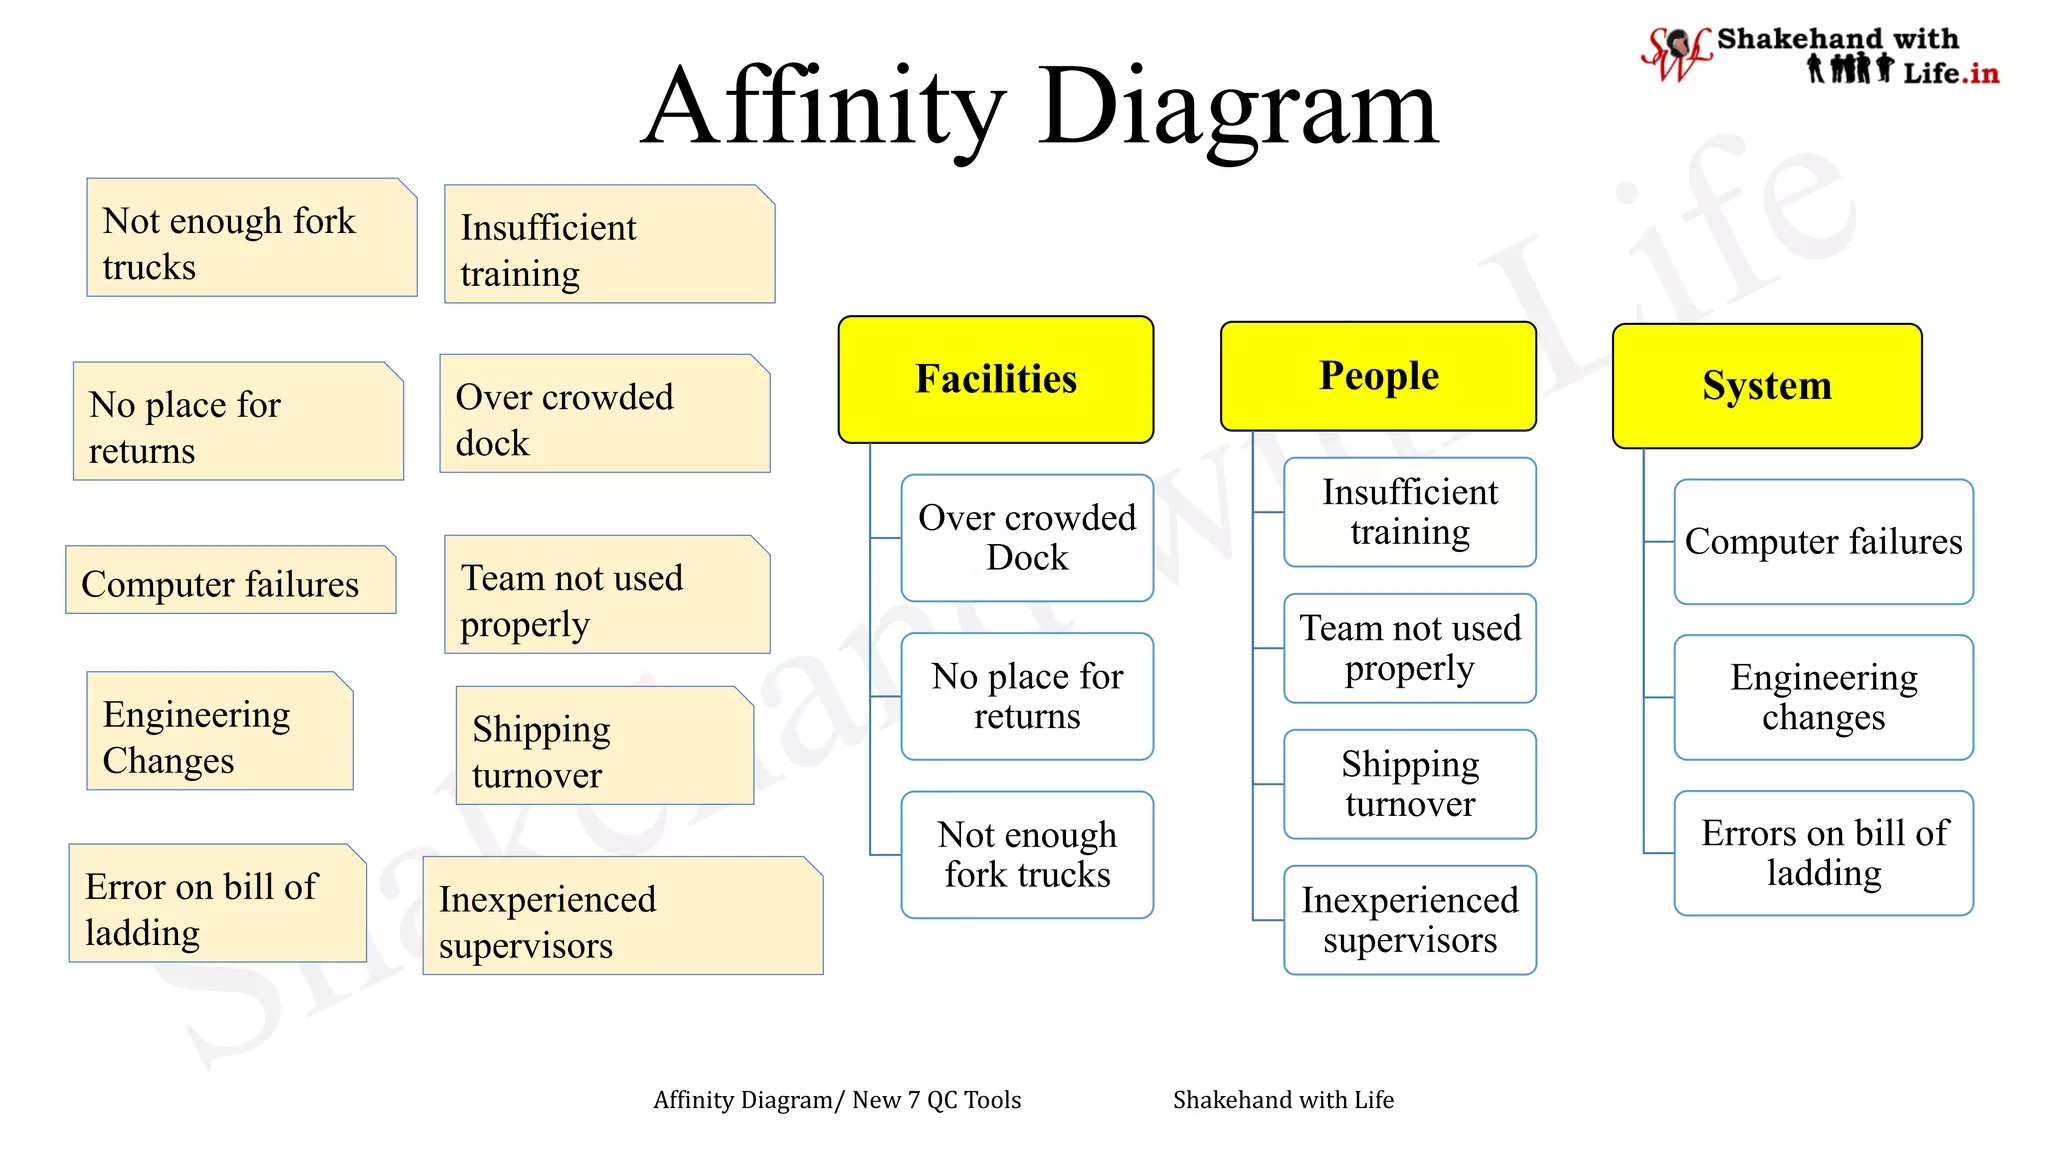

The document discusses issues related to overcrowded facilities, insufficient training, and inadequate resources like fork trucks, leading to operational inefficiencies. It highlights problems with inexperienced supervisors, computer failures, and errors in shipping documentation. The mention of affinity diagrams and QC tools suggests a focus on improving processes and teamwork.


