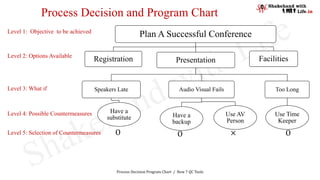
Process Decision and Program is designed to achieve a particular objective. Used especially in new process development. The tool avoids surprises and identifies the possible countermeasures.
Prioritization matrix prioritizes issues, based on weighted criteria using a combination of Tree and Matrix diagram. It is a very important tool for the management to prioritize the issue to work on.
For many businesses, getting the material from suppliers on time is a very important factor. This will decide their delivery to customers on time. As many companies in North America are procuring from China, it is all the more essential that the On Time Delivery is controlled efficiently. This presentation discusses the ways and means companies con control the On Time Delivery Metrics. This presentation also talks about a system that is common for all the trading partners and one in the cloud.
More https://quality.eqms.co.uk/blog/introduction-to-apqp
New to the advanced product quality planning framework?
Don't despair. In this article, Mike Bendall, Business Mentor at Qualsys, explains APQP, provides a checklist for each APQP phase, and there is a link to download his APQP training course for beginners.
Kaizen strategy is the single most important concept in Japanese management - the key to successful Japanese companies such as Toyota. Kaizen, which simply means continuous improvement, is the foundation for all Lean improvements. Kaizen events are opportunities to make focused changes in the workplace.
The Kaizen Poster depicts the key Kaizen concepts, principles, methods and tools for workplace continuous improvement.
The Poster comes in two themes: color and monochrome. Formatted in PDF and in editable PPTX, the poster can be easily printed on an A3-sized paper from an office copier machine and displayed on employee workstations, or distributed together with your workshop handouts.
The Kaizen Poster complements your Kaizen and Lean training presentation materials. It serves as a takeaway and summary of your process improvement presentation.
The Kaizen Poster includes:
1. Key Concepts of Kaizen
2. The Meaning of Kaizen
3. Ten Basic Principles of Kaizen
4. Kaizen Philosophy
5. Kaizen & Job Functions
6. Three Criteria of Kaizen
7. Three Main Types of Kaizen Activities
8. Kaizen Event Process
9. 5W & 1H of Kaizen
Interrelationship digraph is another important tool out of New 7 Quality Tools. It helps to clarify the interrelationship of many factors of a complex situation. It identifies key drivers and the key outcomes.
Layered Process Audits - The Compelling and Immediate ROIEase Inc.
Automotive and Aerospace manufacturing suppliers practice layered process audits to maintain quality control in increasingly demanding and challenging production environments. Learn the immediate ROI associated with this practice.
Lean six sigma and process excellence helps organisations to improve their productivity and reduce waste in the activities of management and operations. Here you can find out and learn about lean six sigma and its important aspects. Anexas Consultancy helps entrepreneurs and professional to grow their business and career in right direction. You can find more information here:http://www.leansixsigma.co.in/readmore.php?Service_Details&id=1
“Lean” is a management philosophy based on the Toyota Production System (TPS). With Lean Manufacturing, you will be able to enhance value for your customers by improving and smoothing the process flow and eliminating waste. Simply put, with Lean, you will be able to increase productivity and create greater customer value with less resources.
By teaching this presentation, managers and employees will have a better understanding of the Lean principles and approach to eliminating waste, and will be more forthcoming to lead and participate in the Lean implementation process.
LEARNING OBJECTIVES
1. Acquire knowledge on the key concepts and principles of Lean
2. Describe the common Lean methods and tools for waste elimination and value creation
3. Describe the key roles in Lean deployment
4. Define the success factors for sustaining a Lean culture
CONTENTS
1. Introduction to Lean Manufacturing
2. Key Concepts of Lean
3. Lean Methods & Tools
4. Lean Roles
5. Sustaining a Lean Culture
To download this presentation, visit:
https://www.oeconsulting.com.sg/training-presentations
7 QC Tools PDF | An eBook with A Detailed Description and Practical ExamplesShakehand with Life
Follow the link https://payhip.com/b/VCtH to download the complete eBook of '7 QC Tools PDF.
Train yourself and be the master of 7 QC Tools with this eBook of 7 QC Tools in PDF with a detailed description and illustrative examples of all 7 Quality Control Tools. Learn to construct the Histogram, Pareto Chart, Scatter Chart, Control Charts in Excel and analyze the data in Excel.
Activity network diagram helps to schedule a project efficiently. It gives an idea of the minimum and maximum time to complete a project. The 7th tool among the New 7 management development tool.
New 7 QC Tools; Affinity diagram, Interrelationship digraph, Tree diagram, Matrix diagram, Prioritization matrices, Process Decision and Program Chart (PDPC), and Activity Network Diagram. The New 7 QC Tools also known as 7 Management Development Tools. These tools unlike the 7 fundamentals quality control tools, process the subjective data and help the management to make the better decision, regarding project management and quality improvement.
The affinity diagram is one among the New 7 Quality Contol tools, helps to categorize the same type of ideas or issues. Affintiy diagram process the same type of subjective data in a particular category.
Course Catalog 2016-17, is the overview of various corporate trainings courses for our deemed clientele, so that they can lock the dates for in-house training facilitation at company site in the year of 2016-17.
7 QC Tools and SPC Training Dec.2015. Send nominations before 15 Nov. 2015 and get an attractive discount for early birds. Group discount for 5 or more is also available. For nomination form or call; 9468267324, 8684861131, e-mail shakehandwithlife@gmail.com,
Hypothesis is usually considered as the principal instrument in research and quality control. Its main function is to suggest new experiments and observations. In fact, many experiments are carried out with the deliberate object of testing hypothesis. Decision makers often face situations wherein they are interested in testing hypothesis on the basis of available information and then take decisions on the basis of such testing. In Six –Sigma methodology, hypothesis testing is a tool of substance and used in analysis phase of the six sigma project so that improvement can be done in right direction
People are often like a train, some are like its engine, leading the train forward. Some are like the bogies, chugging along, following the leader. While a few others are like the brakes, putting a stop to its motion. A leader is like the engine of this train. A man who will lead with trust and honesty, with speed and also ensure there are no accidents.”…………………………Narender Sharma
Times of India, LEAD INDIA, MAIL BOX, Page 2, dated; Aug. 24, 2007
Go through the seven quality tools training quiz and compare, how much you have learnt from this online training of 7QC tools? The quiz has 15 multiple choice questions based on seven quality tools. Choose one answer out of the given choices for every question write these choices on a paper. After completing the quiz compare yourself with answer key in the end of quiz. Find yourself where you are in learning of 7 QC Tools. If you find your performance is not up to the mark then go again for the training of seven QC tools. You may do it as many times as you want. Improve your performance every time you go through the training.
Seven QC Tools Training; Control Charts (Mean Chart and Range Chart)Shakehand with Life
Seven quality tools training is incomplete without learning of control charts. Control charts help to control the process with in the set control limits. Control charts are mainly two types; Mean Chart and Range Chart. Mean chart showcase the process data complied by the designated person and signal when the data go beyond the control limits. Every process has variation and due to this variation data get fluctuated. This fluctuation shown on the mean and range chart by data points. The causes of fluctuation in the data are assignable and common causes. Due to common causes data fluctuated around the average of the data but due to assignable cause data go beyond the control limits. When data go beyond the control limits control charts warn the operator that something is going wrong in the process and need to special attention. Mean chart is the spread of the mean values of the samples around the mean line. Range chart is spread of the range of samples around the mean line of range.
Scatter diagram is the graphical presentation of relationship between two variables. Scatter diagram is an important tool out of 7 fundamental tools of quality control. Scatter diagram helps to confirm the degree of relationship between cause and effect. Here cause is an independent variable and effect is dependent variable. Scatter diagram is an important statistical tool to analyze the relationship of two variables. To create the scatter diagram take the values of independent variable on X-Axis where as the dependent variable is taken on Y-Axis. Plot the intersection points of X and Y on the graph. Draw a straight line passing through all the points. Analyze the pattern of the points. For different degree of relationship different pattern of scatter diagram is formed. If Y increases as X increases and data points are on the straight line then there is perfect positive correlation. If Y decreases with increase of X and data points are on the straight line then there is perfect negative correlation. But when data is scattered all over the graph then there is zero correlation.
Process flow chart or Flow process chart among the seven quality control tools considered as the first and base of application of every quality tool. Process flow chart is the pictorial representations of all activities of process using different shape of boxes. Process flow chart is the guiding map of the whole process. With a single view, process flow chart gives almost every information about the whole process. Process flow diagram inform the starting and end point of the process along with the operations, decision, storage, delay, direction etc. through which the product or service passing. Different shapes like circle, rectangular circle, diamond, rectangle, arrows, D shapes, inverted rectangles etc. are used to construct process flow diagram. Process flow diagram clearly explains which operation is followed by which operation. Process flow chart helps to find out the potential trouble spots in the process so that corrective action can be taken to remove the hurdles at an early stage. To audit the whole process, process flow chart plays a vital role. Even for the new comers in the organization, process flow chart is an opportunity to understand their process easily.
Visit www.shakehandwithlife.in to buy this Book. This E-Book on 7QC tools is complete training workshop for Junior, Middle and Senior quality quality professionals. The USP of this workshop is the text and graphics in the book for understanding the tools while applying to solve the practial problems. Illustrative worked examples , Construction of tools in Excel like Histogram, Pareto Chart, Scatter Diagram, Control charts are beautifully explained in step step manner. A newcomer in the area of quality can easily understand how the tools be used and applied.
Measure of dispersion part II ( Standard Deviation, variance, coefficient of ...Shakehand with Life
This tutorial gives the detailed explanation measure of dispersion part II (standard deviation, properties of standard deviation, variance, and coefficient of variation). It also explains why std. deviation is used widely in place of variance. This tutorial also teaches the MS excel commands of calculation in excel.
Measure of dispersion part I (Range, Quartile Deviation, Interquartile devi...Shakehand with Life
This tutorial gives the detailed explanation of "Measure of Dispersion" (Range, Quartile Deviation, Interquartile Range, Mean Deviation) with suitable illustrative example with MS Excel Commands of calculation in excel.
This tutorial explain the measure of central tendency (Mean, Median and Mode in detail with suitable working examples pictures. The tutorial also teach the excel commands for calculation of Mean, Median and Mode.
A presentation on mastering key management concepts across projects, products, programs, and portfolios. Whether you're an aspiring manager or looking to enhance your skills, this session will provide you with the knowledge and tools to succeed in various management roles. Learn about the distinct lifecycles, methodologies, and essential skillsets needed to thrive in today's dynamic business environment.
The case study discusses the potential of drone delivery and the challenges that need to be addressed before it becomes widespread.
Key takeaways:
Drone delivery is in its early stages: Amazon's trial in the UK demonstrates the potential for faster deliveries, but it's still limited by regulations and technology.
Regulations are a major hurdle: Safety concerns around drone collisions with airplanes and people have led to restrictions on flight height and location.
Other challenges exist: Who will use drone delivery the most? Is it cost-effective compared to traditional delivery trucks?
Discussion questions:
Managerial challenges: Integrating drones requires planning for new infrastructure, training staff, and navigating regulations. There are also marketing and recruitment considerations specific to this technology.
External forces vary by country: Regulations, consumer acceptance, and infrastructure all differ between countries.
Demographics matter: Younger generations might be more receptive to drone delivery, while older populations might have concerns.
Stakeholders for Amazon: Customers, regulators, aviation authorities, and competitors are all stakeholders. Regulators likely hold the greatest influence as they determine the feasibility of drone delivery.
Comparing Stability and Sustainability in Agile SystemsRob Healy
Copy of the presentation given at XP2024 based on a research paper.
In this paper we explain wat overwork is and the physical and mental health risks associated with it.
We then explore how overwork relates to system stability and inventory.
Finally there is a call to action for Team Leads / Scrum Masters / Managers to measure and monitor excess work for individual teams.
Employment PracticesRegulation and Multinational CorporationsRoopaTemkar
Employment PracticesRegulation and Multinational Corporations
Strategic decision making within MNCs constrained or determined by the implementation of laws and codes of practice and by pressure from political actors. Managers in MNCs have to make choices that are shaped by gvmt. intervention and the local economy.
Senior Project and Engineering Leader Jim Smith.pdfJim Smith
I am a Project and Engineering Leader with extensive experience as a Business Operations Leader, Technical Project Manager, Engineering Manager and Operations Experience for Domestic and International companies such as Electrolux, Carrier, and Deutz. I have developed new products using Stage Gate development/MS Project/JIRA, for the pro-duction of Medical Equipment, Large Commercial Refrigeration Systems, Appliances, HVAC, and Diesel engines.
My experience includes:
Managed customized engineered refrigeration system projects with high voltage power panels from quote to ship, coordinating actions between electrical engineering, mechanical design and application engineering, purchasing, production, test, quality assurance and field installation. Managed projects $25k to $1M per project; 4-8 per month. (Hussmann refrigeration)
Successfully developed the $15-20M yearly corporate capital strategy for manufacturing, with the Executive Team and key stakeholders. Created project scope and specifications, business case, ROI, managed project plans with key personnel for nine consumer product manufacturing and distribution sites; to support the company’s strategic sales plan.
Over 15 years of experience managing and developing cost improvement projects with key Stakeholders, site Manufacturing Engineers, Mechanical Engineers, Maintenance, and facility support personnel to optimize pro-duction operations, safety, EHS, and new product development. (BioLab, Deutz, Caire)
Experience working as a Technical Manager developing new products with chemical engineers and packaging engineers to enhance and reduce the cost of retail products. I have led the activities of multiple engineering groups with diverse backgrounds.
Great experience managing the product development of products which utilize complex electrical controls, high voltage power panels, product testing, and commissioning.
Created project scope, business case, ROI for multiple capital projects to support electrotechnical assembly and CPG goods. Identified project cost, risk, success criteria, and performed equipment qualifications. (Carrier, Electrolux, Biolab, Price, Hussmann)
Created detailed projects plans using MS Project, Gant charts in excel, and updated new product development in Jira for stakeholders and project team members including critical path.
Great knowledge of ISO9001, NFPA, OSHA regulations.
User level knowledge of MRP/SAP, MS Project, Powerpoint, Visio, Mastercontrol, JIRA, Power BI and Tableau.
I appreciate your consideration, and look forward to discussing this role with you, and how I can lead your company’s growth and profitability. I can be contacted via LinkedIn via phone or E Mail.
Jim Smith
678-993-7195
jimsmith30024@gmail.com
Enriching engagement with ethical review processesstrikingabalance
New ethics review processes at the University of Bath. Presented at the 8th World Conference on Research Integrity by Filipa Vance, Head of Research Governance and Compliance at the University of Bath. June 2024, Athens
Org Design is a core skill to be mastered by management for any successful org change.
Org Topologies™ in its essence is a two-dimensional space with 16 distinctive boxes - atomic organizational archetypes. That space helps you to plot your current operating model by positioning individuals, departments, and teams on the map. This will give a profound understanding of the performance of your value-creating organizational ecosystem.
Specific ServPoints should be tailored for restaurants in all food service segments. Your ServPoints should be the centerpiece of brand delivery training (guest service) and align with your brand position and marketing initiatives, especially in high-labor-cost conditions.
408-784-7371
Foodservice Consulting + Design
Integrity in leadership builds trust by ensuring consistency between words an...Ram V Chary
Integrity in leadership builds trust by ensuring consistency between words and actions, making leaders reliable and credible. It also ensures ethical decision-making, which fosters a positive organizational culture and promotes long-term success. #RamVChary
Public Speaking Tips to Help You Be A Strong Leader.pdfPinta Partners
In the realm of effective leadership, a multitude of skills come into play, but one stands out as both crucial and challenging: public speaking.
Public speaking transcends mere eloquence; it serves as the medium through which leaders articulate their vision, inspire action, and foster engagement. For leaders, refining public speaking skills is essential, elevating their ability to influence, persuade, and lead with resolute conviction. Here are some key tips to consider: https://joellandau.com/the-public-speaking-tips-to-help-you-be-a-stronger-leader/
Public Speaking Tips to Help You Be A Strong Leader.pdf
Process Decision and Program Chart
1. Process Decision Program Chart / New 7 QC Tools
Process Decision and Program Chart
Plan A Successful Conference
Registration Presentation
Speakers Late
Have a
substitute
Audio Visual Fails
Have a
backup
Use AV
Person
Too Long
Use Time
Keeper
Facilities
Level 1: Objective to be achieved
Level 2: Options Available
Level 3: What if
Level 4: Possible Countermeasures
Level 5: Selection of Countermeasures ×OO O