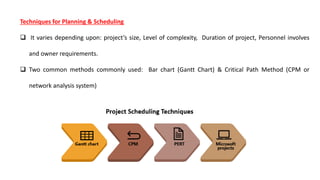
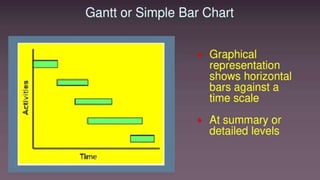
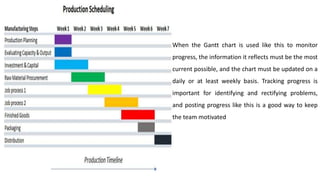
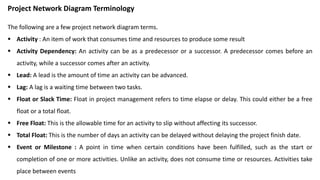
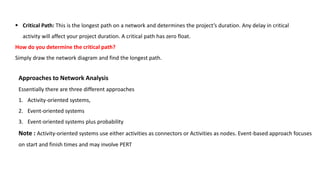
The document provides a comprehensive overview of project planning and scheduling, emphasizing the definition, importance, and techniques of these processes. It discusses the creation of a Work Breakdown Structure (WBS), the use of Gantt charts and network diagrams, and the critical path method for effective project management. Key principles include early planning, involving stakeholders, and incorporating flexibility to manage resources and timelines effectively.


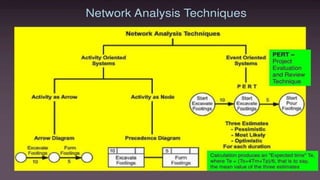


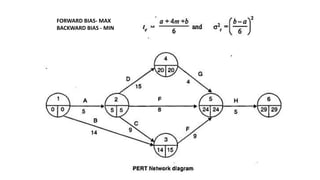
![The formula to calculate the PERT is as follows:
PERT Estimate = (Tp + 4Tm + To) / 6
Here: Tm is the Most Likely Estimate. In this estimate, the chance of completing an activity
is highest. To is the Optimistic Estimate. This estimate considers the best-case scenario, so
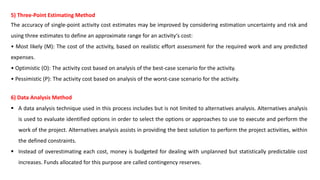
the duration estimate is the shortest here. Tp is the Pessimistic Estimate.
The variance for the activity is given by σ 2 = [(tp – to) / 6]](https://image.slidesharecdn.com/unitii-231027072615-d9d4ab9f/85/Unit-II-pptx-45-320.jpg)

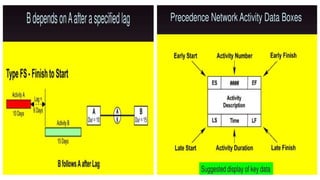
![Time [Earliest & latest] are calculated as follows:](https://image.slidesharecdn.com/unitii-231027072615-d9d4ab9f/85/Unit-II-pptx-54-320.jpg)