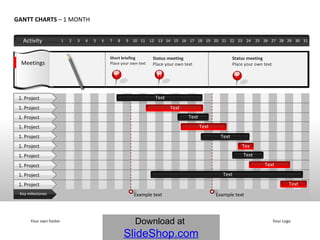

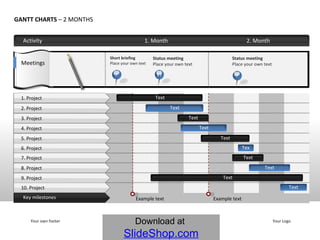
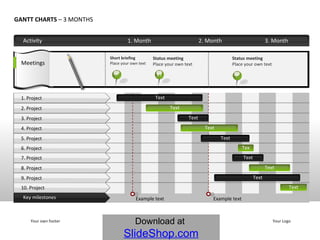
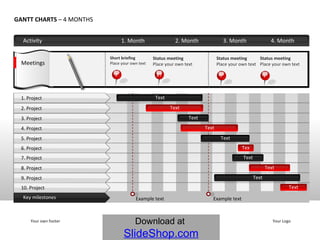

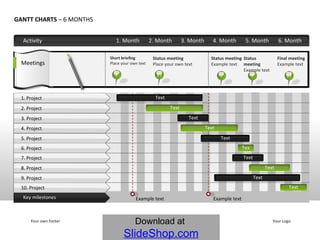
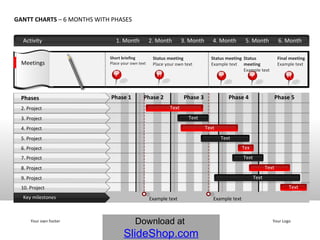

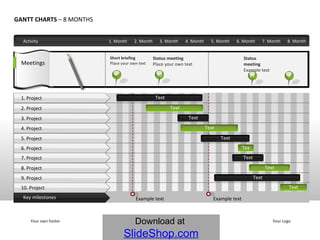

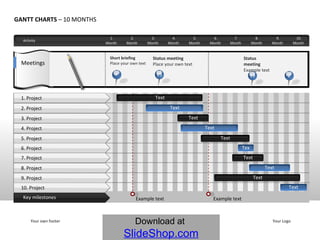

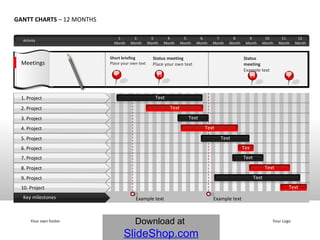
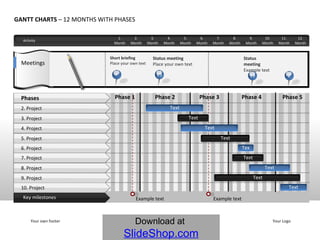
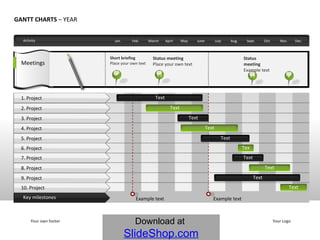
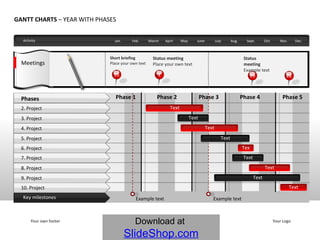

The document contains examples of Gantt charts spanning various time periods from 1 to 12 months and a year. The Gantt charts show planned project timelines with key milestones and phases. Some examples include phases within the timelines. The purpose is to provide templates that can be customized with user input for project planning and scheduling.


![Gulayaan sa Paaralan Project [GPP] - Project Proposal for FY 2014](https://cdn.slidesharecdn.com/ss_thumbnails/gppprojectproposal-130817112142-phpapp01-thumbnail.jpg?width=640&height=640&fit=bounds)


